 🏢 Co-op
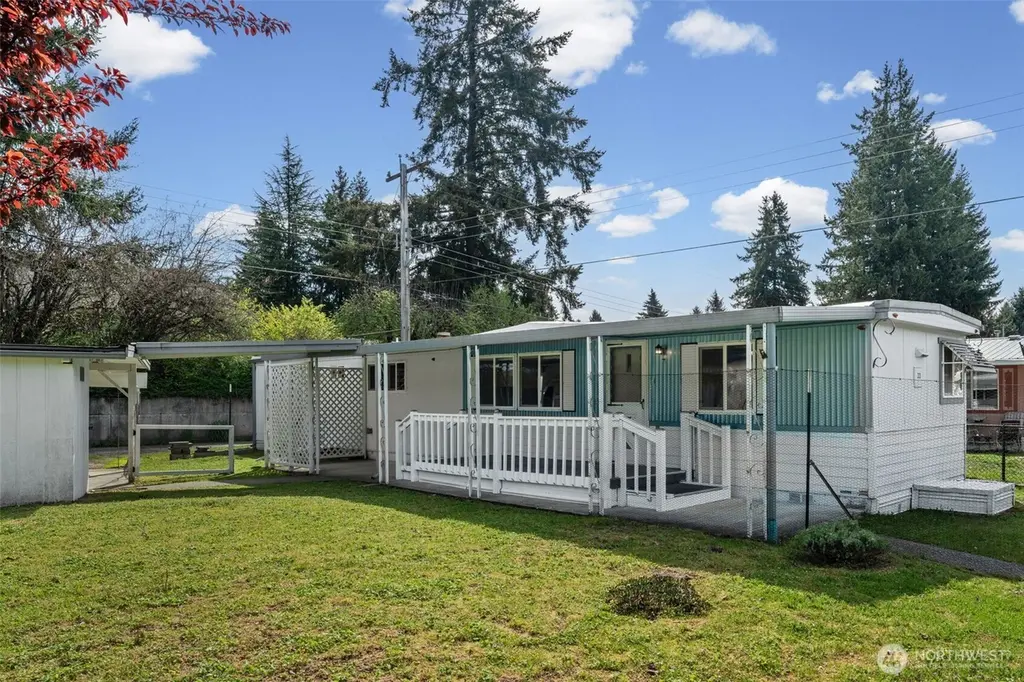
930 Trosper Rd SW #33 · Tumwater, WA
Flood risk 1/10 · Minimal
- FEMA flood zone
- X (unshaded)
- Chance of flooding over 30 yrs
- 0.0%
- Est. flood insurance / yr
- $507 – $1,088
Fire risk 1/10 · Minimal
- Est. fire insurance / yr
- $604 – $1,122
Heat risk 3/10 · Minor
- Hot days now (above 88°F)
- 7 days/yr
- Hot days in 30 yrs
- 14 days/yr
Wind risk 1/10 · Minimal
- Chance of severe wind over 30 yrs
- —
Air-quality risk 6/10 · Moderate
- Unhealthy air days now
- 7 days/yr
- Unhealthy air days in 30 yrs
- 8 days/yr
Risk factors via First Street. Map © Google.
Why this score? — see what drove the B+ grade
The composite is a weighted blend of 9 inputs, each scored 0–100. Each bar is that input's sub-score; the figure is the points it added to the 100-point composite (weight × sub-score).
- Cash flow +30.0/30.0
- ARV discount +11.1/15.0
- 1% rule +10.0/10.0
- DSCR +10.0/10.0
- Schools +5.6/10.0
- Livability +4.2/5.0
- Rent growth +3.1/5.0
- Condition / age +2.5/5.0
- Appreciation +0.0/10.0
$52,900
🖨 Deal sheet (PDF) 📄 Offer letter ✓ Due diligence
Listing remarks
Welcome home to this well-maintained residence in a convenient 55+ Co-Op community! Thoughtfully updated over time, this home features new vinyl plank flooring in the kitchen and bathroom, along with freshly cleaned carpets throughout. The bathroom has been refreshed with modern finishes, including an updated sink, tub, surround, and new bath fan. The roof has just been recoated/sealed, and a newer mini split (2022) provides efficient year-round comfort, with the original natural gas furnace available as a backup heat source. Additional updates include replacement vinyl double-pane windows & kitchen cabinets. Enjoy one of the larger yards in the community, plus a workshop/storage shed
Key facts
- Larger yards
- Modern finishes
- Kitchen cabinets
Tags
Property features AI
Finance
- Other: Tax information available; Public records list building area as 720 square feet
- Financial info: Land lease $720 monthly; Listing terms: Cash
- HOA & community: Located in Tumwater Mobile Estates (136 homes); Park amenities include clubhouse, common area, and sidewalks; Senior community
Exterior
- Parking: Carport
- Utilities: Public water (City of Tumwater); Public sewer (City of Tumwater); Electric power (Puget Sound Energy); Energy sources: Electric and Natural Gas; Natural gas water heater
- Home design: Manufactured single wide home; One story; Entry level on main floor; Facing direction not specified; Model MNAS1; Property in good condition; Mobile home remains on site; Metal skirting
- Construction: Metal/vinyl construction; Torch down roof; Built as a manufactured house
- Exterior features: Metal/vinyl exterior; Awnings; Double pane windows; Drapes; Landscaped; Patio/porch/deck; Alley access; Cul-de-sac location; Curbs and sidewalk; Has view
Interior
- Kitchen: Disposal; Refrigerator; Stove/Range
- Bedrooms: 2 bedrooms
- Flooring: Vinyl; Vinyl plank; Carpet
- Bathrooms: 1 full bathroom with tub and separate shower
- Heating & cooling: Ductless heating; Forced air heating; Cooling available
- Interior features: Water heater; Tie down foundation
- Laundry & utility: Water heater located at left rear exterior wall access door
Neighborhood map
What this means for you Summary
Snapshot
- This is a 2-bed/1.0-bath manufactured listed at $53k.
Deal economics
- At list price, monthly cash flow is $1k ($13k/yr) — positive.
- The deal already cash-flows at list — no discount required.
- Meets the 1% rule at list price ($2k rent vs $53k).
- Recommended offer: $51k (3.0% below list) — sets the bar for market timing.
- Cap rate 31.4% vs local median 2.7% in Tumwater — top-decile yield for the area; either an underpriced asset or a hidden risk that comps aren't pricing in. Stress-test before assuming the spread holds.
Location & tenants
- Location reads 84/100 on livability (#39 in WA, #700 nationally) — a professional / high-income tenant draw. Strengths: commute A+, housing A+, health & safety A+; Watch: amenities D, cost of living D-.
- Tumwater School District (urban): math 57% / reading 69% proficiency, ranked #37 of 291 in WA (top 13%) — acceptable for families but not a draw, mixed tenant base, ~2y average lease.
- Zoned schools: Michael T Simmons Elementary (479 students, 40% FRL); Tumwater Middle School (616 students, 32% FRL); A G West Black Hills High School (833 students, 32% FRL).
- Market conditions: Rents rising (+2.3%/yr); 236 active listings in the ZIP; 6 comparable units currently listed for rent nearby; rentals at typical pace (median 15d on market — plan ~3-4 weeks tenant-placement turnaround); solid renter incomes; 1,222 units permitted in Thurston County in 2024 (508 in 5+ unit buildings).
Forward outlook
- Local home prices are declining (-3.0%/yr); year-one equity from $366 of loan paydown is wiped out by about $2k of value loss. Plan a longer hold.
- Thurston County population projected at +27% by 2050 — long-run rental-demand tailwind backs the buy-and-hold thesis.
- At projected returns (-3.0% appreciation + 2.3% rent growth), your $15k cash investment doubles in ~2 years — after that, you're playing with house money.
Negotiation context
- It's been on market 57 days — a 3% lower offer ($51k) is reasonable based on typical stale-listing flexibility.
- 2 sale attempts since 21y ago; this cycle's ask has dropped $13k (20%) from the opening price — seller is motivated, your offer sets the floor, not the list.
- Current owner paid $12k; list at $53k implies a 360% gain — meaningful room to come down on a strong offer.
Questions for the listing agent
- It's been on market 57 days. Have you received any prior offers? Is the seller open to a 3% concession, seller financing, or rate buy-down credit?
- Built in 1969 — when were the roof, HVAC, electrical panel, plumbing, and water heater last replaced?
- Is there a deadline driving the sale (1031 exchange, divorce, estate, relocation)? That informs how much negotiation room exists.
- Schools are A-rated — typically a magnet for longer-tenancy family renters. What's the average tenant stay here, and is there a school-zone premium baked into asking?
- What's the average days-on-market for RENTAL listings here right now (not sales)? A rising rental-DOM trend means longer vacancies and softer asking-rent achievability than the comps imply.
- What's the recent tenant-quality profile in this submarket — average credit score on applications, eviction rate, late-payment / NSF rate, and stable-employment percentage? A property-management company in the area should have these aggregated.
- How much new for-sale + rental construction is in the pipeline within 1–3 miles? Heavy new supply typically softens prices + rents 12–24 months out; constrained supply supports both.
Investment metrics
- 1% rule
- 3.44% ✓
- Cap rate
- 31.35%
- Cash-on-cash
- 89.49%
- DSCR
- 4.98
- GRM
- 2.4
CMA / ARV
- ARV (median comp)
- $57,485
- List price
- $52,900
- Delta
- -7.98%
- Verdict
- FAIR
- Comps
- 3 within 1.0 mi
Show comp detail 4 sales within ~0.75 mi
| Address | Dist | Beds/Ba | Sqft | Sold | Price | $/sf | Match |
|---|---|---|---|---|---|---|---|
| 5705 Littlerock Rd SW #15 | 0.34mi | 2/1.0 | 728 (+1%) | 10mo | $55,000 | $76 | 74 |
| 930 Trosper Rd SW #127 | 0.09mi | 2/1.0 | 672 (-7%) | 14mo | $62,500 | $93 | 73 |
| 5705 Litterock Rd SW #45 | 0.34mi | 2/1.0 | 700 (-3%) | 11mo | $57,500 | $82 | 71 |
| 1841 Trosper Rd SW #24 | 0.42mi | 2/1.0 | 768 (+7%) | 8mo | $84,500 | $110 | 63 |
Match score weights: distance 35% · size 25% · config 20% · recency 20%. Top-matched comps best support the ARV.
Projected returns pro-forma
-3.0% appreciation · 2.26% rent growth · sell at horizon
- IRR
- 89.3%
- Equity multiple
- 5.08×
- Total profit
- $60,444
- Equity at exit
- $7,888
- IRR
- 92.1%
- Equity multiple
- 10.30×
- Total profit
- $137,817
- Equity at exit
- $4,574
Cash invested: $14,812 (down + closing). Projections, not guarantees.
Landlord ↔ Tenant lean methodology
- Overall (STATE)
- 28 Tenant-Leaning
- State Washington
- 28 Tenant-Leaning · D+8
- County
- — inherits STATE
- City
- — inherits STATE
ZIP-level market 98512
- Rents YoY
- 2.3%
- Active inventory
- 236
- Price-to-rent
- 2.4×
Monthly cashflow live
- Estimated rent
- $1,820 high interval (Pro) →
- Mortgage (P&I)
- −$277
- Tax from tax record
- −$34 /mo · $403/yr
- Insurance
- −$22
- HOA
- −$0
- Vacancy / Maint / Mgmt
- −$382
- Net cashflow
- $1,105
Break-even live
Sensitivity live
| Price | -10% $1,135 | -5% $1,120 | +0% $1,105 | +5% $1,090 | +10% $1,075 |
|---|---|---|---|---|---|
| Rent | -10% $961 | -5% $1,033 | +0% $1,105 | +5% $1,176 | +10% $1,248 |
| Rate | -1.0pp $1,131 | -0.5pp $1,118 | base $1,105 | +0.5pp $1,091 | +1.0pp $1,077 |
UW: 25.0% down · 7.5% · 30yr · 1.5% tax · 5.0% vac · 8.0% maint · 8.0% mgmt
Financing live
Cash to close
- Down payment
- $13,225
- Closing costs
- $1,587
- Reserves months
- —
- Total cash needed
- —
Loan-product check · same deal, 3 products live
Conventional
25% down · 7.5% · 30yr
- Down + closing
- —
- Monthly P&I
- —
- Monthly cashflow
- —
- DSCR
- —
- Eligible?
- —
Personal DTI + credit; lowest rate.
DSCR
20% down · 8.5% · 30yr
- Down + closing
- —
- Monthly P&I
- —
- Monthly cashflow
- —
- DSCR
- —
- Eligible?
- —
No personal income docs; deal must DSCR.
Hard money
10% down · 12.0% · 12mo
- Down + closing
- —
- Monthly P&I
- —
- Monthly cashflow
- —
- DSCR
- —
- Eligible?
- —
Short-term bridge; refi at stabilization.
Rent comps 6 comps
| Address | Beds | Baths | Sqft | Rent | $/sqft | DOM | Units | Dist |
|---|---|---|---|---|---|---|---|---|
| 301 Lee St SW Tumwater, WA | 1.0 | 1.0 | 650 | $1,385 | $2.13 | 45d | 1 | 0.61mi |
| 301 T St SW Tumwater, WA | 2.0 | 1.0 | 589 | $1,635 | $2.78 | 15d | 5 | 0.70mi |
| 215 Pinehurst Dr SW Tumwater, WA | 2.0 | 1.0–2.5 | 759 | $1,950 | $2.57 | 15d | 4 | 0.75mi |
| 1517 Bishop Rd SW Tumwater, WA | 2.0 | 1.0–2.0 | 669 | $1,930 | $2.88 | 15d | 1 | 0.94mi |
| 1704 Barnes Blvd SW Tumwater, WA | 1.0–3.0 | 1.0–2.5 | 920 | $2,004 | $2.18 | 15d | 35 | 0.96mi |
| 6705 Linderson Way SW Tumwater, WA | 1.0–3.0 | 1.0–2.0 | 900 | $2,038 | $2.26 | 15d | 6 | 1.02mi |
Listing history 20 events
-
2026-06-19status $52,900 Pending 57 DOM
-
2026-06-18days on market $52,900 Active 57 DOM
-
2026-06-17days on market $52,900 Active 56 DOM
-
2026-06-16days on market $52,900 Active 55 DOM
-
2026-06-15days on market $52,900 Active 54 DOM
-
2026-06-14days on market $52,900 Active 52 DOM
-
2026-06-13days on market $52,900 Active 51 DOM
-
2026-06-10days on market $52,900 Active 49 DOM
-
2026-06-09days on market $52,900 Active 48 DOM
-
2026-06-08days on market $52,900 Active 47 DOM
-
2026-06-07pricedays on market $52,900 Active 46 DOM
-
2026-06-05days on market $57,900 Active 43 DOM
-
2026-06-02days on market $57,900 Active 41 DOM
-
2026-06-01days on market $57,900 Active 40 DOM
-
2026-05-31days on market $57,900 Active 39 DOM
-
2026-05-30days on market $57,900 Active 38 DOM
-
2026-05-05price $57,900
-
2026-04-22$65,900 Active
-
2006-02-28soldstatus $11,500
-
2005-11-28$13,000
ⓘ Source: listings_history table (triggers on properties + properties_extension) + one-shot
backfill from property_details.listing_events for pre-trigger history.
Tax reassessment forecast WA · Resets to sale price
- Current annual tax
- $403 · $34/mo
- Projected year-2 tax
- $518 · $43/mo
- Expected delta
- +$116/yr (+$10/mo · 28.7%)
ⓘ Screening estimate from a state-policy table — verify with the county assessor before closing.
Climate risk First Street
- Flood 1/10 Low FEMA zone X (unshaded) · 0% chance over 30 yrs
- Wildfire 1/10 Low
- Heat 3/10 Moderate 7 d/yr ≥88°F today · 14 d/yr by 30 yrs out
- Wind 1/10 Low
- Air quality 6/10 Major 7 unhealthy d/yr today · 8 by 30 yrs out
Nearby sold comps map
Loading sold comps map…
Walkable amenities ~0.75 mi
Loading nearby amenities…
Taxation est. · year 1
- Rental income
- $21,838
- − Mortgage interest
- −$2,963
- − Property taxes
- −$403
- − Insurance
- −$264
- − Repairs & maintenance
- −$1,747
- − Management
- −$1,747
- − Depreciation
- −$1,539
- Taxable income
- $13,174
- Est. tax owed @ 24.0%
- −$3,162
- After-tax cash flow
- $10,094/yr
For passive investors: Depreciation is non-cash, so a rental often shows a tax loss while cash-flowing — sheltering income. Rental losses are passive: they offset passive income freely, and up to $25,000/yr can offset ordinary (W-2) income if you actively participate and your MAGI is under $100k (phasing out to $0 by $150k); unused losses carry forward. On sale, claimed depreciation is recaptured at up to 25%, and gains may owe capital-gains tax (a 1031 exchange can defer both). Figures are a year-1 estimate at your 24.0% rate — not tax advice; consult a CPA.
Schools (NCES district)
- District
- Tumwater School District
- NCES district ID
- 5309100
- Math proficiency
- 57% ▬ 0.00%
- Reading proficiency
- 69% ▼ -1.00%
- Median HH income
- $64,209
- Composite
- 56.38/100
- National rank
- #2477
- State rank
- #37 of 291 in WA
Livability — Tumwater
- Score
- 84/100
- State rank
- #39
- US rank
- #700
Category grades
Schools grade is shown separately in the Schools card above.
Census & demographics
- Census place
- Tumwater, WA
- County
- Thurston County · 269,345 people
- City population
- 46,937
- Metro
- Olympia-Lacey-Tumwater, WA
- Population (ZIP)
- 31,864
- Household income
- $101,530
- Rent vs Own
- Severe rent burden
- 784.0
Population outlook (Thurston County) Hauer SSP2
- Today (2025)
- 308,239 people
- By 2030
- 326,483 · +5.9%
- By 2040
- 359,890 · +16.8%
- By 2050
- 391,800 · +27.1%
- By 2075
- 468,024 · +51.8%
- By 2100
- 519,890 · +68.7%
Race, ethnicity, and origin ACS 2023
- Neighborhood character
- Predominantly White (72%)
- Race & ethnicity
- White 72% Two or more races 13% Hispanic / Latino 9% Asian 4% Black 3% Native American 1%
- Hispanic origin (detail)
- Mexican 5%
- Common ancestry
- Portuguese 4% Italian 4% Slovak 4%
- Foreign-born
- 6% · Canada, Vietnam, China
- Languages at home
- 92% English-only · Spanish 3% Vietnamese 1% German/W. Germanic 1%
Political lean MEDSL · Thurston
- 2024 margin
- Strong D (+20.4) · D 58.5% · R 38.1% · Other 3.5%
- 2008→2024 swing
- -1.3pp toward R · 2008: 21.7pp · 2024: 20.4pp
- All cycles
- 2024: D+20.4 2020: D+18.6 2016: D+15.4 2012: D+19.0 2008: D+21.7
Not yet ingested
- Civics
- —
Market trends
- HPI YoY
- ▼ -348.18%
- Current HPI
- 347.121
- Rent YoY
- ▲ 2.26%
- Metro
- Olympia-Lacey-Tumwater, WA
- State GDP YoY
- ▲ 4.65%
- F500 in state
- 22
Industry mix (Fortune 500 HQ in WA)
| Industry | F500 HQs | Revenue |
|---|---|---|
| Retail | 2 | $269B |
|
||
| Technology / Retail | 1 | $638B |
|
||
| Technology | 1 | $245B |
|
||
| Telecommunications | 1 | $38B |
|
||
| Food / Beverage | 1 | $36B |
|
||
| Automotive / Trucks | 1 | $34B |
|
||
Price history
+306.9% since first listed6 events — show timeline
- 2026-06-18 Pending — NWMLS as Distributed by MLS Grid
- 2026-06-05 Price Changed $52,900 NWMLS as Distributed by MLS Grid
- 2026-05-05 Price Changed $57,900 NWMLS as Distributed by MLS Grid
- 2026-04-22 Listed $65,900 NWMLS as Distributed by MLS Grid
- 2006-02-28 Sold (MLS) $11,500 NWMLS as Distributed by MLS Grid
- 2005-11-28 Listed $13,000 NWMLS as Distributed by MLS Grid
Property tax history
+10.7%/yrLatest (2026): $403 · +25.2% YoY. Source: county tax records.
Cash-flow waterfall
monthlySold comps — $/sqft
last 12 mo · ≤1 miLoading sold comps…