 🏷️ Likely Rental
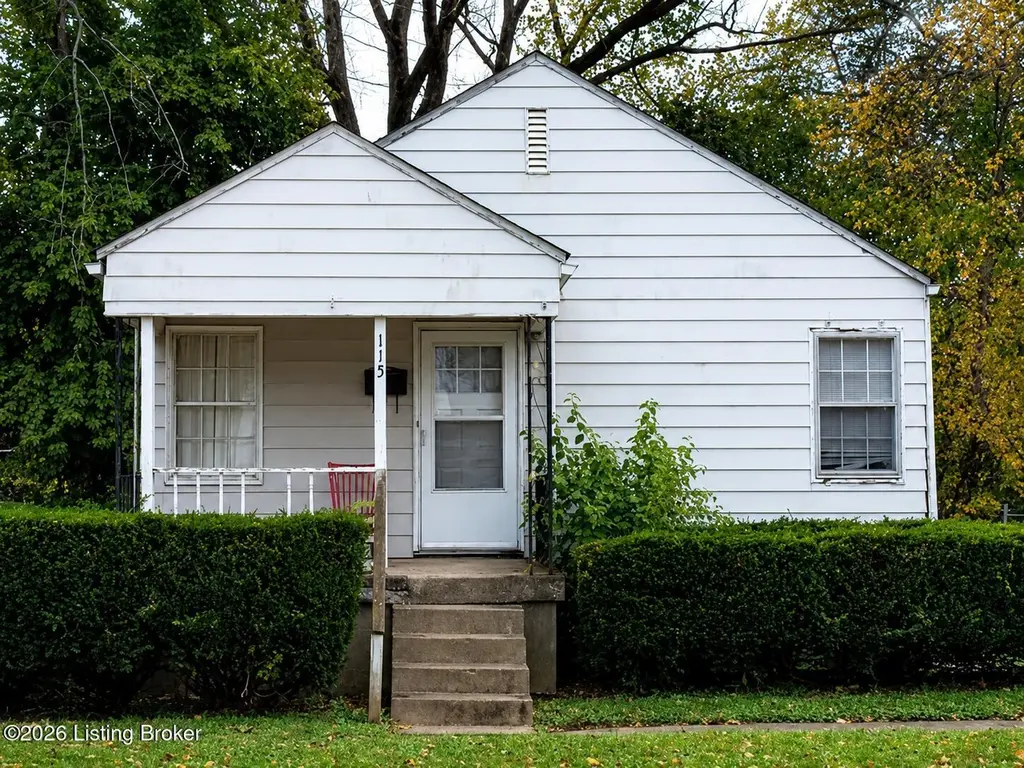
115 N 45th St · Louisville, KY
Flood risk 1/10 · Minimal
- FEMA flood zone
- X (unshaded)
- Chance of flooding over 30 yrs
- 0.0%
- Est. flood insurance / yr
- $473 – $860
Fire risk 1/10 · Minimal
- Est. fire insurance / yr
- $839 – $1,559
Heat risk 5/10 · Moderate
- Hot days now (above 104°F)
- 7 days/yr
- Hot days in 30 yrs
- 20 days/yr
Wind risk 2/10 · Minimal
- Chance of severe wind over 30 yrs
- 1.0%
Air-quality risk 2/10 · Minimal
- Unhealthy air days now
- 1 days/yr
- Unhealthy air days in 30 yrs
- 2 days/yr
Risk factors via First Street. Map © Google.
Why this score? — see what drove the A grade
The composite is a weighted blend of 9 inputs, each scored 0–100. Each bar is that input's sub-score; the figure is the points it added to the 100-point composite (weight × sub-score).
- Cash flow +30.0/30.0
- ARV discount +15.0/15.0
- 1% rule +10.0/10.0
- DSCR +10.0/10.0
- Appreciation +10.0/10.0
- Livability +3.2/5.0
- Rent growth +2.6/5.0
- Condition / age +2.5/5.0
- Schools +2.3/10.0
$74,995
🖨 Deal sheet 📄 Offer letter ✓ Due diligence
Listing remarks MLS
This 2Bed/1Bath is rented for $525 per month. The tenants are on a month to month lease. New Furnace and Water Heater 2011. Interior photos were taken before tenants moved in. Listing agent has an ownership stake in the property. Allow 48 hours for showings. See Documents tab for other houses for sale in this investor portfolio.
Key facts
- 5,662 sq ft lot
- Built 1947
- Listed 38 days
Property features AI
Finance
- HOA & community: No association fee
Exterior
- Utilities: Electricity connected; Natural gas available
- Home design: Single-family residence; Traditional style; 1 story
- Construction: Built in 1947; Aluminum siding; Shingle roof; Above-grade finished area and additional below-grade finished space
- Exterior features: Lot approximately 0.13 acres
Interior
- Kitchen: Kitchen on the first floor
- Bedrooms: 2 bedrooms
- Bathrooms: 1 full bathroom
- Heating & cooling: Forced air heating; Natural gas heat
- Interior features: Partially finished basement; Basement present; One total room listed
- Laundry & utility: No first-floor laundry
Neighborhood map
What this means for you Summary
Snapshot
- This is a 2-bed/1.0-bath single-family listed at $75k.
Deal economics
- At list price, monthly cash flow is $404 ($5k/yr) — positive.
- The deal already cash-flows at list — no discount required.
- Meets the 1% rule at list price ($1k rent vs $75k).
- Recommended offer: $73k (3.0% below list) — sets the bar for market timing.
- Cap rate 12.8% vs local median 5.0% in Louisville — top-decile yield for the area; either an underpriced asset or a hidden risk that comps aren't pricing in. Stress-test before assuming the spread holds.
Location & tenants
- Location reads 63/100 on livability (#333 in KY) — a middle-class / working-renter tenant base. Strengths: cost of living A+, housing A+; Watch: employment C-, health & safety D+, schools D-.
- Jefferson County (urban): math 19% / reading 35% proficiency, ranked #121 of 165 in KY (top 73%) — low school quality limits family demand, transient renter base, plan for 1-2y turnover.
- Market conditions: Rents flat; 140 active listings in the ZIP; 40 comparable units currently listed for rent nearby; rentals at typical pace (median 19d on market — plan ~3-4 weeks tenant-placement turnaround); lower-income renter base — watch delinquency; 2,836 units permitted in Jefferson County in 2024 (1,558 in 5+ unit buildings).
- This rent runs 38% of the median local income ($36k/yr) — at the standard rent-burdened threshold; future hikes will face affordability resistance.
Forward outlook
- In year one you build about $8k of equity ($518 loan paydown + $7k appreciation (10.0% local appreciation)).
- Jefferson County population projected at +13% by 2050 — modest demand growth; plan on rents tracking national, not racing it.
- At projected returns (10.0% appreciation + 0.5% rent growth), your $21k cash investment doubles in ~2 years — after that, you're playing with house money.
- By year 5, paydown + projected appreciation supports a ~$37k cash-out refi (75% LTV) — recoverable capital for the next deal without selling this one.
Negotiation context
- It's been on market 38 days — a 3% lower offer ($73k) is reasonable based on typical stale-listing flexibility.
- 5 sale attempts since 17y ago; this cycle's ask is 7% above the opening price — seller raised mid-cycle; expect resistance to lowballs.
Risks & watch-outs
- Watch-outs: built in 1947 — expect roof / HVAC / electrical / plumbing capex.
- Climate carrying-cost: extreme-heat days projected 7→20/yr by 2055 (HVAC capex compounding) — expect insurance premiums to compound above CPI over the hold.
Questions for the listing agent
- It's been on market 38 days. Have you received any prior offers? Is the seller open to a 3% concession, seller financing, or rate buy-down credit?
- Built in 1947 — when were the roof, HVAC, electrical panel, plumbing, and water heater last replaced?
- Is there a deadline driving the sale (1031 exchange, divorce, estate, relocation)? That informs how much negotiation room exists.
- Schools are D-rated, which usually means shorter tenancies and higher turnover. Who's the typical renter profile here, and what's been the actual vacancy rate?
- Crime grade is F in this area — have there been break-ins, vandalism, or insurance claims at this property in the last 3 years? What carrier currently insures it and at what premium?
- What's the average days-on-market for RENTAL listings here right now (not sales)? A rising rental-DOM trend means longer vacancies and softer asking-rent achievability than the comps imply.
- What's the recent tenant-quality profile in this submarket — average credit score on applications, eviction rate, late-payment / NSF rate, and stable-employment percentage? A property-management company in the area should have these aggregated.
- How much new for-sale + rental construction is in the pipeline within 1–3 miles? Heavy new supply typically softens prices + rents 12–24 months out; constrained supply supports both.
Investment metrics
- 1% rule
- 1.50% ✓
- Cap rate
- 12.75%
- Cash-on-cash
- 23.07%
- DSCR
- 2.03
- GRM
- 5.5
CMA / ARV
- ARV (on-the-fly)
- $99,144
- Comps found
- 12
Show comp detail 12 sales within ~0.75 mi
| Address | Dist | Beds/Ba | Sqft | Sold | Price | $/sf | Match |
|---|---|---|---|---|---|---|---|
| 356 N 43rd St | 0.23mi | 2/1.0 | 1,200 (-2%) | 1mo | $95,000 | $79 | 85 |
| 429 N 44th St | 0.21mi | 2/1.5 | 1,268 (+4%) | 1mo | $112,000 | $88 | 81 |
| 125 N 46th St | 0.10mi | 2/1.0 | 1,107 (-10%) | 6mo | $95,000 | $86 | 74 |
| 127 N 39th St | 0.41mi | 2/1.0 | 1,197 (-2%) | 8mo | $80,000 | $67 | 70 |
| 431 N 44th St | 0.22mi | 2/1.0 | 1,350 (+10%) | 5mo | $109,994 | $81 | 69 |
| 220 N 39th St | 0.38mi | 3/2.0 (+1) | 1,240 (+1%) | 4mo | $145,000 | $117 | 68 |
| 431 Amy Ave | 0.69mi | 2/1.0 | 1,223 (-0%) | 5mo | $80,000 | $65 | 64 |
| 100 Boston Ct | 0.22mi | 3/1.0 (+1) | 1,080 (-12%) | 9mo | $35,000 | $32 | 58 |
| 4149 W Muhammad Ali Blvd | 0.56mi | 3/1.0 (+1) | 1,327 (+8%) | 3mo | $88,000 | $66 | 52 |
| 3931 Northwestern Pkwy | 0.66mi | 2/1.0 | 1,373 (+12%) | 5mo | $100,000 | $73 | 45 |
| 210 N 35th St | 0.67mi | 3/1.0 (+1) | 1,119 (-9%) | 7mo | $100,000 | $89 | 43 |
| 3801 Miami Ave | 0.72mi | 3/1.0 (+1) | 1,120 (-8%) | 10mo | $134,900 | $120 | 39 |
Match score weights: distance 35% · size 25% · config 20% · recency 20%. Top-matched comps best support the ARV.
Projected returns pro-forma
10.0% appreciation · 0.51% rent growth · sell at horizon
- IRR
- 40.3%
- Equity multiple
- 4.04×
- Total profit
- $63,801
- Equity at exit
- $67,561
- IRR
- 33.8%
- Equity multiple
- 8.74×
- Total profit
- $162,610
- Equity at exit
- $145,699
Cash invested: $20,999 (down + closing). Projections, not guarantees.
Landlord ↔ Tenant lean methodology
- Overall (STATE)
- 83 Strongly Landlord-Friendly
- State Kentucky
- 83 Strongly Landlord-Friendly · R+16
- County
- — inherits STATE
- City
- — inherits STATE
ZIP-level market 40212
- Home prices YoY
- 11.0%
- Rents YoY
- 0.5%
- Active inventory
- 140
- Price-to-rent
- 5.5×
Monthly cashflow live
- Estimated rent
- $1,128 high interval (Pro) →
- Mortgage (P&I)
- −$393
- Tax from tax record
- −$63 /mo · $756/yr
- Insurance
- −$31
- HOA
- −$0
- Vacancy / Maint / Mgmt
- −$237
- Net cashflow
- $404
Break-even live
UW: 25.0% down · 7.5% · 30yr · 1.5% tax · 5.0% vac · 8.0% maint · 8.0% mgmt
Financing live
Cash to close
- Down payment
- $18,749
- Closing costs
- $2,250
- Reserves months
- —
- Total cash needed
- —
Loan-product check · same deal, 3 products live
Conventional
25% down · 7.5% · 30yr
- Down + closing
- —
- Monthly P&I
- —
- Monthly cashflow
- —
- DSCR
- —
- Eligible?
- —
Personal DTI + credit; lowest rate.
DSCR
20% down · 8.5% · 30yr
- Down + closing
- —
- Monthly P&I
- —
- Monthly cashflow
- —
- DSCR
- —
- Eligible?
- —
No personal income docs; deal must DSCR.
Hard money
10% down · 12.0% · 12mo
- Down + closing
- —
- Monthly P&I
- —
- Monthly cashflow
- —
- DSCR
- —
- Eligible?
- —
Short-term bridge; refi at stabilization.
Rent comps 40 comps
| Address | Beds | Baths | Sqft | Rent | $/sqft | DOM | Units | Dist |
|---|---|---|---|---|---|---|---|---|
| 112 S 46th St Louisville, KY | 3.0 | 1.0 | 902 | $1,200 | $1.33 | 23d | 1 | 0.19mi |
| 313 N 42nd St Louisville, KY | 3.0 | 1.0 | 900 | $1,250 | $1.39 | 3d | 1 | 0.19mi |
| 4143 W Market St Unit 2 Louisville, KY | 2.0 | 1.0 | 700 | $850 | $1.21 | 23d | 1 | 0.27mi |
| 127 Boston Ct Louisville, KY | 2.0 | 1.0 | 725 | $1,100 | $1.52 | 23d | 1 | 0.28mi |
| 4141 W Market St Unit 1 Louisville, KY | 2.0 | 1.0 | 771 | $925 | $1.20 | 3d | 1 | 0.28mi |
| 106 N 40th St Louisville, KY | 3.0 | 1.0 | 1325 | $1,220 | $0.92 | 3d | 1 | 0.33mi |
| 127 N 40th St Louisville, KY | 3.0 | 2.0 | 1500 | $1,570 | $1.05 | 3d | 1 | 0.33mi |
| 3910 Garfield Ave Louisville, KY | 2.0 | 1.0 | 872 | $1,035 | $1.19 | 3d | 1 | 0.35mi |
| 3901 Jewell Ave Louisville, KY | 3.0 | 1.0 | 1069 | $1,140 | $1.07 | 20d | 1 | 0.38mi |
| 247 Cecil Ave Louisville, KY | 3.0 | 2.0 | 1083 | $1,305 | $1.20 | 19d | 1 | 0.42mi |
| 302 Cecil Ave Louisville, KY | 2.0 | 1.0 | 984 | $1,025 | $1.04 | 16d | 1 | 0.44mi |
| 110 Hansbrough Pl Unit 101 Louisville, KY | 2.0 | 1.0 | 924 | $1,080 | $1.17 | 23d | 1 | 0.50mi |
| 219 N 37th St Louisville, KY | 2.0 | 1.0 | 700 | $1,150 | $1.64 | 23d | 1 | 0.55mi |
| 320 N 36th St Louisville, KY | 3.0 | 1.0 | 830 | $1,225 | $1.48 | 16d | 1 | 0.58mi |
| 4020 Larkwood Ave Louisville, KY | 1.0 | 1.0 | 1446 | $785 | $0.54 | 23d | 1 | 0.59mi |
| 4018 Vermont Ave Unit 1 Louisville, KY | 2.0 | 1.0 | 700 | $699 | $1.00 | 3d | 1 | 0.73mi |
| 3819 River Park Dr Louisville, KY | 3.0 | 1.0 | 1108 | $1,090 | $0.98 | 20d | 1 | 0.84mi |
| 4309 Elliott Ave Unit 1 Louisville, KY | 2.0 | 1.0 | 750 | $695 | $0.93 | 23d | 1 | 0.93mi |
| 4309 Elliott Ave Unit 1 Louisville, KY | 2.0 | 1.0 | 750 | $650 | $0.87 | 3d | 1 | 0.93mi |
| 628 S 39th St Louisville, KY | 3.0 | 1.0 | 1448 | $1,220 | $0.84 | 16d | 1 | 0.93mi |
| 644 S 40th St Louisville, KY | 2.0 | 1.0 | 1200 | $1,500 | $1.25 | 2d | 1 | 0.97mi |
| 3421 River Park Dr Louisville, KY | 3.0 | 1.0 | 994 | $1,250 | $1.26 | 23d | 1 | 1.05mi |
| 648 S 37th St #3 Louisville, KY | 2.0 | 1.0 | 807 | $850 | $1.05 | 23d | 1 | 1.08mi |
| 652 S 37th St #9 Louisville, KY | 3.0 | 1.0 | 1070 | $1,095 | $1.02 | 23d | 1 | 1.10mi |
| 2927 Rowan St Louisville, KY | 3.0 | 1.0 | 1008 | $1,205 | $1.20 | 11d | 1 | 1.11mi |
| 2925 Slevin St Louisville, KY | 2.0 | 1.0 | 896 | $775 | $0.86 | 3d | 1 | 1.15mi |
| 3120 Bank St Unit B Louisville, KY | 2.0 | 1.0 | 750 | $795 | $1.06 | 23d | 1 | 1.15mi |
| 714 S 40th St #2 Louisville, KY | 3.0 | 1.0 | 1000 | $1,250 | $1.25 | 23d | 1 | 1.21mi |
| 714 S 42nd St Louisville, KY | 3.0 | 1.0 | 1078 | $1,150 | $1.07 | 16d | 1 | 1.22mi |
| 509 N 31st St Louisville, KY | 2.0 | 1.0 | 800 | $795 | $0.99 | 23d | 1 | 1.22mi |
| 509 N 31st St Louisville, KY | 2.0 | 1.0 | 800 | $725 | $0.91 | 16d | 1 | 1.22mi |
| 729 S 39th St Unit 1 Louisville, KY | 2.0 | 1.0 | 800 | $800 | $1.00 | 23d | 1 | 1.26mi |
| 666 Eastlawn Ave Louisville, KY | 2.0 | 1.0 | 936 | $895 | $0.96 | 16d | 1 | 1.35mi |
| 807 E Main St New Albany, IN | 3.0 | 2.0 | 1500 | $1,650 | $1.10 | 19d | 1 | 1.36mi |
| 833 S 41st St Louisville, KY | 3.0 | 2.0 | 786 | $1,250 | $1.59 | 23d | 1 | 1.38mi |
| 836 S 41st St Louisville, KY | 3.0 | 1.0 | 1300 | $1,300 | $1.00 | 19d | 1 | 1.38mi |
| 309 E Spring St Unit 310-106 New Albany, IN | 2.0 | 2.0 | 1005 | $1,250 | $1.24 | 17d | 1 | 1.39mi |
| 309 E Spring St Unit 310-203 New Albany, IN | 2.0 | 2.5 | 1005 | $1,250 | $1.24 | 3d | 1 | 1.39mi |
| 522 N 29th St Louisville, KY | 3.0 | 1.0 | 1031 | $1,300 | $1.26 | 3d | 1 | 1.40mi |
| 823 S 38th St Louisville, KY | 3.0 | 1.0 | 1100 | $1,195 | $1.09 | 3d | 1 | 1.40mi |
Listing history 27 events
-
2026-06-18days on market $74,995 Active 38 DOM
-
2026-06-17days on market $74,995 Active 37 DOM
-
2026-06-16days on market $74,995 Active 36 DOM
-
2026-06-15days on market $74,995 Active 35 DOM
-
2026-06-13days on market $74,995 Active 33 DOM
-
2026-06-10days on market $74,995 Active 30 DOM
-
2026-06-09days on market $74,995 Active 29 DOM
-
2026-06-08days on market $74,995 Active 28 DOM
-
2026-06-07days on market $74,995 Active 27 DOM
-
2026-06-03days on market $74,995 Active 23 DOM
-
2026-06-02days on market $74,995 Active 22 DOM
-
2026-06-01days on market $74,995 Active 21 DOM
-
2026-05-31days on market $74,995 Active 20 DOM
-
2026-05-11price $74,995
-
2026-05-11$69,995 Active
-
2022-04-01soldstatus $451,000
-
2018-08-01soldstatus $106,250
-
2015-10-21historical 336-char remark
Show marketing remark (336 chars)
This 2Bed/1Bath is rented for $525 per month. The tenants are on a month to month lease. New Furnace and Water Heater 2011. Interior photos were taken before tenants moved in. Listing agent has an ownership stake in the property. Allow 48 hours for showings. See Documents tab for other houses for sale in this investor portfolio.
-
2015-10-16soldstatus $23,000 Closed 336-char remark
Show marketing remark (336 chars)
This 2Bed/1Bath is rented for $525 per month. The tenants are on a month to month lease. New Furnace and Water Heater 2011. Interior photos were taken before tenants moved in. Listing agent has an ownership stake in the property. Allow 48 hours for showings. See Documents tab for other houses for sale in this investor portfolio.
-
2015-09-30status Pending 336-char remark
Show marketing remark (336 chars)
This 2Bed/1Bath is rented for $525 per month. The tenants are on a month to month lease. New Furnace and Water Heater 2011. Interior photos were taken before tenants moved in. Listing agent has an ownership stake in the property. Allow 48 hours for showings. See Documents tab for other houses for sale in this investor portfolio.
-
2015-09-25$25,000 Active 336-char remark
Show marketing remark (336 chars)
This 2Bed/1Bath is rented for $525 per month. The tenants are on a month to month lease. New Furnace and Water Heater 2011. Interior photos were taken before tenants moved in. Listing agent has an ownership stake in the property. Allow 48 hours for showings. See Documents tab for other houses for sale in this investor portfolio.
-
2011-10-14soldstatus $8,500 53-char remark
Show marketing remark (53 chars)
Property sold as-is. Subject to third-party approval.
-
2011-07-19$10,950 53-char remark
Show marketing remark (53 chars)
Property sold as-is. Subject to third-party approval.
-
2011-07-18historical
-
2011-04-10$19,900
-
2010-05-19historical
-
2009-12-19$21,300
ⓘ Source: listings_history table (triggers on properties + properties_extension) + one-shot
backfill from property_details.listing_events for pre-trigger history.
Tax reassessment forecast KY · Resets to sale price
- Current annual tax
- $756 · $63/mo
- Projected year-2 tax
- $756 · $63/mo
- Expected delta
- $0/yr ($0/mo · 0.0%)
ⓘ Screening estimate from a state-policy table — verify with the county assessor before closing.
Climate risk First Street
- Flood 1/10 Low FEMA zone X (unshaded) · 0% chance over 30 yrs
- Wildfire 1/10 Low
- Heat 5/10 Major 7 d/yr ≥104°F today · 20 d/yr by 30 yrs out
- Wind 2/10 Low 100% chance of damaging wind over 30 yrs
- Air quality 2/10 Low 1 unhealthy d/yr today · 2 by 30 yrs out
Nearby sold comps map
Loading sold comps map…
Walkable amenities ~0.75 mi
Loading nearby amenities…
Taxation est. · year 1
- Rental income
- $13,539
- − Mortgage interest
- −$4,201
- − Property taxes
- −$756
- − Insurance
- −$375
- − Repairs & maintenance
- −$1,083
- − Management
- −$1,083
- − Depreciation
- −$2,182
- Taxable income
- $3,859
- Est. tax owed @ 24.0%
- −$926
- After-tax cash flow
- $3,919/yr
For passive investors: Depreciation is non-cash, so a rental often shows a tax loss while cash-flowing — sheltering income. Rental losses are passive: they offset passive income freely, and up to $25,000/yr can offset ordinary (W-2) income if you actively participate and your MAGI is under $100k (phasing out to $0 by $150k); unused losses carry forward. On sale, claimed depreciation is recaptured at up to 25%, and gains may owe capital-gains tax (a 1031 exchange can defer both). Figures are a year-1 estimate at your 24.0% rate — not tax advice; consult a CPA.
Schools (NCES district)
- District
- Jefferson County
- NCES district ID
- 2102990
- Math proficiency
- 19% ▼ -17.00%
- Reading proficiency
- 35% ▼ -11.00%
- Median HH income
- $47,885
- Composite
- 23.45/100
- National rank
- #7884
- State rank
- #121 of 165 in KY
Livability — Louisville
- Score
- 63/100
- State rank
- #333
- US rank
- #15887
Category grades
Schools grade is shown separately in the Schools card above.
Census & demographics
- Census place
- Louisville, KY
- County
- Jefferson County · 790,184 people
- City population
- 769,292
- Metro
- Louisville/Jefferson County, KY-IN
- Population (ZIP)
- 14,661
- Household income
- $35,753
- Rent vs Own
- Severe rent burden
- 1148.0
Population outlook (Jefferson County) Hauer SSP2
- Today (2025)
- 823,112 people
- By 2030
- 849,343 · +3.2%
- By 2040
- 895,696 · +8.8%
- By 2050
- 933,630 · +13.4%
- By 2075
- 1,028,262 · +24.9%
- By 2100
- 1,072,675 · +30.3%
Race, ethnicity, and origin ACS 2023
- Neighborhood character
- Majority Black (60%)
- Race & ethnicity
- Black 60% White 37% Two or more races 2% Hispanic / Latino 1%
- Common ancestry
- Slovak 1% Lithuanian 1% Iranian 1%
- Foreign-born
- 1% · Canada
- Languages at home
- 98% English-only · Spanish 1%
Political lean MEDSL · Jefferson
- 2024 margin
- D (+16.6) · D 57.4% · R 40.9% · Other 1.7%
- 2008→2024 swing
- +4.5pp toward D · 2008: 12.0pp · 2024: 16.6pp
- All cycles
- 2024: D+16.6 2020: D+20.1 2016: D+13.3 2012: D+11.1 2008: D+12.0
Not yet ingested
- Civics
- —
Market trends
- HPI YoY
- ▲ 29.02%
- Current HPI
- 293.2624
- Rent YoY
- ▲ 0.51%
- Metro
- Louisville/Jefferson County, KY-IN
- State GDP YoY
- ▲ 1.81%
- F500 in state
- 4
Industry mix (Fortune 500 HQ in KY)
| Industry | F500 HQs | Revenue |
|---|---|---|
| Healthcare | 1 | $118B |
|
||
| Food / Beverage | 1 | $7B |
|
||
Price history
+252.1% since first listed14 events — show timeline
- 2026-05-11 Price Changed $74,995 Metro Search MLS
- 2026-05-11 Listed $69,995 Metro Search MLS
- 2022-04-01 Sold (Public Records) $451,000 Public Records
- 2018-08-01 Sold (Public Records) $106,250 Public Records
- 2015-10-21 Listing Removed — Metro Search MLS
- 2015-10-16 Sold (MLS) $23,000 Metro Search MLS
- 2015-09-30 Pending — Metro Search MLS
- 2015-09-25 Listed $25,000 Metro Search MLS
- 2011-10-14 Sold (MLS) $8,500 Metro Search MLS
- 2011-07-19 Listed $10,950 Metro Search MLS
- 2011-07-18 Listing Removed — Metro Search MLS
- 2011-04-10 Listed $19,900 Metro Search MLS
- 2010-05-19 Listing Removed — Metro Search MLS
- 2009-12-19 Listed $21,300 Metro Search MLS
Property tax history
+11.4%/yrLatest (2025): $756 · -1.9% YoY. Source: county tax records.
Cash-flow waterfall
monthlySold comps — $/sqft
last 12 mo · ≤1 miLoading sold comps…