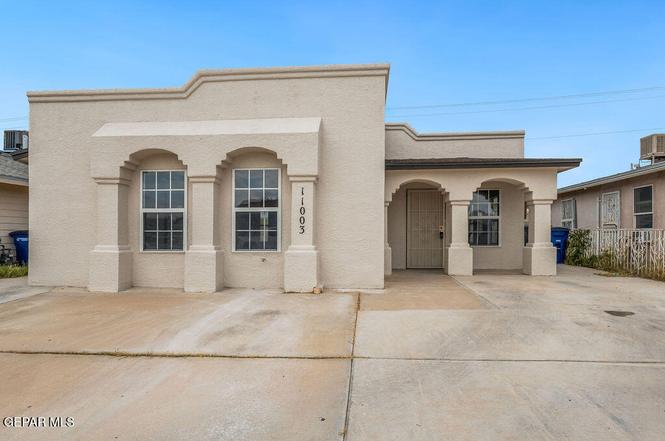
11003 Stonebridge Dr · El Paso, TX
Flood risk 6/10 · Moderate
- FEMA flood zone
- X
- Chance of flooding over 30 yrs
- 0.72%
- Est. flood insurance / yr
- $507 – $1,088
Fire risk 3/10 · Minor
- Est. fire insurance / yr
- $1,222 – $2,270
Heat risk 6/10 · Moderate
- Hot days now (above 100°F)
- 6 days/yr
- Hot days in 30 yrs
- 22 days/yr
Wind risk 1/10 · Minimal
- Chance of severe wind over 30 yrs
- —
Air-quality risk 3/10 · Minor
- Unhealthy air days now
- 2 days/yr
- Unhealthy air days in 30 yrs
- 2 days/yr
Risk factors via First Street. Map © Google.
Why this score? — see what drove the D- grade
The composite is a weighted blend of 9 inputs, each scored 0–100. Each bar is that input's sub-score; the figure is the points it added to the 100-point composite (weight × sub-score).
- Cash flow +12.4/30.0
- ARV discount +7.5/15.0
- Livability +4.0/5.0
- 1% rule +3.8/10.0
- DSCR +3.7/10.0
- Rent growth +2.8/5.0
- Schools +2.6/10.0
- Condition / age +2.5/5.0
- Appreciation +0.0/10.0
$192,000
🖨 Deal sheet (PDF) 📄 Offer letter ✓ Due diligence
Listing remarks
Freshly remodeled and move-in ready, this beautifully updated home offers modern finishes, a fresh feel and an ideal layout. Featuring an open living concept, multiple living areas, three generously sized bedrooms and two spacious full bathrooms. This home provides an ideal balance of space for a busy lifestyle and entertaining with friends. The spacious eat-in kitchen has been fully remodeled with all new appliances, cabinets, and countertops, creating a stylish and functional space for everyday living. New tile flooring throughout the home provides a fresh, cohesive look, while large windows fill the interior with natural light. Fresh paint inside and out enhances the bright, welcoming at
Key facts
- Open living concept
- New cabinets
- New appliances
Tags
Property features AI
Finance
- HOA & community: No HOA fees
Exterior
- Home design: Single family residence; Flat roof
- Construction: Stucco construction; Building area about 1,046 total square feet; Built on a 0.1 acre lot
- Exterior features: Back yard access; Fenced yard
Interior
- Kitchen: Dishwasher; Disposal; Free‑standing gas oven
- Flooring: Tile flooring
- Bathrooms: 2 full bathrooms
- Heating & cooling: Natural gas heating with central forced air; Central refrigerated air conditioning; Ceiling fans
- Interior features: Ceiling fans; No window treatments
Neighborhood map
What this means for you Summary
Snapshot
- This is a 3-bed/2.0-bath single-family listed at $192k.
Deal economics
- At list price, monthly cash flow is $-31 ($-368/yr) — negative.
- To cash-flow at today's rent, offer at most $187k (2.8% below list).
- To meet the 1% rule (rent ≥ 1% of price), the offer needs to be $170k (11.6% below list).
- Recommended offer: $170k (11.6% below list) — sets the bar for 1% rule.
Location & tenants
- Location reads 81/100 on livability (#23 in TX, #1,375 nationally) — a professional / high-income tenant draw. Strengths: commute A+, cost of living A+, housing A+; Watch: employment D+.
- Ysleta ISD (urban): math 27% / reading 35% proficiency, ranked #626 of 826 in TX (top 76%) — families likely to look elsewhere, expect single-tenant / working-renter base with shorter leases; 68% free/reduced lunch — lower-income household profile, screen leases tightly.
- Zoned schools: North Star El (math 37% / reading 52%, grade F, #1,155 of 4,322 statewide, top 29%, 518 students, 74% FRL); Parkland Pre-Engineering Middle (math 17% / reading 29%, grade F, #1,327 of 1,662 statewide, top 81%, 1,166 students, 83% FRL); Parkland H S (math 29% / reading 42%, grade F, #941 of 1,632 statewide, top 58%, 1,674 students, 71% FRL).
- Market conditions: Rents rising (+1.4%/yr); 296 active listings in the ZIP; 26 comparable units currently listed for rent nearby; rentals at typical pace (median 26d on market — plan ~3-4 weeks tenant-placement turnaround); solid renter incomes; 2,196 units permitted in El Paso County in 2024 (143 in 5+ unit buildings).
Forward outlook
- Local home prices are declining (-3.0%/yr); year-one equity from $1k of loan paydown is wiped out by about $6k of value loss. Plan a longer hold.
- El Paso County population projected at +10% by 2050 — modest demand growth; plan on rents tracking national, not racing it.
Negotiation context
- Only 5 days on market — expect competitive offers; lowballing is unlikely to land.
- 2 sale attempts with the ask held roughly flat each time — persistent listings suggest the price (not the market) is what's stuck; bring a comps-based counter.
Risks & watch-outs
- Climate carrying-cost: major flood risk; extreme-heat days projected 6→22/yr by 2055 (HVAC capex compounding) — expect insurance premiums to compound above CPI over the hold.
Questions for the listing agent
- What do current leases actually rent for vs. the listed asking? Can we see a recent rent roll and the last 12 months of T-12 income?
- Is there a deadline driving the sale (1031 exchange, divorce, estate, relocation)? That informs how much negotiation room exists.
- Schools are B-rated — typically a magnet for longer-tenancy family renters. What's the average tenant stay here, and is there a school-zone premium baked into asking?
- The area grade is low — what's the realistic commute time and amenity access for the typical tenant pool here? Any planned neighborhood developments (good or bad) we should know about?
- What's the average days-on-market for RENTAL listings here right now (not sales)? A rising rental-DOM trend means longer vacancies and softer asking-rent achievability than the comps imply.
- What's the recent tenant-quality profile in this submarket — average credit score on applications, eviction rate, late-payment / NSF rate, and stable-employment percentage? A property-management company in the area should have these aggregated.
- How much new for-sale + rental construction is in the pipeline within 1–3 miles? Heavy new supply typically softens prices + rents 12–24 months out; constrained supply supports both.
Investment metrics
- 1% rule
- 0.88% ✗
- Cap rate
- 6.10%
- Cash-on-cash
- -0.68%
- DSCR
- 0.97
- GRM
- 9.4
CMA / ARV
No comps found within radius.
Projected returns pro-forma
-3.0% appreciation · 1.36% rent growth · sell at horizon
- IRR
- -19.3%
- Equity multiple
- 0.33×
- Total profit
- $-35,767
- Equity at exit
- $28,628
- IRR
- -15.9%
- Equity multiple
- 0.17×
- Total profit
- $-44,383
- Equity at exit
- $16,601
Cash invested: $53,760 (down + closing). Projections, not guarantees.
Landlord ↔ Tenant lean methodology
- Overall (STATE)
- 87 Strongly Landlord-Friendly
- State Texas
- 87 Strongly Landlord-Friendly · R+5
- County
- — inherits STATE
- City
- — inherits STATE
ZIP-level market 79934
- Home prices YoY
- -13.1%
- Rents YoY
- 1.4%
- Active inventory
- 296
- Price-to-rent
- 9.4×
Monthly cashflow live
- Estimated rent
- $1,697 high interval (Pro) →
- Mortgage (P&I)
- −$1,007
- Tax from tax record
- −$284 /mo · $3,411/yr
- Insurance
- −$80
- HOA
- −$0
- Vacancy / Maint / Mgmt
- −$356
- Net cashflow
- $-31
Break-even live
Sensitivity live
| Price | -10% $78 | -5% $24 | +0% $-31 | +5% $-85 | +10% $-139 |
|---|---|---|---|---|---|
| Rent | -10% $-165 | -5% $-98 | +0% $-31 | +5% $36 | +10% $103 |
| Rate | -1.0pp $66 | -0.5pp $18 | base $-31 | +0.5pp $-80 | +1.0pp $-131 |
UW: 25.0% down · 7.5% · 30yr · 1.5% tax · 5.0% vac · 8.0% maint · 8.0% mgmt
Financing live
Cash to close
- Down payment
- $48,000
- Closing costs
- $5,760
- Reserves months
- —
- Total cash needed
- —
Loan-product check · same deal, 3 products live
Conventional
25% down · 7.5% · 30yr
- Down + closing
- —
- Monthly P&I
- —
- Monthly cashflow
- —
- DSCR
- —
- Eligible?
- —
Personal DTI + credit; lowest rate.
DSCR
20% down · 8.5% · 30yr
- Down + closing
- —
- Monthly P&I
- —
- Monthly cashflow
- —
- DSCR
- —
- Eligible?
- —
No personal income docs; deal must DSCR.
Hard money
10% down · 12.0% · 12mo
- Down + closing
- —
- Monthly P&I
- —
- Monthly cashflow
- —
- DSCR
- —
- Eligible?
- —
Short-term bridge; refi at stabilization.
Rent comps 26 comps
| Address | Beds | Baths | Sqft | Rent | $/sqft | DOM | Units | Dist |
|---|---|---|---|---|---|---|---|---|
| 10837 Gemstone St El Paso, TX | 3.0 | 2.0 | 1142 | $1,560 | $1.37 | 4d | 1 | 0.44mi |
| 11013 Thatcher Pond Ln El Paso, TX | 3.0 | 2.5 | 1432 | $1,550 | $1.08 | 45d | 1 | 0.52mi |
| 10624 Hidden Chapel Pl El Paso, TX | 3.0 | 2.0 | 1307 | $1,700 | $1.30 | 45d | 1 | 0.73mi |
| 10800 McCombs St El Paso, TX | 1.0–3.0 | 1.0–2.5 | 1067 | $1,970 | $1.85 | 4d | 12 | 0.75mi |
| 11051 Rockdale St El Paso, TX | 3.0 | 2.0 | 1337 | $1,895 | $1.42 | 25d | 1 | 0.77mi |
| 11240 William McCool St El Paso, TX | 3.0 | 2.0 | 925 | $1,350 | $1.46 | 45d | 1 | 0.88mi |
| 10736 Obsidian St El Paso, TX | 3.0 | 1.0 | 961 | $1,195 | $1.24 | 4d | 1 | 0.89mi |
| 5784 Rick Husband Dr El Paso, TX | 3.0 | 2.0 | 1242 | $1,550 | $1.25 | 25d | 1 | 0.92mi |
| 11205 Whitey Ford St El Paso, TX | 3.0 | 2.0 | 1286 | $1,450 | $1.13 | 16d | 1 | 1.00mi |
| 10626 McCombs St Unit 01 El Paso, TX | 2.0 | 1.0 | 725 | $1,100 | $1.52 | 16d | 1 | 1.03mi |
| 5652 Rick Husband Dr El Paso, TX | 3.0 | 2.0 | 1160 | $1,500 | $1.29 | 25d | 1 | 1.06mi |
| 5640 Rick Husband Dr El Paso, TX | 3.0 | 2.0 | 1500 | $1,595 | $1.06 | 45d | 1 | 1.08mi |
| 5845 Wrangler Dr El Paso, TX | 3.0 | 1.5 | 1196 | $1,550 | $1.30 | 25d | 1 | 1.08mi |
| 10901 Joe Dimaggio Cir El Paso, TX | 4.0 | 2.0 | 1400 | $1,750 | $1.25 | 23d | 1 | 1.08mi |
| 6902 S Angora Loop Ave El Paso, TX | 3.0 | 2.0 | 1260 | $1,500 | $1.19 | 12d | 1 | 1.10mi |
| 10902 Yogi Berra Dr El Paso, TX | 3.0 | 2.0 | 1167 | $1,300 | $1.11 | 25d | 1 | 1.19mi |
| 10708 Levelland Pl El Paso, TX | 3.0 | 2.0 | 1064 | $1,400 | $1.32 | 16d | 1 | 1.19mi |
| 10708 Levelland Pl El Paso, TX | 3.0 | 2.0 | 1064 | $1,400 | $1.32 | 45d | 1 | 1.20mi |
| 10969 Duke Snider Cir El Paso, TX | 3.0 | 2.0 | 1003 | $1,385 | $1.38 | 13d | 1 | 1.26mi |
| 10948 Casey Stengel Pl El Paso, TX | 3.0 | 2.0 | 1304 | $1,625 | $1.25 | 45d | 1 | 1.27mi |
| 10720 McAllen Pl El Paso, TX | 3.0 | 2.0 | 1134 | $1,500 | $1.32 | 25d | 1 | 1.32mi |
| 5916 Cielo Del Rey Pl Unit A El Paso, TX | 3.0 | 2.5 | 1165 | $1,250 | $1.07 | 25d | 1 | 1.47mi |
| 5904 Cielo Del Rey Pl Unit A El Paso, TX | 3.0 | 2.5 | 1165 | $1,395 | $1.20 | 4d | 1 | 1.47mi |
| 5912 Cielo Del Rey Pl Unit B El Paso, TX | 3.0 | 2.5 | 1200 | $1,500 | $1.25 | 45d | 1 | 1.48mi |
| 51046 Agave Ct El Paso, TX | 3.0–4.0 | 2.0–3.0 | 1760 | $2,299 | $1.31 | 45d | 7 | 1.49mi |
| 51046 Agave Ct El Paso, TX | 3.0–4.0 | 2.0–3.0 | 1760 | $2,199 | $1.25 | 4d | 12 | 1.49mi |
Listing history 4 events
-
2026-06-22days on market $192,000 Active 5 DOM
-
2026-06-18days on market $192,000 Active 2 DOM
-
2026-06-16remarks 699-char remark
-
2026-06-16$192,000 Active 1 DOM
ⓘ Source: listings_history table (triggers on properties + properties_extension) + one-shot
backfill from property_details.listing_events for pre-trigger history.
Tax reassessment forecast TX · Resets to sale price
- Current annual tax
- $3,411 · $284/mo
- Projected year-2 tax
- $3,514 · $293/mo
- Expected delta
- +$103/yr (+$9/mo · 3.0%)
ⓘ Screening estimate from a state-policy table — verify with the county assessor before closing.
Climate risk First Street
- Flood 6/10 Major FEMA zone X · 72% chance over 30 yrs
- Wildfire 3/10 Moderate
- Heat 6/10 Major 6 d/yr ≥100°F today · 22 d/yr by 30 yrs out
- Wind 1/10 Low
- Air quality 3/10 Moderate 2 unhealthy d/yr today · 2 by 30 yrs out
Nearby sold comps map
Loading sold comps map…
Walkable amenities ~0.75 mi
Loading nearby amenities…
Taxation est. · year 1
- Rental income
- $20,361
- − Mortgage interest
- −$10,755
- − Property taxes
- −$3,411
- − Insurance
- −$960
- − Repairs & maintenance
- −$1,629
- − Management
- −$1,629
- − Depreciation
- −$5,585
- Taxable loss
- −$3,608
- Est. tax savings @ 24.0%
- +$866
- After-tax cash flow
- $498/yr
For passive investors: Depreciation is non-cash, so a rental often shows a tax loss while cash-flowing — sheltering income. Rental losses are passive: they offset passive income freely, and up to $25,000/yr can offset ordinary (W-2) income if you actively participate and your MAGI is under $100k (phasing out to $0 by $150k); unused losses carry forward. On sale, claimed depreciation is recaptured at up to 25%, and gains may owe capital-gains tax (a 1031 exchange can defer both). Figures are a year-1 estimate at your 24.0% rate — not tax advice; consult a CPA.
Schools (NCES district)
- District
- Ysleta ISD
- NCES district ID
- 4846680
- Math proficiency
- 27% ▼ -31.00%
- Reading proficiency
- 35% ▼ -11.00%
- Median HH income
- $35,826
- Composite
- 25.65/100
- National rank
- #7400
- State rank
- #626 of 826 in TX
Livability — El Paso
- Score
- 81/100
- State rank
- #23
- US rank
- #1375
Category grades
Schools grade is shown separately in the Schools card above.
Census & demographics
- Census place
- El Paso, TX
- County
- El Paso County · 761,266 people
- City population
- 630,223
- Metro
- El Paso, TX
- Population (ZIP)
- 28,861
- Household income
- $77,754
- Rent vs Own
- Severe rent burden
- 795.0
Population outlook (El Paso County) Hauer SSP2
- Today (2025)
- 897,899 people
- By 2030
- 922,694 · +2.8%
- By 2040
- 960,492 · +7.0%
- By 2050
- 982,919 · +9.5%
- By 2075
- 997,266 · +11.1%
- By 2100
- 900,630 · +0.3%
Race, ethnicity, and origin ACS 2023
- Neighborhood character
- Diverse neighborhood (Simpson 0.56)
- Race & ethnicity
- Hispanic / Latino 63% Two or more races 34% White 19% Black 9% Asian 3%
- Hispanic origin (detail)
- Mexican 57% Puerto Rican 3%
- Common ancestry
- Lithuanian 1% Italian 1% Romanian 1%
- Foreign-born
- 15% · Canada, South Korea, Vietnam
- Languages at home
- 54% English-only · Spanish 42% Korean 1% French/Haitian/Cajun 1%
Political lean MEDSL · El Paso
- 2024 margin
- D (+15.1) · D 57.0% · R 41.8% · Other 1.2%
- 2008→2024 swing
- -17.4pp toward R · 2008: 32.5pp · 2024: 15.1pp
- All cycles
- 2024: D+15.1 2020: D+35.1 2016: D+43.2 2012: D+32.6 2008: D+32.5
Not yet ingested
- Civics
- —
Market trends
- HPI YoY
- ▼ -34.63%
- Current HPI
- 229.688
- Rent YoY
- ▲ 1.36%
- Metro
- El Paso, TX
- State GDP YoY
- ▲ 3.95%
- F500 in state
- 110
Industry mix (Fortune 500 HQ in TX)
| Industry | F500 HQs | Revenue |
|---|---|---|
| Energy | 16 | $1,198B |
|
||
| Technology | 5 | $198B |
|
||
| Engineering / Construction | 4 | $72B |
|
||
| Energy Services | 3 | $60B |
|
||
| Utilities | 3 | $41B |
|
||
| Healthcare | 2 | $330B |
|
||
Price history
+32.4% since first listed5 events — show timeline
- 2026-06-15 Listed $192,000 GEPARMLS
- 2026-04-09 Sold (Public Records) — Public Records
- 2026-03-15 Pending — GEPARMLS
- 2026-03-11 Listed $145,000 GEPARMLS
- 1997-04-22 Sold (Public Records) — Public Records
Property tax history
+5.2%/yrLatest (2025): $3,411 · +10.7% YoY. Source: county tax records.
Cash-flow waterfall
monthlySold comps — $/sqft
last 12 mo · ≤1 miLoading sold comps…