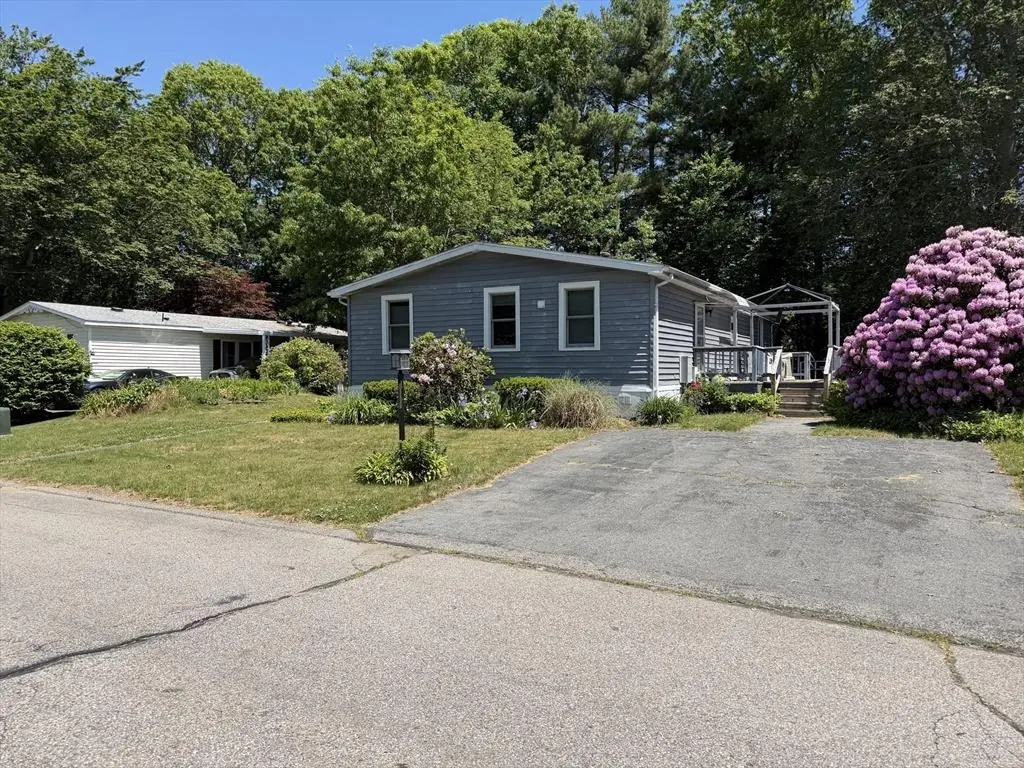
16 Liberty St · West Bridgewater, MA
Flood risk 1/10 · Minimal
- FEMA flood zone
- X (unshaded)
- Chance of flooding over 30 yrs
- 0.0%
- Est. flood insurance / yr
- $507 – $1,088
Fire risk 1/10 · Minimal
- Est. fire insurance / yr
- $915 – $1,699
Heat risk 5/10 · Moderate
- Hot days now (above 98°F)
- 7 days/yr
- Hot days in 30 yrs
- 15 days/yr
Wind risk 6/10 · Moderate
- Chance of severe wind over 30 yrs
- 69.0%
Air-quality risk 2/10 · Minimal
- Unhealthy air days now
- 1 days/yr
- Unhealthy air days in 30 yrs
- 2 days/yr
Risk factors via First Street. Map © Google.
Why this score? — see what drove the B grade
The composite is a weighted blend of 9 inputs, each scored 0–100. Each bar is that input's sub-score; the figure is the points it added to the 100-point composite (weight × sub-score).
- Cash flow +26.3/30.0
- ARV discount +15.0/15.0
- 1% rule +9.8/10.0
- DSCR +8.9/10.0
- Schools +3.8/10.0
- Rent growth +2.5/5.0
- Livability +2.5/5.0
- Condition / age +2.5/5.0
- Appreciation +0.0/10.0
$219,000
🖨 Deal sheet 📄 Offer letter ✓ Due diligence
Listing remarks MLS
Beautiful Crystal Valley Manufactured Home In Desirable Matfield Woods. This Spacious Home Offers New Carpet Thru-Out! Huge Country Kit W/Skylight, Tons Of Cabinets & Built-In China Cab. Large 13'x21' Beamed Cathedral Liv Rm W/Bay Window. 13'x14' Beamed Mstr Bdrm W/Double Closets & Full Bath W/Tub. 2nd Full Bath W/Tub & Skylight. Walk In Closets In 2nd & 3rd Bdrms. Exterior Boasts Over-sized 9'x19' Deck Overlooking Wooded Lot. Paved Double Driveway, Storage Shed And Vinyl Siding. A Must See!
Key facts
- Bright kitchen
- Newer windows
- Skylight
Tags
Property features AI
Finance
- Other: Lot size approximately 0.11 acre
- HOA & community: Homeowners association membership required; Association fee applies; Community offers public transportation access and nearby shopping
Exterior
- Parking: Open parking (2 spaces)
- Utilities: Public water; Public sewer
- Home design: Mobile home; Single-story (first-floor living)
- Construction: Block foundation; Built (year reported by owner)
- Exterior features: Paved driveway; Open parking for 2 vehicles
Interior
- Kitchen: Range; Oven; Refrigerator
- Bedrooms: Master bedroom on the first floor; Second bedroom on the first floor; Third bedroom on the first floor
- Bathrooms: 2 full bathrooms, both on the first floor
- Heating & cooling: Forced air heating; Central air conditioning; Has heating and cooling
- Interior features: Total of 5 rooms
- Laundry & utility: Laundry on the first floor
Neighborhood map
What this means for you Summary
Snapshot
- This is a 3-bed/2.0-bath manufactured listed at $219k.
Deal economics
- At list price, monthly cash flow is $565 ($7k/yr) — positive.
- The deal already cash-flows at list — no discount required.
- Meets the 1% rule at list price ($3k rent vs $219k).
- Recommended offer: $216k (1.5% below list) — sets the bar for market timing.
Location & tenants
- Location reads: area grade B — affects rentability + tenant quality, not the cash-flow math above.
- West Bridgewater (suburban): math 28% / reading 53% proficiency, ranked #186 of 302 in MA (top 62%) — families likely to look elsewhere, expect single-tenant / working-renter base with shorter leases; only 14% free/reduced lunch — higher-income household profile.
- Market conditions: 25 active listings in the ZIP; 3 comparable units currently listed for rent nearby; rentals lingering (median 44d on market — plan ~5-8 weeks vacancy on turnover, expect pricing pressure); 67% of comp listings sitting > 30 days — soft ceiling on asking rent; 1,255 units permitted in Plymouth County in 2024 (411 in 5+ unit buildings).
Forward outlook
- Local home prices are declining (-3.0%/yr); year-one equity from $2k of loan paydown is wiped out by about $7k of value loss. Plan a longer hold.
- At projected returns (-3.0% appreciation + 3.0% rent growth), your $61k cash investment doubles in ~10 years — after that, you're playing with house money.
Negotiation context
- It's been on market 15 days — a 2% lower offer ($216k) is reasonable based on typical stale-listing flexibility.
- 3 sale attempts since 17y ago with the ask held roughly flat each time — persistent listings suggest the price (not the market) is what's stuck; bring a comps-based counter.
- Current owner paid $115k; list at $219k implies a 90% gain — meaningful room to come down on a strong offer.
Risks & watch-outs
- Climate carrying-cost: major wind risk, 69% chance of damaging wind over 30y; extreme-heat days projected 7→15/yr by 2055 (HVAC capex compounding) — expect insurance premiums to compound above CPI over the hold.
Questions for the listing agent
- What does the HOA fee cover, when was the last increase, and are there any pending special assessments or reserve-fund shortfalls?
- Is there a deadline driving the sale (1031 exchange, divorce, estate, relocation)? That informs how much negotiation room exists.
- What's the average days-on-market for RENTAL listings here right now (not sales)? A rising rental-DOM trend means longer vacancies and softer asking-rent achievability than the comps imply.
- What's the recent tenant-quality profile in this submarket — average credit score on applications, eviction rate, late-payment / NSF rate, and stable-employment percentage? A property-management company in the area should have these aggregated.
- How much new for-sale + rental construction is in the pipeline within 1–3 miles? Heavy new supply typically softens prices + rents 12–24 months out; constrained supply supports both.
Investment metrics
- 1% rule
- 1.48% ✓
- Cap rate
- 9.39%
- Cash-on-cash
- 11.06%
- DSCR
- 1.49
- GRM
- 5.6
CMA / ARV
- ARV (on-the-fly)
- $285,246
- Comps found
- 3
Show comp detail 3 sales within ~0.75 mi
| Address | Dist | Beds/Ba | Sqft | Sold | Price | $/sf | Match |
|---|---|---|---|---|---|---|---|
| 21 Friendship Dr | 0.05mi | 2/1.0 (-1) | 1,196 (-2%) | 8mo | $280,000 | $234 | 79 |
| 18 American Ave | 0.06mi | 2/1.5 (-1) | 1,377 (+13%) | 1mo | $290,000 | $211 | 68 |
| 8 Christian Way | 0.31mi | 2/2.0 (-1) | 1,369 (+12%) | 15mo | $345,000 | $252 | 48 |
Match score weights: distance 35% · size 25% · config 20% · recency 20%. Top-matched comps best support the ARV.
Projected returns pro-forma
-3.0% appreciation · 3.0% rent growth · sell at horizon
- IRR
- 0.4%
- Equity multiple
- 1.01×
- Total profit
- $848
- Equity at exit
- $32,654
- IRR
- 10.1%
- Equity multiple
- 1.79×
- Total profit
- $48,497
- Equity at exit
- $18,935
Cash invested: $61,320 (down + closing). Projections, not guarantees.
Landlord ↔ Tenant lean methodology
- Overall (STATE)
- 20 Strongly Tenant-Friendly
- State Massachusetts
- 20 Strongly Tenant-Friendly · D+15
- County
- — inherits STATE
- City
- — inherits STATE
ZIP-level market 02379
- Active inventory
- 25
- Price-to-rent
- 5.6×
Monthly cashflow live
- Estimated rent
- $3,251 medium interval (Pro) →
- Mortgage (P&I)
- −$1,148
- Tax est. 1.5%
- −$274 /mo · $3,285/yr
- Insurance
- −$91
- HOA
- −$490
- Vacancy / Maint / Mgmt
- −$683
- Net cashflow
- $565
Break-even live
UW: 25.0% down · 7.5% · 30yr · 1.5% tax · 5.0% vac · 8.0% maint · 8.0% mgmt
Financing live
Cash to close
- Down payment
- $54,750
- Closing costs
- $6,570
- Reserves months
- —
- Total cash needed
- —
Loan-product check · same deal, 3 products live
Conventional
25% down · 7.5% · 30yr
- Down + closing
- —
- Monthly P&I
- —
- Monthly cashflow
- —
- DSCR
- —
- Eligible?
- —
Personal DTI + credit; lowest rate.
DSCR
20% down · 8.5% · 30yr
- Down + closing
- —
- Monthly P&I
- —
- Monthly cashflow
- —
- DSCR
- —
- Eligible?
- —
No personal income docs; deal must DSCR.
Hard money
10% down · 12.0% · 12mo
- Down + closing
- —
- Monthly P&I
- —
- Monthly cashflow
- —
- DSCR
- —
- Eligible?
- —
Short-term bridge; refi at stabilization.
Rent comps 3 comps
| Address | Beds | Baths | Sqft | Rent | $/sqft | DOM | Units | Dist |
|---|---|---|---|---|---|---|---|---|
| 149 Copeland St West Bridgewater, MA | 3.0 | 2.0 | 1339 | $4,200 | $3.14 | 1d | 1 | 0.73mi |
| 10 Longworth Ave Brockton, MA | 2.0 | 1.0 | 950 | $2,500 | $2.63 | 43d | 1 | 0.96mi |
| 368 N Elm St Unit 2 West Bridgewater, MA | 2.0 | 1.0 | 850 | $2,200 | $2.59 | 43d | 1 | 1.26mi |
HOA detail
- Monthly dues
- $490 · $5,880/yr
Listing history 12 events
-
2026-06-18days on market $219,000 Active 15 DOM
-
2026-06-17days on market $219,000 Active 14 DOM
-
2026-06-16days on market $219,000 Active 13 DOM
-
2026-06-15days on market $219,000 Active 12 DOM
-
2026-06-13days on market $219,000 Active 10 DOM
-
2026-06-13days on market $219,000 Active 9 DOM
-
2026-06-09days on market $219,000 Active 6 DOM
-
2026-06-08days on market $219,000 Active 5 DOM
-
2026-06-08status $219,000 Active 4 DOM
-
2026-06-07days on market $219,000 New 4 DOM
-
2026-06-04remarks 687-char remark
-
2026-06-04$219,000 New 1 DOM
ⓘ Source: listings_history table (triggers on properties + properties_extension) + one-shot
backfill from property_details.listing_events for pre-trigger history.
Climate risk First Street
- Flood 1/10 Low FEMA zone X (unshaded) · 0% chance over 30 yrs
- Wildfire 1/10 Low
- Heat 5/10 Major 7 d/yr ≥98°F today · 15 d/yr by 30 yrs out
- Wind 6/10 Major 69% chance of damaging wind over 30 yrs
- Air quality 2/10 Low 1 unhealthy d/yr today · 2 by 30 yrs out
Nearby sold comps map
Loading sold comps map…
Walkable amenities ~0.75 mi
Loading nearby amenities…
Taxation est. · year 1
- Rental income
- $39,015
- − Mortgage interest
- −$12,267
- − Property taxes
- −$3,285
- − Insurance
- −$1,095
- − Repairs & maintenance
- −$3,121
- − Management
- −$3,121
- − HOA
- −$5,880
- − Depreciation
- −$6,371
- Taxable income
- $3,874
- Est. tax owed @ 24.0%
- −$930
- After-tax cash flow
- $5,850/yr
For passive investors: Depreciation is non-cash, so a rental often shows a tax loss while cash-flowing — sheltering income. Rental losses are passive: they offset passive income freely, and up to $25,000/yr can offset ordinary (W-2) income if you actively participate and your MAGI is under $100k (phasing out to $0 by $150k); unused losses carry forward. On sale, claimed depreciation is recaptured at up to 25%, and gains may owe capital-gains tax (a 1031 exchange can defer both). Figures are a year-1 estimate at your 24.0% rate — not tax advice; consult a CPA.
Schools (NCES district)
- District
- West Bridgewater
- NCES district ID
- 2512420
- Math proficiency
- 28% ▼ -20.00%
- Reading proficiency
- 53% ▼ -5.00%
- Median HH income
- $78,372
- Composite
- 37.52/100
- National rank
- #4396
- State rank
- #186 of 302 in MA
Livability — West Bridgewater
No livability data for this city. (Only ~50 U.S. cities are tracked.)
Census & demographics
- Population (ZIP)
- 7,682
Population outlook (Plymouth County) Hauer SSP2
- Today (2025)
- 533,105 people
- By 2030
- 541,862 · +1.6%
- By 2040
- 549,791 · +3.1%
- By 2050
- 542,476 · +1.8%
- By 2075
- 518,429 · -2.8%
- By 2100
- 448,179 · -15.9%
Race, ethnicity, and origin ACS 2023
- Neighborhood character
- Predominantly White (90%)
- Race & ethnicity
- White 90% Two or more races 5% Hispanic / Latino 2% Black 2% Asian 1%
- Common ancestry
- Lithuanian 6% Romanian 3% Estonian 3%
- Foreign-born
- 7% · Canada, China
- Languages at home
- 92% English-only · Other Indo-European 4% Spanish 2% French/Haitian/Cajun 1%
Political lean MEDSL · Plymouth
- 2024 margin
- Lean D (+8.8) · D 53.6% · R 44.7% · Other 1.7%
- 2008→2024 swing
- +1.3pp toward D · 2008: 7.6pp · 2024: 8.8pp
- All cycles
- 2024: D+8.8 2020: D+17.4 2016: D+7.2 2012: D+3.8 2008: D+7.6
Not yet ingested
- Civics
- —
Market trends
- HPI YoY
- ▼ -126.76%
- Current HPI
- 173.8606
- Rent YoY
- —
- Metro
- —
- State GDP YoY
- ▲ 2.28%
- F500 in state
- 38
Industry mix (Fortune 500 HQ in MA)
| Industry | F500 HQs | Revenue |
|---|---|---|
| Technology | 3 | $17B |
|
||
| Insurance | 2 | $84B |
|
||
| Retail | 2 | $76B |
|
||
| Life Sciences | 1 | $43B |
|
||
| Energy Technology | 1 | $31B |
|
||
| Aerospace / Defense | 1 | $18B |
|
||
Price history
+46.1% since first listed8 events — show timeline
- 2026-06-03 Listed $219,000 MLS PIN
- 2010-04-06 Sold (MLS) $115,000 MLS PIN
- 2010-02-23 Contingent — MLS PIN
- 2009-10-13 Price Changed $129,900 MLS PIN
- 2009-10-09 Relisted — MLS PIN
- 2009-10-07 Listing Removed — MLS PIN
- 2009-07-16 Price Changed $139,900 MLS PIN
- 2009-06-10 Listed $149,900 MLS PIN
Cash-flow waterfall
monthlySold comps — $/sqft
last 12 mo · ≤1 miLoading sold comps…