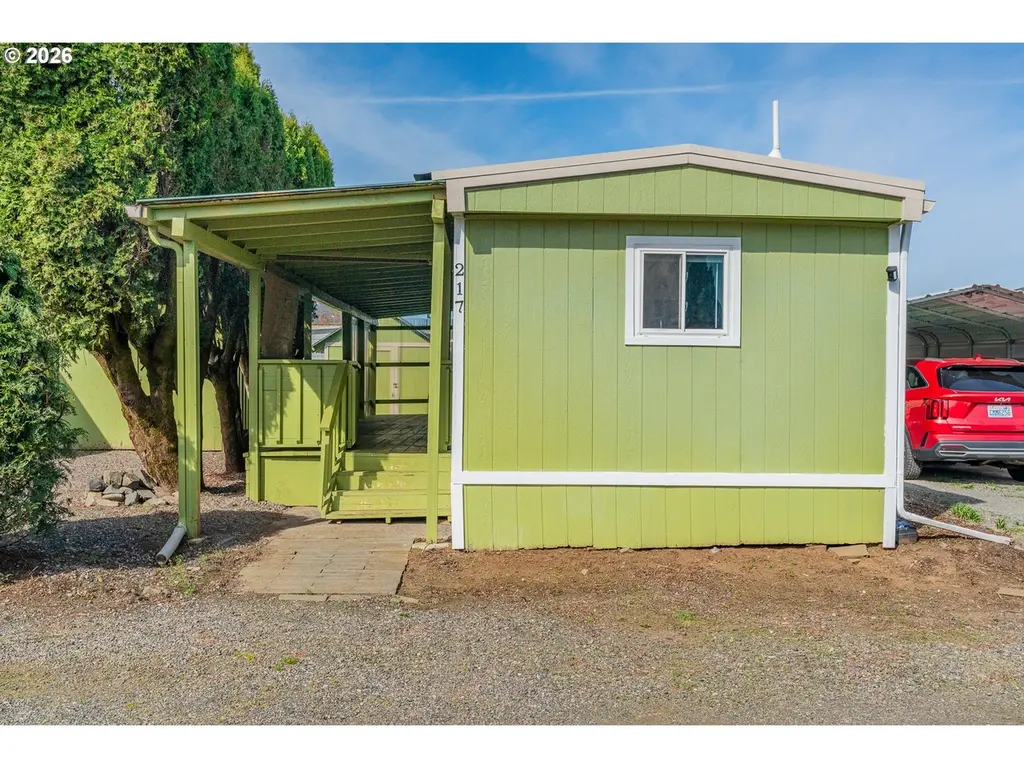
13401 NE 28th St #217 · Vancouver, WA
Flood risk No data
- FEMA flood zone
- —
- Chance of flooding over 30 yrs
- —
- Est. flood insurance / yr
- —
Fire risk No data
- Est. fire insurance / yr
- —
Heat risk No data
- Hot days now (above threshold)
- —
- Hot days in 30 yrs
- —
Wind risk No data
- Chance of severe wind over 30 yrs
- —
Air-quality risk No data
- Unhealthy air days now
- —
- Unhealthy air days in 30 yrs
- —
Risk factors via First Street. Map © Google.
Why this score? — see what drove the C grade
The composite is a weighted blend of 9 inputs, each scored 0–100. Each bar is that input's sub-score; the figure is the points it added to the 100-point composite (weight × sub-score).
- Cash flow +21.6/30.0
- 1% rule +10.0/10.0
- DSCR +6.9/10.0
- ARV discount +4.3/15.0
- Schools +4.3/10.0
- Livability +4.1/5.0
- Rent growth +2.7/5.0
- Condition / age +2.5/5.0
- Appreciation +0.0/10.0
$75,000
🖨 Deal sheet (PDF) 📄 Offer letter ✓ Due diligence
Listing remarks MLS
Charming and well-kept home located in a sought-after all-ages community! This 2-bedroom, 1-bath residence offers 684 sq ft of thoughtfully designed living space. Inside, you’ll find a practical kitchen, dedicated dining area, and the convenience of in-home laundry. The layout is efficient and filled with natural light, creating a bright and welcoming feel throughout. Enjoy a low-maintenance lifestyle in a prime location just minutes from shopping, dining, and daily essentials. An excellent opportunity for affordable homeownership.
Key facts
- In-home laundry
- Practical kitchen
- Prime location
Tags
Neighborhood map
What this means for you Summary
Snapshot
- This is a 2-bed/1.0-bath manufactured listed at $75k.
Deal economics
- At list price, monthly cash flow is $113 ($1k/yr) — positive.
- The deal already cash-flows at list — no discount required.
- Meets the 1% rule at list price ($2k rent vs $75k).
- Recommended offer: $70k (6.0% below list) — sets the bar for market timing.
- Cap rate 8.1% vs local median 2.7% in Vancouver — top-decile yield for the area; either an underpriced asset or a hidden risk that comps aren't pricing in. Stress-test before assuming the spread holds.
Location & tenants
- Location reads 82/100 on livability (#62 in WA, #1,133 nationally) — a professional / high-income tenant draw. Strengths: amenities A+, commute A+, housing A+; Watch: crime F, cost of living D-.
- Evergreen School District (Clark) (urban): math 41% / reading 51% proficiency, ranked #164 of 291 in WA (top 56%) — families likely to look elsewhere, expect single-tenant / working-renter base with shorter leases.
- Market conditions: Rents flat; 463 active listings in the ZIP; 18 comparable units currently listed for rent nearby; rentals leasing fast (median 4d on market — plan ~1-2 weeks tenant-placement turnaround); solid renter incomes; 3,547 units permitted in Clark County in 2024 (1,361 in 5+ unit buildings).
Forward outlook
- Local home prices are declining (-3.0%/yr); year-one equity from $519 of loan paydown is wiped out by about $2k of value loss. Plan a longer hold.
- Clark County population projected at +29% by 2050 — long-run rental-demand tailwind backs the buy-and-hold thesis.
Negotiation context
- It's been on market 66 days — a 6% lower offer ($70k) is reasonable based on typical stale-listing flexibility.
Risks & watch-outs
- Watch-outs: HOA is 47% of rent.
Questions for the listing agent
- It's been on market 66 days. Have you received any prior offers? Is the seller open to a 6% concession, seller financing, or rate buy-down credit?
- Built in 1972 — when were the roof, HVAC, electrical panel, plumbing, and water heater last replaced?
- What does the HOA fee cover, when was the last increase, and are there any pending special assessments or reserve-fund shortfalls?
- Why hasn't it sold? Are there any deal-killer items the seller is aware of (foundation, flood, title, zoning, code violations)?
- Is there a deadline driving the sale (1031 exchange, divorce, estate, relocation)? That informs how much negotiation room exists.
- Crime grade is F in this area — have there been break-ins, vandalism, or insurance claims at this property in the last 3 years? What carrier currently insures it and at what premium?
- What's the average days-on-market for RENTAL listings here right now (not sales)? A rising rental-DOM trend means longer vacancies and softer asking-rent achievability than the comps imply.
- What's the recent tenant-quality profile in this submarket — average credit score on applications, eviction rate, late-payment / NSF rate, and stable-employment percentage? A property-management company in the area should have these aggregated.
- How much new for-sale + rental construction is in the pipeline within 1–3 miles? Heavy new supply typically softens prices + rents 12–24 months out; constrained supply supports both.
Investment metrics
- 1% rule
- 2.28% ✓
- Cap rate
- 8.11%
- Cash-on-cash
- 6.48%
- DSCR
- 1.29
- GRM
- 3.7
CMA / ARV
- ARV (median comp)
- $69,991
- List price
- $75,000
- Delta
- 7.16%
- Verdict
- FAIR
- Comps
- 2 within 1.0 mi
Show comp detail 3 sales within ~0.75 mi
| Address | Dist | Beds/Ba | Sqft | Sold | Price | $/sf | Match |
|---|---|---|---|---|---|---|---|
| 13401 NE 28th St Unit 309-A | 0.00mi | 2/1.0 | 690 (+1%) | 20mo | $110,800 | $161 | 82 |
| 13401 NE 28th St #210 | 0.00mi | 2/1.0 | 720 (+5%) | 12mo | $70,000 | $97 | 81 |
| 13401 NE 28 St #215 | 0.00mi | 2/1.0 | 778 (+14%) | 3mo | $70,000 | $90 | 75 |
Match score weights: distance 35% · size 25% · config 20% · recency 20%. Top-matched comps best support the ARV.
Projected returns pro-forma
-3.0% appreciation · 0.63% rent growth · sell at horizon
- IRR
- -11.6%
- Equity multiple
- 0.60×
- Total profit
- $-8,451
- Equity at exit
- $11,183
- IRR
- -12.3%
- Equity multiple
- 0.44×
- Total profit
- $-11,754
- Equity at exit
- $6,485
Cash invested: $21,000 (down + closing). Projections, not guarantees.
Landlord ↔ Tenant lean methodology
- Overall (STATE)
- 28 Tenant-Leaning
- State Washington
- 28 Tenant-Leaning · D+8
- County
- — inherits STATE
- City
- — inherits STATE
ZIP-level market 98682
- Rents YoY
- 0.6%
- Active inventory
- 463
- Price-to-rent
- 3.7×
Monthly cashflow live
- Estimated rent
- $1,710 high interval (Pro) →
- Mortgage (P&I)
- −$393
- Tax from tax record
- −$13 /mo · $160/yr
- Insurance
- −$31
- HOA
- −$800
- Vacancy / Maint / Mgmt
- −$359
- Net cashflow
- $113
Break-even live
Sensitivity live
| Price | -10% $156 | -5% $135 | +0% $113 | +5% $92 | +10% $-19 |
|---|---|---|---|---|---|
| Rent | -10% $-22 | -5% $46 | +0% $113 | +5% $181 | +10% $248 |
| Rate | -1.0pp $151 | -0.5pp $132 | base $113 | +0.5pp $94 | +1.0pp $74 |
UW: 25.0% down · 7.5% · 30yr · 1.5% tax · 5.0% vac · 8.0% maint · 8.0% mgmt
Financing live
Cash to close
- Down payment
- $18,750
- Closing costs
- $2,250
- Reserves months
- —
- Total cash needed
- —
Loan-product check · same deal, 3 products live
Conventional
25% down · 7.5% · 30yr
- Down + closing
- —
- Monthly P&I
- —
- Monthly cashflow
- —
- DSCR
- —
- Eligible?
- —
Personal DTI + credit; lowest rate.
DSCR
20% down · 8.5% · 30yr
- Down + closing
- —
- Monthly P&I
- —
- Monthly cashflow
- —
- DSCR
- —
- Eligible?
- —
No personal income docs; deal must DSCR.
Hard money
10% down · 12.0% · 12mo
- Down + closing
- —
- Monthly P&I
- —
- Monthly cashflow
- —
- DSCR
- —
- Eligible?
- —
Short-term bridge; refi at stabilization.
Rent comps 18 comps
| Address | Beds | Baths | Sqft | Rent | $/sqft | DOM | Units | Dist |
|---|---|---|---|---|---|---|---|---|
| 13609 NE 28th St Vancouver, WA | 2.0 | 1.0 | 750 | $1,400 | $1.87 | 44d | 1 | 0.20mi |
| 12901 NE 28th St Vancouver, WA | 1.0–2.0 | 1.0 | 824 | $1,934 | $2.35 | 2d | 10 | 0.21mi |
| 12101 NE 28th St Vancouver, WA | 1.0–2.0 | 1.0–2.0 | 806 | $2,086 | $2.59 | 3d | 13 | 0.59mi |
| 1330 NE 136th Ave Vancouver, WA | 1.0–3.0 | 1.0–2.0 | 1016 | $2,015 | $1.98 | 3d | 15 | 0.59mi |
| 2201 NE 112th Ave Vancouver, WA | 1.0 | 1.0 | 713 | $1,575 | $2.21 | 13d | 1 | 1.02mi |
| 2201 NE 112th Ave Vancouver, WA | 1.0 | 1.0 | 713 | $1,565 | $2.19 | 44d | 1 | 1.02mi |
| 2201 NE 112th Ave Vancouver, WA | 1.0–3.0 | 1.0–2.0 | 935 | $1,846 | $1.97 | 5d | 1 | 1.02mi |
| 1900 NE 113th Ct Vancouver, WA | 1.0–2.0 | 1.0–2.0 | 887 | $1,777 | $2.00 | 2d | 6 | 1.04mi |
| 2400 NE 112th Ave Vancouver, WA | 1.0–2.0 | 1.0 | 435 | $1,395 | $3.20 | 15d | 6 | 1.08mi |
| 1618 NE 112th Ave Vancouver, WA | 1.0 | 1.0 | 588 | $1,504 | $2.56 | 3d | 3 | 1.20mi |
| 4905 NE 122nd Ave Vancouver, WA | 1.0 | 1.0 | 684 | $1,500 | $2.19 | 8d | 1 | 1.25mi |
| 333 NE 136th Ave Vancouver, WA | 1.0 | 1.0 | 684 | $1,650 | $2.41 | 3d | 2 | 1.28mi |
| 3708 NE 109th Ave Vancouver, WA | 1.0–3.0 | 1.0–2.0 | 899 | $1,779 | $1.98 | 3d | 30 | 1.37mi |
| 11716 NE 49th St Vancouver, WA | 1.0–3.0 | 1.0–2.5 | 1090 | $1,788 | $1.64 | 8d | 15 | 1.43mi |
| 4000 NE 109th Ave Vancouver, WA | 1.0–2.0 | 1.0–2.5 | 780 | $1,950 | $2.50 | 3d | 2 | 1.43mi |
| 10415 NE Oakbrook Cir Vancouver, WA | 1.0–2.0 | 1.0–1.5 | 764 | $1,583 | $2.07 | 3d | 6 | 1.44mi |
| 11301 NE 7th St Vancouver, WA | 3.0 | 1.0–2.0 | 840 | $1,867 | $2.22 | 2d | 43 | 1.47mi |
| 11412 NE 49th St Vancouver, WA | 1.0–2.0 | 1.0–2.0 | 810 | $1,730 | $2.14 | 2d | 6 | 1.49mi |
HOA detail
- Monthly dues
- $800 · $9,600/yr
Listing history 15 events
-
2026-06-21days on market $75,000 Active 66 DOM
-
2026-06-18days on market $75,000 Active 63 DOM
-
2026-06-17days on market $75,000 Active 62 DOM
-
2026-06-16days on market $75,000 Active 61 DOM
-
2026-06-15days on market $75,000 Active 60 DOM
-
2026-06-13days on market $75,000 Active 58 DOM
-
2026-06-13days on market $75,000 Active 57 DOM
-
2026-06-09days on market $75,000 Active 54 DOM
-
2026-06-08days on market $75,000 Active 53 DOM
-
2026-06-07days on market $75,000 Active 52 DOM
-
2026-06-03days on market $75,000 Active 48 DOM
-
2026-06-02days on market $75,000 Active 47 DOM
-
2026-06-01days on market $75,000 Active 46 DOM
-
2026-05-31days on market $75,000 Active 45 DOM
-
2026-04-16$75,000 Active 543-char remark
Show marketing remark (543 chars)
Charming and well-kept home located in a sought-after all-ages community! This 2-bedroom, 1-bath residence offers 684 sq ft of thoughtfully designed living space. Inside, you’ll find a practical kitchen, dedicated dining area, and the convenience of in-home laundry. The layout is efficient and filled with natural light, creating a bright and welcoming feel throughout. Enjoy a low-maintenance lifestyle in a prime location just minutes from shopping, dining, and daily essentials. An excellent opportunity for affordable homeownership.
ⓘ Source: listings_history table (triggers on properties + properties_extension) + one-shot
backfill from property_details.listing_events for pre-trigger history.
Tax reassessment forecast WA · Resets to sale price
- Current annual tax
- $160 · $13/mo
- Projected year-2 tax
- $735 · $61/mo
- Expected delta
- +$575/yr (+$48/mo · 359.7%)
ⓘ Screening estimate from a state-policy table — verify with the county assessor before closing.
Nearby sold comps map
Loading sold comps map…
Walkable amenities ~0.75 mi
Loading nearby amenities…
Taxation est. · year 1
- Rental income
- $20,525
- − Mortgage interest
- −$4,201
- − Property taxes
- −$160
- − Insurance
- −$375
- − Repairs & maintenance
- −$1,642
- − Management
- −$1,642
- − HOA
- −$9,600
- − Depreciation
- −$2,182
- Taxable income
- $723
- Est. tax owed @ 24.0%
- −$174
- After-tax cash flow
- $1,187/yr
For passive investors: Depreciation is non-cash, so a rental often shows a tax loss while cash-flowing — sheltering income. Rental losses are passive: they offset passive income freely, and up to $25,000/yr can offset ordinary (W-2) income if you actively participate and your MAGI is under $100k (phasing out to $0 by $150k); unused losses carry forward. On sale, claimed depreciation is recaptured at up to 25%, and gains may owe capital-gains tax (a 1031 exchange can defer both). Figures are a year-1 estimate at your 24.0% rate — not tax advice; consult a CPA.
Schools (NCES district)
- District
- Evergreen School District (Clark)
- NCES district ID
- 5302700
- Math proficiency
- 41% ▼ -3.00%
- Reading proficiency
- 51% ▼ -3.00%
- Median HH income
- $59,418
- Composite
- 42.53/100
- National rank
- #6859
- State rank
- #164 of 291 in WA
Livability — Vancouver
- Score
- 82/100
- State rank
- #62
- US rank
- #1133
Category grades
Schools grade is shown separately in the Schools card above.
Census & demographics
- Census place
- Vancouver, WA
- County
- Clark County · 513,189 people
- City population
- 360,195
- Metro
- Portland-Vancouver-Hillsboro, OR-WA
- Population (ZIP)
- 68,305
- Household income
- $99,918
- Rent vs Own
- Severe rent burden
- 1618.0
Population outlook (Clark County) Hauer SSP2
- Today (2025)
- 529,610 people
- By 2030
- 563,242 · +6.4%
- By 2040
- 625,905 · +18.2%
- By 2050
- 681,558 · +28.7%
- By 2075
- 805,967 · +52.2%
- By 2100
- 877,450 · +65.7%
Race, ethnicity, and origin ACS 2023
- Neighborhood character
- Predominantly White (69%)
- Race & ethnicity
- White 69% Hispanic / Latino 15% Two or more races 13% Asian 6% Black 2% Pacific Islander 1%
- Hispanic origin (detail)
- Mexican 12%
- Common ancestry
- Portuguese 3% Subsaharan African 3% Scotch-Irish 2%
- Foreign-born
- 13% · Canada, Vietnam, South Korea
- Languages at home
- 79% English-only · Spanish 8% Russian/Polish/Slavic 6% Other Asian/Pacific 2%
Political lean MEDSL · Clark
- 2024 margin
- Lean D (+7.0) · D 52.1% · R 45.1% · Other 2.8%
- 2008→2024 swing
- +0.9pp no change · 2008: 6.1pp · 2024: 7.0pp
- All cycles
- 2024: D+7.0 2020: D+5.1 2016: D+0.1 2012: D+0.1 2008: D+6.1
Not yet ingested
- Civics
- —
Market trends
- HPI YoY
- ▼ -303.95%
- Current HPI
- 307.0529
- Rent YoY
- ▲ 0.63%
- Metro
- Portland-Vancouver-Hillsboro, OR-WA
- State GDP YoY
- ▲ 4.65%
- F500 in state
- 22
Industry mix (Fortune 500 HQ in WA)
| Industry | F500 HQs | Revenue |
|---|---|---|
| Retail | 2 | $269B |
|
||
| Technology / Retail | 1 | $638B |
|
||
| Technology | 1 | $245B |
|
||
| Telecommunications | 1 | $38B |
|
||
| Food / Beverage | 1 | $36B |
|
||
| Automotive / Trucks | 1 | $34B |
|
||
Price history
1 event — show timeline
- 2026-04-16 Listed $75,000 RMLS
Property tax history
+29.1%/yrLatest (2026): $160 · +109.2% YoY. Source: county tax records.
Cash-flow waterfall
monthlySold comps — $/sqft
last 12 mo · ≤1 miLoading sold comps…