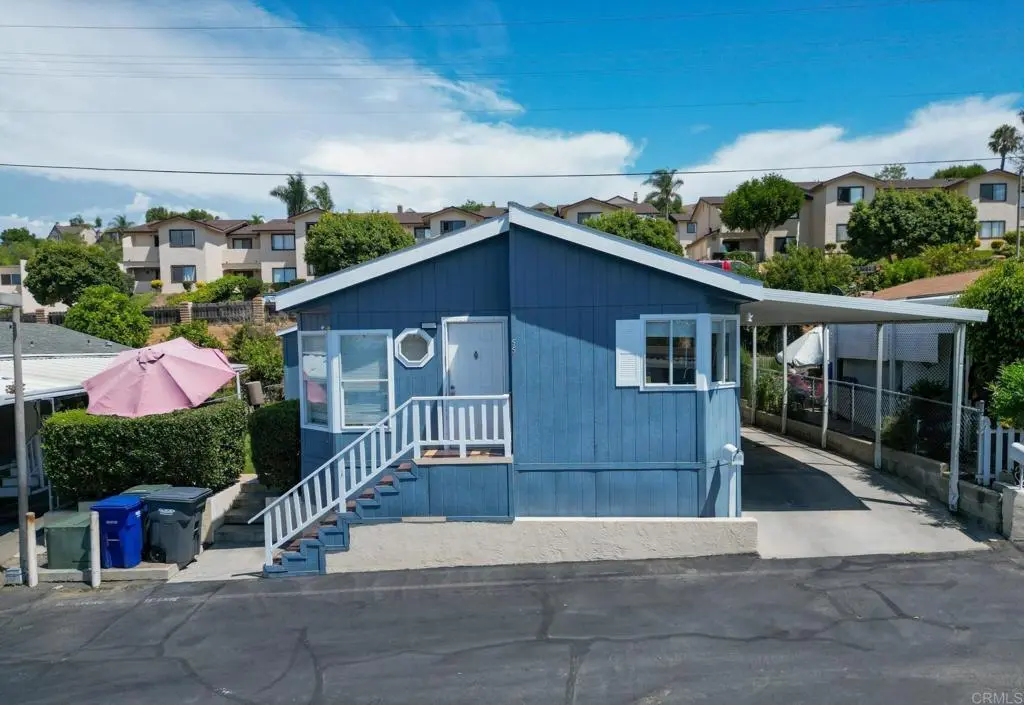
1455 Alturas Rd #55 · Fallbrook, CA
Flood risk 1/10 · Minimal
- FEMA flood zone
- X (unshaded)
- Chance of flooding over 30 yrs
- 0.0%
- Est. flood insurance / yr
- $507 – $1,088
Fire risk 7/10 · Major
- Est. fire insurance / yr
- $659 – $1,223
Heat risk 6/10 · Moderate
- Hot days now (above 94°F)
- 4 days/yr
- Hot days in 30 yrs
- 14 days/yr
Wind risk 1/10 · Minimal
- Chance of severe wind over 30 yrs
- —
Air-quality risk 4/10 · Minor
- Unhealthy air days now
- 4 days/yr
- Unhealthy air days in 30 yrs
- 4 days/yr
Risk factors via First Street. Map © Google.
Why this score? — see what drove the D+ grade
The composite is a weighted blend of 9 inputs, each scored 0–100. Each bar is that input's sub-score; the figure is the points it added to the 100-point composite (weight × sub-score).
- Cash flow +24.6/30.0
- DSCR +7.9/10.0
- 1% rule +5.1/10.0
- Schools +3.9/10.0
- Condition / age +2.5/5.0
- Rent growth +2.4/5.0
- Livability +2.1/5.0
- ARV discount +0.0/15.0
- Appreciation +0.0/10.0
$270,000
🖨 Deal sheet 📄 Offer letter ✓ Due diligence
Listing remarks
Immaculate & Spacious Manufactured Home in Valley View Estates Welcome to this beautifully maintained Fleetwood double-wide in the desirable Valley View Estates community of Fallbrook. This home offers 3 bedrooms, 2 bathrooms, a bright and inviting living room, dining area, and kitchen, plus a convenient laundry area. Enjoy the extra touches, including a 3-car carport, private side yard, and storage shed. Community amenities include a swimming pool, children’s play park, and laundry facilities. Ideally located near the heart of town with shopping, dining, and other amenities just minutes away. Move-in ready and waiting for its new owner!
Key facts
- 3 car carport
- Valley view estates
- Manufactured home
Tags
Property features AI
Finance
- Other: Pets allowed
- Financial info: Land lease: $925 monthly
- HOA & community: Located in a mobile home park (Valley View Mobile Home Park); Community is rural/park setting
Exterior
- Parking: Carport; Parking available (located in Valley View Mobile Home Park)
- Utilities: Public sewer; Land lease applies (monthly)
- Home design: Mobile home (model 3502K, 11' x 44'); Double body type; Single-story
- Construction: Composition roof; Mobile home remains; Built (year per assessor)
- Exterior features: Partial fencing; Landscaped lot; Community pool; Has a view
Interior
- Kitchen: Gas range
- Bedrooms: Primary bedroom
- Flooring: Tile flooring
- Bathrooms: 2 full bathrooms
- Heating & cooling: Forced air heating; Cooling available (see remarks)
- Interior features: One-level home; Front door entry; Turnkey condition; Family room
- Laundry & utility: Laundry in individual room
Neighborhood map
What this means for you Summary
Snapshot
- This is a 3-bed/2.0-bath manufactured listed at $270k.
Deal economics
- At list price, monthly cash flow is $558 ($7k/yr) — positive.
- The deal already cash-flows at list — no discount required.
- Meets the 1% rule at list price ($3k rent vs $270k).
- Recommended offer: $262k (3.0% below list) — sets the bar for market timing.
- Cap rate 8.8% vs local median 2.4% in Fallbrook — top-decile yield for the area; either an underpriced asset or a hidden risk that comps aren't pricing in. Stress-test before assuming the spread holds.
Location & tenants
- Location reads 42/100 on livability (#1,364 in CA) — a working-class tenant base; expect higher turnover. Watch: schools D+, crime D-, amenities F.
- Fallbrook Union High (suburban): math 32% / reading 58% proficiency, ranked #183 of 517 in CA (top 35%) — families likely to look elsewhere, expect single-tenant / working-renter base with shorter leases.
- Market conditions: Rents soft (-0.3%/yr); 345 active listings in the ZIP; 7 comparable units currently listed for rent nearby; rentals leasing fast (median 2d on market — plan ~1-2 weeks tenant-placement turnaround); high-income renter base; 11,759 units permitted in San Diego County in 2024 (7,244 in 5+ unit buildings).
Forward outlook
- Local home prices are declining (-3.0%/yr); year-one equity from $2k of loan paydown is wiped out by about $8k of value loss. Plan a longer hold.
- San Diego County population projected at +20% by 2050 — long-run rental-demand tailwind backs the buy-and-hold thesis.
Negotiation context
- It's been on market 38 days — a 3% lower offer ($262k) is reasonable based on typical stale-listing flexibility.
- 3 sale attempts with the ask held roughly flat each time — persistent listings suggest the price (not the market) is what's stuck; bring a comps-based counter.
Risks & watch-outs
- Climate carrying-cost: major wildfire risk; extreme-heat days projected 4→14/yr by 2055 (HVAC capex compounding) — expect insurance premiums to compound above CPI over the hold.
Questions for the listing agent
- It's been on market 38 days. Have you received any prior offers? Is the seller open to a 3% concession, seller financing, or rate buy-down credit?
- Is there a deadline driving the sale (1031 exchange, divorce, estate, relocation)? That informs how much negotiation room exists.
- Schools are D-rated, which usually means shorter tenancies and higher turnover. Who's the typical renter profile here, and what's been the actual vacancy rate?
- Crime grade is D in this area — have there been break-ins, vandalism, or insurance claims at this property in the last 3 years? What carrier currently insures it and at what premium?
- The area grade is low — what's the realistic commute time and amenity access for the typical tenant pool here? Any planned neighborhood developments (good or bad) we should know about?
- What's the average days-on-market for RENTAL listings here right now (not sales)? A rising rental-DOM trend means longer vacancies and softer asking-rent achievability than the comps imply.
- What's the recent tenant-quality profile in this submarket — average credit score on applications, eviction rate, late-payment / NSF rate, and stable-employment percentage? A property-management company in the area should have these aggregated.
- How much new for-sale + rental construction is in the pipeline within 1–3 miles? Heavy new supply typically softens prices + rents 12–24 months out; constrained supply supports both.
Investment metrics
- 1% rule
- 1.01% ✓
- Cap rate
- 8.77%
- Cash-on-cash
- 8.86%
- DSCR
- 1.39
- GRM
- 8.2
CMA / ARV
- ARV (on-the-fly)
- $220,500
- Comps found
- 1
Show comp detail 1 sale within ~0.75 mi
| Address | Dist | Beds/Ba | Sqft | Sold | Price | $/sf | Match |
|---|---|---|---|---|---|---|---|
| 1455 Alturas #46 | 0.01mi | 3/2.0 | 1,168 (+11%) | 2mo | $245,000 | $210 | 79 |
Match score weights: distance 35% · size 25% · config 20% · recency 20%. Top-matched comps best support the ARV.
Projected returns pro-forma
-3.0% appreciation · 0.0% rent growth · sell at horizon
- IRR
- -6.0%
- Equity multiple
- 0.78×
- Total profit
- $-16,346
- Equity at exit
- $40,258
- IRR
- 0.0%
- Equity multiple
- 1.00×
- Total profit
- $71
- Equity at exit
- $23,345
Cash invested: $75,600 (down + closing). Projections, not guarantees.
Landlord ↔ Tenant lean methodology
- Overall (STATE)
- 18 Strongly Tenant-Friendly
- State California
- 18 Strongly Tenant-Friendly · D+13
- County
- — inherits STATE
- City
- — inherits STATE
ZIP-level market 92028
- Rents YoY
- -0.3%
- Active inventory
- 345
- Price-to-rent
- 8.2×
Monthly cashflow live
- Estimated rent
- $2,734 high interval (Pro) →
- Mortgage (P&I)
- −$1,416
- Tax from tax record
- −$74 /mo · $882/yr
- Insurance
- −$112
- HOA
- −$0
- Vacancy / Maint / Mgmt
- −$574
- Net cashflow
- $558
Break-even live
UW: 25.0% down · 7.5% · 30yr · 1.5% tax · 5.0% vac · 8.0% maint · 8.0% mgmt
Financing live
Cash to close
- Down payment
- $67,500
- Closing costs
- $8,100
- Reserves months
- —
- Total cash needed
- —
Loan-product check · same deal, 3 products live
Conventional
25% down · 7.5% · 30yr
- Down + closing
- —
- Monthly P&I
- —
- Monthly cashflow
- —
- DSCR
- —
- Eligible?
- —
Personal DTI + credit; lowest rate.
DSCR
20% down · 8.5% · 30yr
- Down + closing
- —
- Monthly P&I
- —
- Monthly cashflow
- —
- DSCR
- —
- Eligible?
- —
No personal income docs; deal must DSCR.
Hard money
10% down · 12.0% · 12mo
- Down + closing
- —
- Monthly P&I
- —
- Monthly cashflow
- —
- DSCR
- —
- Eligible?
- —
Short-term bridge; refi at stabilization.
Rent comps 7 comps
| Address | Beds | Baths | Sqft | Rent | $/sqft | DOM | Units | Dist |
|---|---|---|---|---|---|---|---|---|
| 501 Ammunition Rd Fallbrook, CA | 1.0–2.0 | 1.0 | 900 | $1,995 | $2.22 | 2d | 2 | 0.30mi |
| 303 W Clemmens Ln Fallbrook, CA | 2.0 | 1.0 | 824 | $2,375 | $2.88 | 3d | 5 | 0.35mi |
| 1133 Old Stage Rd Fallbrook, CA | 2.0 | 1.0 | 850 | $2,400 | $2.82 | 2d | 1 | 0.63mi |
| 744 W Fallbrook St Fallbrook, CA | 1.0–2.0 | 1.0–2.0 | 780 | $2,200 | $2.82 | 2d | 1 | 0.64mi |
| 1732 Woodbrook Ln Fallbrook, CA | 2.0 | 2.0 | 1367 | $2,950 | $2.16 | 2d | 1 | 0.72mi |
| 338 E Fallbrook St Fallbrook, CA | 2.0 | 2.0 | 976 | $2,495 | $2.56 | 3d | 1 | 0.94mi |
| 421 Potter St Fallbrook, CA | 1.0–2.0 | 1.0–2.0 | 726 | $2,100 | $2.89 | 2d | 2 | 1.19mi |
Listing history 20 events
-
2026-06-18days on market $270,000 Active 38 DOM
-
2026-06-17days on market $270,000 Active 37 DOM
-
2026-06-16days on market $270,000 Active 36 DOM
-
2026-06-15days on market $270,000 Active 35 DOM
-
2026-06-13days on market $270,000 Active 33 DOM
-
2026-06-13days on market $270,000 Active 32 DOM
-
2026-06-09days on market $270,000 Active 29 DOM
-
2026-06-08days on market $270,000 Active 28 DOM
-
2026-06-07days on market $270,000 Active 27 DOM
-
2026-06-04days on market $270,000 Active 24 DOM
-
2026-06-03days on market $270,000 Active 23 DOM
-
2026-06-02days on market $270,000 Active 22 DOM
-
2026-06-01days on market $270,000 Active 21 DOM
-
2026-05-31days on market $270,000 Active 20 DOM
-
2026-05-11$270,000 Active
-
2026-01-22price $270,000
-
2025-12-16price $275,000
-
2025-12-08status Active
-
2025-11-15status Pending Sale
-
2025-08-28$295,000 Active
ⓘ Source: listings_history table (triggers on properties + properties_extension) + one-shot
backfill from property_details.listing_events for pre-trigger history.
Tax reassessment forecast CA · Resets to sale price
- Current annual tax
- $882 · $74/mo
- Projected year-2 tax
- $2,052 · $171/mo
- Expected delta
- +$1,170/yr (+$98/mo · 132.7%)
ⓘ Screening estimate from a state-policy table — verify with the county assessor before closing.
Climate risk First Street
- Flood 1/10 Low FEMA zone X (unshaded) · 0% chance over 30 yrs
- Wildfire 7/10 Severe
- Heat 6/10 Major 4 d/yr ≥94°F today · 14 d/yr by 30 yrs out
- Wind 1/10 Low
- Air quality 4/10 Moderate 4 unhealthy d/yr today · 4 by 30 yrs out
Nearby sold comps map
Loading sold comps map…
Walkable amenities ~0.75 mi
Loading nearby amenities…
Taxation est. · year 1
- Rental income
- $32,809
- − Mortgage interest
- −$15,124
- − Property taxes
- −$882
- − Insurance
- −$1,350
- − Repairs & maintenance
- −$2,625
- − Management
- −$2,625
- − Depreciation
- −$7,855
- Taxable income
- $2,348
- Est. tax owed @ 24.0%
- −$564
- After-tax cash flow
- $6,132/yr
For passive investors: Depreciation is non-cash, so a rental often shows a tax loss while cash-flowing — sheltering income. Rental losses are passive: they offset passive income freely, and up to $25,000/yr can offset ordinary (W-2) income if you actively participate and your MAGI is under $100k (phasing out to $0 by $150k); unused losses carry forward. On sale, claimed depreciation is recaptured at up to 25%, and gains may owe capital-gains tax (a 1031 exchange can defer both). Figures are a year-1 estimate at your 24.0% rate — not tax advice; consult a CPA.
Schools (NCES district)
- District
- Fallbrook Union High
- NCES district ID
- 0613530
- Math proficiency
- 32% ▲ 11.00%
- Reading proficiency
- 58% ▲ 9.00%
- Median HH income
- $56,644
- Composite
- 39.17/100
- National rank
- #4025
- State rank
- #183 of 517 in CA
Livability — Fallbrook
- Score
- 42/100
- State rank
- #1364
- US rank
- #27057
Category grades
Schools grade is shown separately in the Schools card above.
Census & demographics
- Census place
- Fallbrook, CA
- County
- San Diego County · 3,178,799 people
- City population
- 52,227
- Metro
- San Diego-Chula Vista-Carlsbad, CA
- Population (ZIP)
- 52,227
- Household income
- $111,290
- Rent vs Own
- Severe rent burden
- 1384.0
Population outlook (San Diego County) Hauer SSP2
- Today (2025)
- 3,678,185 people
- By 2030
- 3,856,546 · +4.8%
- By 2040
- 4,171,407 · +13.4%
- By 2050
- 4,421,607 · +20.2%
- By 2075
- 4,831,599 · +31.4%
- By 2100
- 4,832,502 · +31.4%
Race, ethnicity, and origin ACS 2023
- Neighborhood character
- Diverse neighborhood (Simpson 0.59)
- Race & ethnicity
- White 48% Hispanic / Latino 42% Two or more races 21% Asian 4% Black 2% Native American 1%
- Hispanic origin (detail)
- Mexican 35%
- Common ancestry
- Slovak 2% Italian 2% Romanian 2%
- Foreign-born
- 21% · Canada, Vietnam, China
- Languages at home
- 66% English-only · Spanish 29% Tagalog/Filipino 1% Other Asian/Pacific 1%
Political lean MEDSL · San Diego
- 2024 margin
- D (+16.8) · D 56.9% · R 40.1% · Other 2.9%
- 2008→2024 swing
- +6.6pp toward D · 2008: 10.2pp · 2024: 16.8pp
- All cycles
- 2024: D+16.8 2020: D+22.8 2016: D+17.8 2012: D+5.1 2008: D+10.2
Not yet ingested
- Civics
- —
Market trends
- HPI YoY
- ▼ -533.50%
- Current HPI
- 320.7162
- Rent YoY
- ▼ -0.35%
- Metro
- San Diego-Chula Vista-Carlsbad, CA
- State GDP YoY
- ▲ 3.21%
- F500 in state
- 116
Industry mix (Fortune 500 HQ in CA)
| Industry | F500 HQs | Revenue |
|---|---|---|
| Technology | 27 | $1,492B |
|
||
| Financial Services | 3 | $174B |
|
||
| Retail | 3 | $44B |
|
||
| Insurance | 3 | $26B |
|
||
| Media / Entertainment | 2 | $115B |
|
||
| Pharmaceuticals / Biotech | 2 | $62B |
|
||
Price history
-8.5% since first listed6 events — show timeline
- 2026-05-11 Listed $270,000 CRMLS
- 2026-01-22 Price Changed $270,000 CRMLS
- 2025-12-16 Price Changed $275,000 CRMLS
- 2025-12-08 Relisted — CRMLS
- 2025-11-15 Pending — CRMLS
- 2025-08-28 Listed $295,000 CRMLS
Property tax history
+3.6%/yrLatest (2013): $882 · +1.0% YoY. Source: county tax records.
Cash-flow waterfall
monthlySold comps — $/sqft
last 12 mo · ≤1 miLoading sold comps…