 🌊 Lakefront
81 Westlake Rd · Westwood Shores, TX
Flood risk 1/10 · Minimal
- FEMA flood zone
- —
- Chance of flooding over 30 yrs
- 0.0%
- Est. flood insurance / yr
- —
Fire risk 4/10 · Minor
- Est. fire insurance / yr
- $1,222 – $2,270
Heat risk 8/10 · Major
- Hot days now (above 111°F)
- 7 days/yr
- Hot days in 30 yrs
- 24 days/yr
Wind risk 8/10 · Major
- Chance of severe wind over 30 yrs
- 93.0%
Air-quality risk 1/10 · Minimal
- Unhealthy air days now
- 0 days/yr
- Unhealthy air days in 30 yrs
- 0 days/yr
Risk factors via First Street. Map © Google.
Why this score? — see what drove the C- grade
The composite is a weighted blend of 9 inputs, each scored 0–100. Each bar is that input's sub-score; the figure is the points it added to the 100-point composite (weight × sub-score).
- ARV discount +15.0/15.0
- Cash flow +11.0/30.0
- 1% rule +6.6/10.0
- Appreciation +4.7/10.0
- DSCR +3.2/10.0
- Livability +3.1/5.0
- Rent growth +2.5/5.0
- Condition / age +2.5/5.0
- Schools +2.3/10.0
$99,999
🖨 Deal sheet (PDF) 📄 Offer letter ✓ Due diligence
Listing remarks
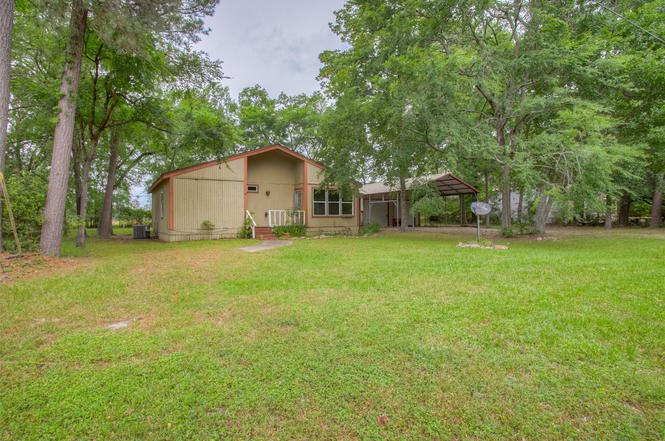
Welcome to this charming 3-bedroom, 1-bath home in the desirable Westwood Shores community! Featuring brand-new flooring and fresh paint throughout, this move-in-ready property sits on two spacious lots, offering exceptional outdoor space and flexibility. A large shop with two roll-up doors plus a carport provides ample room for storage, hobbies, boats, or extra vehicles. Located in a gated, lakefront community, residents enjoy access to Lake Livingston, a golf course, swimming pool, private ponds, tennis and basketball courts, and more—bringing resort-style living right to your doorstep!
Key facts
- 6,599 sq ft lot
- 2 garage spots
- Community pool
Property features AI
Finance
- HOA & community: Part of Westwood Shores POA; Annual association fee (covers clubhouse and recreation facilities); Community amenities include clubhouse, pool, fitness center, tennis and pickleball courts, basketball court, golf, marina/boat dock and ramp, RV/boat storage and parking, gated community
Exterior
- Parking: Detached 2-car garage; Detached carport with 2 spaces; RV access/parking
- Security: Controlled access
- Utilities: Public water; Public sewer
- Home design: Residential property; Built in 1975
- Construction: Wood siding; Block foundation; Composition roof; Built in 1975
- Exterior features: Porch; Near golf course; Subdivision setting; Wooded lot; Pond on the lot; Association pool
Interior
- Kitchen: Electric oven; Electric range; Microwave; Refrigerator
- Bedrooms: Three bedrooms on the first floor (approx. 11x9, 12x10, 12x10)
- Bathrooms: One full bathroom
- Heating & cooling: Central heating (electric); Central air (electric)
- Interior features: Controlled access
- Laundry & utility: Washer hookup; Electric dryer hookup
Neighborhood map
What this means for you Summary
Snapshot
- This is a 3-bed/1.0-bath single-family listed at $100k.
Deal economics
- At list price, monthly cash flow is $-42 ($-503/yr) — negative.
- To cash-flow at today's rent, offer at most $93k (7.4% below list).
- Meets the 1% rule at list price ($1k rent vs $100k).
- Recommended offer: $88k (12.0% below list) — sets the bar for market timing.
- Cap rate 5.8% vs local median 3.4% in Westwood Shores — top-decile yield for the area; either an underpriced asset or a hidden risk that comps aren't pricing in. Stress-test before assuming the spread holds.
Location & tenants
- Location reads 62/100 on livability (#914 in TX) — a middle-class / working-renter tenant base. Strengths: crime A+, cost of living A+, housing A+; Watch: amenities F, commute F, health & safety F.
- Trinity ISD (rural): math 27% / reading 29% proficiency, ranked #682 of 826 in TX (top 83%) — low school quality limits family demand, transient renter base, plan for 1-2y turnover.
- Zoned schools: Lansberry El (math 35% / reading 33%, grade F, #2,149 of 4,322 statewide, top 50%, 570 students, 91% FRL); Trinity J H (math 21% / reading 25%, grade F, #1,327 of 1,662 statewide, top 81%, 280 students, 91% FRL); Trinity H S (math 22% / reading 32%, grade F, #1,204 of 1,632 statewide, top 75%, 350 students, 84% FRL) — zoned schools average 89% FRL vs 50% district-wide (38 pts higher); higher-poverty schools than district average — tighter screening recommended.
- Market conditions: 472 active listings in the ZIP; 1 units permitted in Trinity County in 2024 (0 in 5+ unit buildings).
Forward outlook
- In year one you build about $174 of equity ($691 loan paydown + $-517 appreciation (-0.5% local appreciation)).
- Trinity County population projected at -13% by 2050 — secular population decline; favor cash flow + early exit over multi-decade hold.
Negotiation context
- It's been on market 340 days — a 12% lower offer ($88k) is reasonable based on typical stale-listing flexibility.
- 4 sale attempts; this cycle's ask has dropped $25k (20%) from the opening price — seller is motivated, your offer sets the floor, not the list.
Risks & watch-outs
- Climate carrying-cost: severe wind risk, 93% chance of damaging wind over 30y; extreme-heat days projected 7→24/yr by 2055 (HVAC capex compounding) — expect insurance premiums to compound above CPI over the hold.
Questions for the listing agent
- What do current leases actually rent for vs. the listed asking? Can we see a recent rent roll and the last 12 months of T-12 income?
- It's been on market 340 days. Have you received any prior offers? Is the seller open to a 12% concession, seller financing, or rate buy-down credit?
- Built in 1975 — when were the roof, HVAC, electrical panel, plumbing, and water heater last replaced?
- What does the HOA fee cover, when was the last increase, and are there any pending special assessments or reserve-fund shortfalls?
- Why hasn't it sold? Are there any deal-killer items the seller is aware of (foundation, flood, title, zoning, code violations)?
- Is there a deadline driving the sale (1031 exchange, divorce, estate, relocation)? That informs how much negotiation room exists.
- Schools are F-rated, which usually means shorter tenancies and higher turnover. Who's the typical renter profile here, and what's been the actual vacancy rate?
- This sits on a lake — are riparian / water-frontage rights deeded with the parcel? Any dock permits, shoreline easements, or HOA water-use restrictions?
- What's the documented flood / surge / shoreline-erosion history here (FEMA AND non-FEMA — e.g., storm surge, creek backup, septic-field saturation)?
- Any water-quality or seasonal algae-bloom issues that affect tenant satisfaction or short-term-rental demand?
- What's the average days-on-market for RENTAL listings here right now (not sales)? A rising rental-DOM trend means longer vacancies and softer asking-rent achievability than the comps imply.
- What's the recent tenant-quality profile in this submarket — average credit score on applications, eviction rate, late-payment / NSF rate, and stable-employment percentage? A property-management company in the area should have these aggregated.
- How much new for-sale + rental construction is in the pipeline within 1–3 miles? Heavy new supply typically softens prices + rents 12–24 months out; constrained supply supports both.
Investment metrics
- 1% rule
- 1.16% ✓
- Cap rate
- 5.79%
- Cash-on-cash
- -1.80%
- DSCR
- 0.92
- GRM
- 7.2
CMA / ARV
- ARV (on-the-fly)
- $162,518
- Comps found
- 2
Show comp detail 2 sales within ~0.75 mi
| Address | Dist | Beds/Ba | Sqft | Sold | Price | $/sf | Match |
|---|---|---|---|---|---|---|---|
| 77 Westlake Rd | 0.03mi | 2/1.0 (-1) | 936 (+3%) | 13mo | $109,000 | $116 | 78 |
| 25 Westlake Rd | 0.19mi | 2/2.0 (-1) | 1,020 (+12%) | 10mo | $135,000 | $132 | 54 |
Match score weights: distance 35% · size 25% · config 20% · recency 20%. Top-matched comps best support the ARV.
Projected returns pro-forma
-0.52% appreciation · 3.0% rent growth · sell at horizon
- IRR
- -6.2%
- Equity multiple
- 0.72×
- Total profit
- $-7,820
- Equity at exit
- $26,479
- IRR
- 0.3%
- Equity multiple
- 1.03×
- Total profit
- $952
- Equity at exit
- $29,853
Cash invested: $28,000 (down + closing). Projections, not guarantees.
Landlord ↔ Tenant lean methodology
- Overall (STATE)
- 87 Strongly Landlord-Friendly
- State Texas
- 87 Strongly Landlord-Friendly · R+5
- County
- — inherits STATE
- City
- — inherits STATE
ZIP-level market 75862
- Home prices YoY
- -0.3%
- Active inventory
- 472
- Price-to-rent
- 7.2×
Monthly cashflow live
- Estimated rent
- $1,160 medium interval (Pro) →
- Mortgage (P&I)
- −$524
- Tax from tax record
- −$169 /mo · $2,028/yr
- Insurance
- −$42
- HOA
- −$223
- Vacancy / Maint / Mgmt
- −$244
- Net cashflow
- $-42
Break-even live
Sensitivity live
| Price | -10% $15 | -5% $-14 | +0% $-42 | +5% $-70 | +10% $-99 |
|---|---|---|---|---|---|
| Rent | -10% $-134 | -5% $-88 | +0% $-42 | +5% $4 | +10% $50 |
| Rate | -1.0pp $8 | -0.5pp $-17 | base $-42 | +0.5pp $-68 | +1.0pp $-94 |
UW: 25.0% down · 7.5% · 30yr · 1.5% tax · 5.0% vac · 8.0% maint · 8.0% mgmt
Financing live
Cash to close
- Down payment
- $25,000
- Closing costs
- $3,000
- Reserves months
- —
- Total cash needed
- —
Loan-product check · same deal, 3 products live
Conventional
25% down · 7.5% · 30yr
- Down + closing
- —
- Monthly P&I
- —
- Monthly cashflow
- —
- DSCR
- —
- Eligible?
- —
Personal DTI + credit; lowest rate.
DSCR
20% down · 8.5% · 30yr
- Down + closing
- —
- Monthly P&I
- —
- Monthly cashflow
- —
- DSCR
- —
- Eligible?
- —
No personal income docs; deal must DSCR.
Hard money
10% down · 12.0% · 12mo
- Down + closing
- —
- Monthly P&I
- —
- Monthly cashflow
- —
- DSCR
- —
- Eligible?
- —
Short-term bridge; refi at stabilization.
HOA detail
- Monthly dues
- $223 · $2,676/yr
- Likely covers
- poolsecurity
Listing history 31 events
-
2026-06-22days on market $99,999 Active 340 DOM
-
2026-06-19days on market $99,999 Active 338 DOM
-
2026-06-18days on market $99,999 Active 337 DOM
-
2026-06-17days on market $99,999 Active 336 DOM
-
2026-06-16days on market $99,999 Active 335 DOM
-
2026-06-15days on market $99,999 Active 334 DOM
-
2026-06-14days on market $99,999 Active 332 DOM
-
2026-06-13days on market $99,999 Active 331 DOM
-
2026-06-10days on market $99,999 Active 329 DOM
-
2026-06-09days on market $99,999 Active 328 DOM
-
2026-06-08days on market $99,999 Active 327 DOM
-
2026-06-07days on market $99,999 Active 326 DOM
-
2026-06-05days on market $99,999 Active 323 DOM
-
2026-06-02days on market $99,999 Active 321 DOM
-
2026-06-01days on market $99,999 Active 320 DOM
-
2026-05-31days on market $99,999 Active 319 DOM
-
2026-05-30days on market $99,999 Active 318 DOM
-
2026-05-16status Active
-
2026-05-15historical
-
2026-05-09status Active
-
2026-03-22status Pending
-
2026-03-08status Pending
-
2026-02-10price $99,999
-
2026-01-28price $110,000
-
2025-12-11price $118,999
-
2025-07-27price $119,999
-
2025-07-21status Active
-
2025-07-12status Pending
-
2025-05-18$125,000 Active
-
2025-04-28historical $125,000
-
2015-04-03soldstatus
ⓘ Source: listings_history table (triggers on properties + properties_extension) + one-shot
backfill from property_details.listing_events for pre-trigger history.
Tax reassessment forecast TX · Resets to sale price
- Current annual tax
- $2,028 · $169/mo
- Projected year-2 tax
- $2,028 · $169/mo
- Expected delta
- $0/yr ($0/mo · 0.0%)
ⓘ Screening estimate from a state-policy table — verify with the county assessor before closing.
Climate risk First Street
- Flood 1/10 Low 0% chance over 30 yrs
- Wildfire 4/10 Moderate
- Heat 8/10 Severe 7 d/yr ≥111°F today · 24 d/yr by 30 yrs out
- Wind 8/10 Severe 93% chance of damaging wind over 30 yrs
- Air quality 1/10 Low 0 unhealthy d/yr today · 0 by 30 yrs out
Nearby sold comps map
Loading sold comps map…
Walkable amenities ~0.75 mi
Loading nearby amenities…
Taxation est. · year 1
- Rental income
- $13,915
- − Mortgage interest
- −$5,601
- − Property taxes
- −$2,028
- − Insurance
- −$500
- − Repairs & maintenance
- −$1,113
- − Management
- −$1,113
- − HOA
- −$2,676
- − Depreciation
- −$2,909
- Taxable loss
- −$2,025
- Est. tax savings @ 24.0%
- +$486
- After-tax cash flow
- $-17/yr
For passive investors: Depreciation is non-cash, so a rental often shows a tax loss while cash-flowing — sheltering income. Rental losses are passive: they offset passive income freely, and up to $25,000/yr can offset ordinary (W-2) income if you actively participate and your MAGI is under $100k (phasing out to $0 by $150k); unused losses carry forward. On sale, claimed depreciation is recaptured at up to 25%, and gains may owe capital-gains tax (a 1031 exchange can defer both). Figures are a year-1 estimate at your 24.0% rate — not tax advice; consult a CPA.
Schools (NCES district)
- District
- Trinity ISD
- NCES district ID
- 4843200
- Math proficiency
- 27% ▼ -2.00%
- Reading proficiency
- 29% ▲ 1.00%
- Median HH income
- $37,104
- Composite
- 23.31/100
- National rank
- #7919
- State rank
- #682 of 826 in TX
Livability — Westwood Shores
- Score
- 62/100
- State rank
- #914
- US rank
- #16347
Category grades
Schools grade is shown separately in the Schools card above.
Census & demographics
- Census place
- Westwood Shores, TX
- Population (ZIP)
- 10,030
Population outlook (Trinity County) Hauer SSP2
- Today (2025)
- 13,746 people
- By 2030
- 13,333 · -3.0%
- By 2040
- 12,542 · -8.8%
- By 2050
- 11,942 · -13.1%
- By 2075
- 10,871 · -20.9%
- By 2100
- 9,784 · -28.8%
Race, ethnicity, and origin ACS 2023
- Neighborhood character
- Predominantly White (74%)
- Race & ethnicity
- White 74% Hispanic / Latino 12% Black 10% Two or more races 7%
- Hispanic origin (detail)
- Mexican 11%
- Common ancestry
- Lithuanian 3% Serbian 2% Slovak 2%
- Foreign-born
- 4% · Canada
- Languages at home
- 89% English-only · Spanish 9% French/Haitian/Cajun 2%
Political lean MEDSL · Trinity
- 2024 margin
- Solid R (+67.0) · D 16.2% · R 83.2%
- 2008→2024 swing
- -31.3pp toward R · 2008: -35.7pp · 2024: -67.0pp
- All cycles
- 2024: R+67.0 2020: R+61.3 2016: R+59.9 2012: R+46.9 2008: R+35.7
Not yet ingested
- Civics
- —
Market trends
- HPI YoY
- ▼ -0.52%
- Current HPI
- 174.6638
- Rent YoY
- —
- Metro
- —
- State GDP YoY
- ▲ 3.95%
- F500 in state
- 110
Industry mix (Fortune 500 HQ in TX)
| Industry | F500 HQs | Revenue |
|---|---|---|
| Energy | 16 | $1,198B |
|
||
| Technology | 5 | $198B |
|
||
| Engineering / Construction | 4 | $72B |
|
||
| Energy Services | 3 | $60B |
|
||
| Utilities | 3 | $41B |
|
||
| Healthcare | 2 | $330B |
|
||
Price history
-20.0% since first listed14 events — show timeline
- 2026-05-16 Relisted — HARMLS
- 2026-05-15 Listing Removed — HARMLS
- 2026-05-09 Relisted — HARMLS
- 2026-03-22 Pending — HARMLS
- 2026-03-08 Pending — HARMLS
- 2026-02-10 Price Changed $99,999 HARMLS
- 2026-01-28 Price Changed $110,000 HARMLS
- 2025-12-11 Price Changed $118,999 HARMLS
- 2025-07-27 Price Changed $119,999 HARMLS
- 2025-07-21 Relisted — HARMLS
- 2025-07-12 Pending — HARMLS
- 2025-05-18 Listed $125,000 HARMLS
- 2025-04-28 Coming Soon $125,000 HARMLS
- 2015-04-03 Sold (Public Records) — Public Records
Property tax history
+4.4%/yrLatest (2025): $2,028 · +14.4% YoY. Source: county tax records.
Cash-flow waterfall
monthlySold comps — $/sqft
last 12 mo · ≤1 miLoading sold comps…