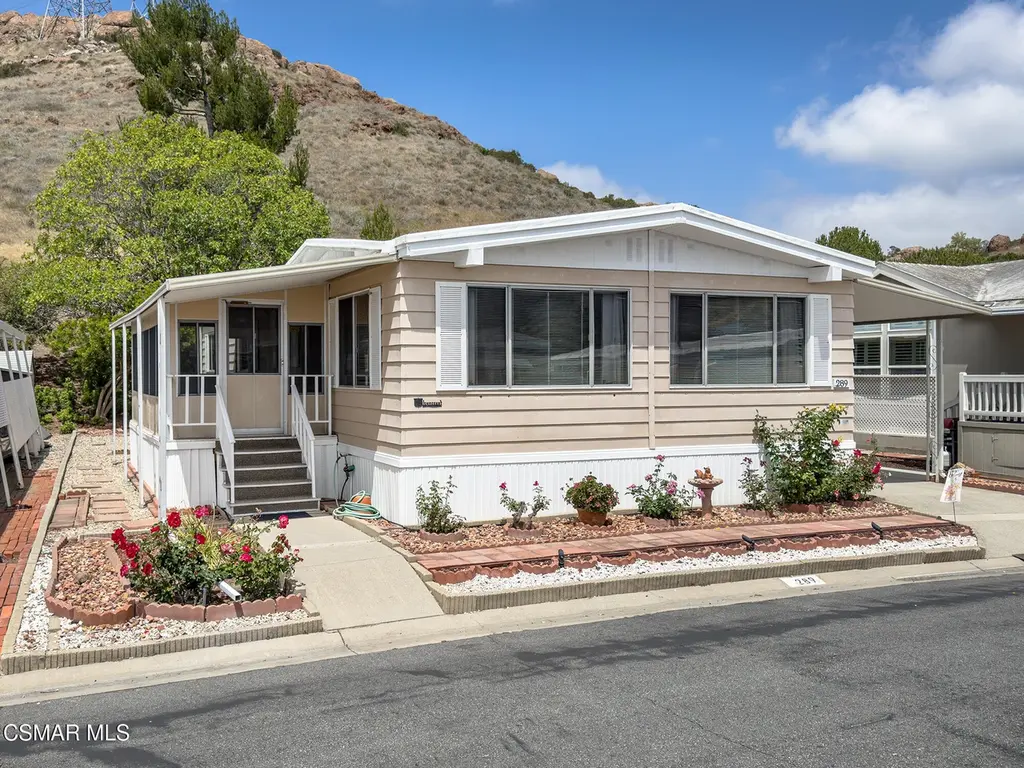
289 El Cielo · Thousand Oaks, CA
Flood risk 1/10 · Minimal
- FEMA flood zone
- X (unshaded)
- Chance of flooding over 30 yrs
- 0.0%
- Est. flood insurance / yr
- $507 – $1,088
Fire risk 7/10 · Major
- Est. fire insurance / yr
- $659 – $1,223
Heat risk 3/10 · Minor
- Hot days now (above 93°F)
- 7 days/yr
- Hot days in 30 yrs
- 18 days/yr
Wind risk 1/10 · Minimal
- Chance of severe wind over 30 yrs
- —
Air-quality risk 3/10 · Minor
- Unhealthy air days now
- 4 days/yr
- Unhealthy air days in 30 yrs
- 4 days/yr
Risk factors via First Street. Map © Google.
Why this score? — see what drove the C+ grade
The composite is a weighted blend of 9 inputs, each scored 0–100. Each bar is that input's sub-score; the figure is the points it added to the 100-point composite (weight × sub-score).
- Cash flow +25.9/30.0
- DSCR +8.7/10.0
- 1% rule +6.9/10.0
- ARV discount +6.9/15.0
- Schools +6.0/10.0
- Condition / age +3.8/5.0
- Livability +3.5/5.0
- Rent growth +2.6/5.0
- Appreciation +0.0/10.0
$310,000
🖨 Deal sheet (PDF) 📄 Offer letter ✓ Due diligence
Listing remarks
Welcome to this move-in ready 2-bedroom, 2-bath home offering 1,248 sq. ft. of comfortable living space in a prime location backing to open space with beautiful mountain views. Low land lease of just $850 per month! The spacious living room is filled with natural light and scenic views, while the dining area features a built-in hutch for added storage and charm. The kitchen includes a new stainless sink and faucet, dishwasher, gas range, lighted range hood, and refrigerator. The large private primary suite offers a wall-to-wall closet, lighted mirrored dressing area, and an ensuite bath with dual vanity, new faucets, and tub. The guest bedroom is generously sized with a large closet, and th
Key facts
- Built in hutch
- New stainless sink
- Wall to wall closet
Tags
Property features AI
Finance
- Other: Disclosures include pet restrictions, rent control, and other disclosures; Washer & Dryer and Fridge included; Possession at close of escrow
- Financial info: Accepts conventional financing and cash
- HOA & community: Located in a leased lot within Vallecito Mobile Home Park; Association pet rules apply
Exterior
- Parking: 2-car carport (not attached)
- Security: Carbon monoxide detector(s); Gated community; Community security features
- Utilities: Property is in a community with utilities (land lease applies)
- Home design: Single‑level entry at ground level with steps; Mobile home (Silvercrest model, 24' x 52'); Located in a senior community
- Construction: Built in 1972; Metal/other roof; Raised foundation with pier jacks
- Exterior features: Arizona room (covered patio/porch); Private heated and filtered pool; Private spa; Vertical blinds; Property has a view; Gated community
Interior
- Kitchen: Range hood; Refrigerator included
- Bedrooms: 2 bedrooms
- Flooring: Carpet; Vinyl tile
- Bathrooms: 2 full bathrooms
- Heating & cooling: Heating present
- Interior features: Paneled walls; Arizona room (covered porch/patio); Vertical blinds
- Laundry & utility: Washer and dryer included; Laundry in an individual room inside the home
Neighborhood map
What this means for you Summary
Snapshot
- This is a 2-bed/2.0-bath manufactured listed at $310k. Condition is rated good.
Deal economics
- At list price, monthly cash flow is $766 ($9k/yr) — positive.
- The deal already cash-flows at list — no discount required.
- Meets the 1% rule at list price ($4k rent vs $310k).
- Recommended offer: $301k (3.0% below list) — sets the bar for market timing.
- Cap rate 9.3% vs local median 2.8% in Thousand Oaks — top-decile yield for the area; either an underpriced asset or a hidden risk that comps aren't pricing in. Stress-test before assuming the spread holds.
Location & tenants
- Location reads 70/100 on livability (#226 in CA) — a middle-class / working-renter tenant base. Strengths: crime A+, commute A+, employment A+; Watch: cost of living F, health & safety F.
- Conejo Valley Unified (urban): math 57% / reading 72% proficiency, ranked #59 of 517 in CA (top 11%) — acceptable for families but not a draw, mixed tenant base, ~2y average lease; only 19% free/reduced lunch — higher-income household profile.
- Zoned schools: Cypress Elementary (292 students, 13% FRL); Sequoia Middle (849 students, 31% FRL); Newbury Park High (math 62% / reading 77%, grade B, #121 of 1,170 statewide, top 11%, 2,189 students, 18% FRL) — zoned schools at 21% FRL track the district average.
- Market conditions: Rents flat; 145 active listings in the ZIP; 4 comparable units currently listed for rent nearby; rentals lingering (median 46d on market — plan ~5-8 weeks vacancy on turnover, expect pricing pressure); 50% of comp listings sitting > 30 days — soft ceiling on asking rent; high-income renter base; 1,759 units permitted in Ventura County in 2024 (1,196 in 5+ unit buildings).
Forward outlook
- Local home prices are declining (-3.0%/yr); year-one equity from $2k of loan paydown is wiped out by about $9k of value loss. Plan a longer hold.
- Ventura County population projected at +4% by 2050 — modest demand growth; plan on rents tracking national, not racing it.
Negotiation context
- It's been on market 33 days — a 3% lower offer ($301k) is reasonable based on typical stale-listing flexibility.
Risks & watch-outs
- Climate carrying-cost: major wildfire risk — expect insurance premiums to compound above CPI over the hold.
Questions for the listing agent
- It's been on market 33 days. Have you received any prior offers? Is the seller open to a 3% concession, seller financing, or rate buy-down credit?
- Built in 1972 — when were the roof, HVAC, electrical panel, plumbing, and water heater last replaced?
- Is there a deadline driving the sale (1031 exchange, divorce, estate, relocation)? That informs how much negotiation room exists.
- Schools are B-rated — typically a magnet for longer-tenancy family renters. What's the average tenant stay here, and is there a school-zone premium baked into asking?
- What's the average days-on-market for RENTAL listings here right now (not sales)? A rising rental-DOM trend means longer vacancies and softer asking-rent achievability than the comps imply.
- What's the recent tenant-quality profile in this submarket — average credit score on applications, eviction rate, late-payment / NSF rate, and stable-employment percentage? A property-management company in the area should have these aggregated.
- How much new for-sale + rental construction is in the pipeline within 1–3 miles? Heavy new supply typically softens prices + rents 12–24 months out; constrained supply supports both.
Investment metrics
- 1% rule
- 1.19% ✓
- Cap rate
- 9.26%
- Cash-on-cash
- 10.60%
- DSCR
- 1.47
- GRM
- 7.0
CMA / ARV
- ARV (on-the-fly)
- $305,760
- Comps found
- 11
Show comp detail 11 sales within ~0.75 mi
| Address | Dist | Beds/Ba | Sqft | Sold | Price | $/sf | Match |
|---|---|---|---|---|---|---|---|
| 3 La Lomita #3 | 0.18mi | 2/2.0 | 1,200 (-4%) | 3mo | $255,000 | $213 | 82 |
| 272 Monte Vis | 0.14mi | 2/2.0 | 1,348 (+8%) | 3mo | $372,000 | $276 | 78 |
| 238 Vista Conejo | 0.03mi | 3/2.0 (+1) | 1,344 (+8%) | 10mo | $334,000 | $249 | 73 |
| 46 La Encina | 0.22mi | 2/2.0 | 1,344 (+8%) | 7mo | $190,000 | $141 | 71 |
| 24 La Encina | 0.20mi | 3/2.0 (+1) | 1,344 (+8%) | 2mo | $330,000 | $246 | 71 |
| 188 La Reina #188 | 0.07mi | 3/2.0 (+1) | 1,344 (+8%) | 10mo | $267,000 | $199 | 70 |
| 20 La Encina | 0.19mi | 2/2.0 | 1,152 (-8%) | 16mo | $330,000 | $286 | 65 |
| 246 El Cielo | 0.05mi | 2/2.0 | 1,344 (+8%) | 23mo | $350,000 | $260 | 65 |
| 252 El Gallardo | 0.18mi | 2/2.0 | 1,428 (+14%) | 3mo | $350,000 | $245 | 65 |
| 250 El Gallardo | 0.19mi | 2/2.0 | 1,368 (+10%) | 14mo | $292,500 | $214 | 64 |
| 110 La Fortuna #110 | 0.31mi | 2/2.0 | 1,404 (+12%) | 10mo | $260,000 | $185 | 57 |
Match score weights: distance 35% · size 25% · config 20% · recency 20%. Top-matched comps best support the ARV.
Projected returns pro-forma
-3.0% appreciation · 0.3% rent growth · sell at horizon
- IRR
- -3.5%
- Equity multiple
- 0.87×
- Total profit
- $-11,104
- Equity at exit
- $46,222
- IRR
- 2.8%
- Equity multiple
- 1.18×
- Total profit
- $15,547
- Equity at exit
- $26,803
Cash invested: $86,800 (down + closing). Projections, not guarantees.
Landlord ↔ Tenant lean methodology
- Overall (STATE)
- 18 Strongly Tenant-Friendly
- State California
- 18 Strongly Tenant-Friendly · D+13
- County
- — inherits STATE
- City
- — inherits STATE
ZIP-level market 91320
- Rents YoY
- 0.3%
- Active inventory
- 145
- Price-to-rent
- 7.0×
Monthly cashflow live
- Estimated rent
- $3,682 medium interval (Pro) →
- Mortgage (P&I)
- −$1,626
- Tax est. 1.5%
- −$388 /mo · $4,650/yr
- Insurance
- −$129
- HOA
- −$0
- Vacancy / Maint / Mgmt
- −$773
- Net cashflow
- $766
Break-even live
Sensitivity live
| Price | -10% $981 | -5% $874 | +0% $766 | +5% $659 | +10% $552 |
|---|---|---|---|---|---|
| Rent | -10% $476 | -5% $621 | +0% $766 | +5% $912 | +10% $1,057 |
| Rate | -1.0pp $923 | -0.5pp $845 | base $766 | +0.5pp $686 | +1.0pp $604 |
UW: 25.0% down · 7.5% · 30yr · 1.5% tax · 5.0% vac · 8.0% maint · 8.0% mgmt
Financing live
Cash to close
- Down payment
- $77,500
- Closing costs
- $9,300
- Reserves months
- —
- Total cash needed
- —
Loan-product check · same deal, 3 products live
Conventional
25% down · 7.5% · 30yr
- Down + closing
- —
- Monthly P&I
- —
- Monthly cashflow
- —
- DSCR
- —
- Eligible?
- —
Personal DTI + credit; lowest rate.
DSCR
20% down · 8.5% · 30yr
- Down + closing
- —
- Monthly P&I
- —
- Monthly cashflow
- —
- DSCR
- —
- Eligible?
- —
No personal income docs; deal must DSCR.
Hard money
10% down · 12.0% · 12mo
- Down + closing
- —
- Monthly P&I
- —
- Monthly cashflow
- —
- DSCR
- —
- Eligible?
- —
Short-term bridge; refi at stabilization.
Rent comps 4 comps
| Address | Beds | Baths | Sqft | Rent | $/sqft | DOM | Units | Dist |
|---|---|---|---|---|---|---|---|---|
| 1194 Vista Canyon Ln Newbury Park, CA | 3.0 | 3.0 | 1384 | $3,800 | $2.75 | 45d | 1 | 0.20mi |
| 1194 Vista Conyon #17 Newbury Park, CA | 3.0 | 2.5 | 1384 | $3,800 | $2.75 | 25d | 1 | 0.20mi |
| 3444 Melvin Ct Newbury Park, CA | 3.0 | 2.0 | 1308 | $3,600 | $2.75 | 12d | 1 | 0.98mi |
| 198 San Vincente Cir Newbury Park, CA | 2.0 | 2.0 | 1334 | $3,500 | $2.62 | 45d | 1 | 1.13mi |
Listing history 17 events
-
2026-06-21days on market $310,000 Active 33 DOM
-
2026-06-18days on market $310,000 Active 30 DOM
-
2026-06-17days on market $310,000 Active 29 DOM
-
2026-06-16days on market $310,000 Active 28 DOM
-
2026-06-15days on market $310,000 Active 27 DOM
-
2026-06-13days on market $310,000 Active 25 DOM
-
2026-06-13days on market $310,000 Active 24 DOM
-
2026-06-10days on market $310,000 Active 22 DOM
-
2026-06-09days on market $310,000 Active 21 DOM
-
2026-06-08days on market $310,000 Active 20 DOM
-
2026-06-07days on market $310,000 Active 19 DOM
-
2026-06-05days on market $310,000 Active 16 DOM
-
2026-06-03days on market $310,000 Active 15 DOM
-
2026-06-02days on market $310,000 Active 14 DOM
-
2026-06-01days on market $310,000 Active 13 DOM
-
2026-05-31days on market $310,000 Active 12 DOM
-
2026-05-19$310,000 Active
ⓘ Source: listings_history table (triggers on properties + properties_extension) + one-shot
backfill from property_details.listing_events for pre-trigger history.
Climate risk First Street
- Flood 1/10 Low FEMA zone X (unshaded) · 0% chance over 30 yrs
- Wildfire 7/10 Severe
- Heat 3/10 Moderate 7 d/yr ≥93°F today · 18 d/yr by 30 yrs out
- Wind 1/10 Low
- Air quality 3/10 Moderate 4 unhealthy d/yr today · 4 by 30 yrs out
Nearby sold comps map
Loading sold comps map…
Walkable amenities ~0.75 mi
Loading nearby amenities…
Taxation est. · year 1
- Rental income
- $44,184
- − Mortgage interest
- −$17,365
- − Property taxes
- −$4,650
- − Insurance
- −$1,550
- − Repairs & maintenance
- −$3,535
- − Management
- −$3,535
- − Depreciation
- −$9,018
- Taxable income
- $4,531
- Est. tax owed @ 24.0%
- −$1,088
- After-tax cash flow
- $8,110/yr
For passive investors: Depreciation is non-cash, so a rental often shows a tax loss while cash-flowing — sheltering income. Rental losses are passive: they offset passive income freely, and up to $25,000/yr can offset ordinary (W-2) income if you actively participate and your MAGI is under $100k (phasing out to $0 by $150k); unused losses carry forward. On sale, claimed depreciation is recaptured at up to 25%, and gains may owe capital-gains tax (a 1031 exchange can defer both). Figures are a year-1 estimate at your 24.0% rate — not tax advice; consult a CPA.
Condition & rehab AI · 30 photos
This move-in ready manufactured home offers 1,248 sq. ft. of comfortable living space with good condition and minimal repairs needed.
Value-add opportunities
- Resale Paint exterior siding — Enhances curb appeal and value.
- Resale Replace carpet — Fresh carpet improves comfort and value.
- Resale Update kitchen appliances — Modern appliances increase appeal and value.
- Resale Update bathroom fixtures — Modern fixtures enhance bathroom appeal and value.
- Resale Landscaping improvements — Enhances curb appeal and value.
- Rental HVAC system inspection — Ensures comfort and reduces maintenance costs.
- Rental Replace carpet — Fresh carpet improves comfort and value.
Renovation cost estimate screening
Value-add ROI direction
- Resale Paint exterior siding — Enhances curb appeal and value. ↑
- Resale Replace carpet — Fresh carpet improves comfort and value. ↑
- Resale Update kitchen appliances — Modern appliances increase appeal and value. ↑
- Resale Update bathroom fixtures — Modern fixtures enhance bathroom appeal and value. ↑
- Resale Landscaping improvements — Enhances curb appeal and value. ↑
- Rental HVAC system inspection — Ensures comfort and reduces maintenance costs. ↑
- Rental Replace carpet — Fresh carpet improves comfort and value. ↑
ⓘ Cost ranges are severity-bucket heuristics (US national rule-of-thumb). Get contractor quotes + a written scope before underwriting a rehab budget.
Schools (NCES district)
- District
- Conejo Valley Unified
- NCES district ID
- 0609640
- Math proficiency
- 57% ▬ 0.00%
- Reading proficiency
- 72% ▲ 6.00%
- Median HH income
- $100,413
- Composite
- 59.57/100
- National rank
- #914
- State rank
- #59 of 517 in CA
Livability — Thousand Oaks
- Score
- 70/100
- State rank
- #226
- US rank
- #7364
Category grades
Schools grade is shown separately in the Schools card above.
Census & demographics
- Census place
- Thousand Oaks, CA
- County
- Ventura County · 829,955 people
- City population
- 121,704
- Metro
- Oxnard-Thousand Oaks-Ventura, CA
- Population (ZIP)
- 43,472
- Household income
- $148,991
- Rent vs Own
- Severe rent burden
- 756.0
Population outlook (Ventura County) Hauer SSP2
- Today (2025)
- 895,754 people
- By 2030
- 912,134 · +1.8%
- By 2040
- 931,454 · +4.0%
- By 2050
- 934,609 · +4.3%
- By 2075
- 924,899 · +3.3%
- By 2100
- 864,712 · -3.5%
Race, ethnicity, and origin ACS 2023
- Neighborhood character
- Diverse neighborhood (Simpson 0.56)
- Race & ethnicity
- White 63% Hispanic / Latino 19% Two or more races 16% Asian 11% Black 2%
- Hispanic origin (detail)
- Mexican 13%
- Common ancestry
- Italian 4% Romanian 3% Lithuanian 3%
- Foreign-born
- 19% · Canada, China, Vietnam
- Languages at home
- 76% English-only · Spanish 12% Other Indo-European 4% Chinese 2%
Political lean MEDSL · Ventura
- 2024 margin
- D (+15.1) · D 56.1% · R 41.0% · Other 2.9%
- 2008→2024 swing
- +2.8pp toward D · 2008: 12.3pp · 2024: 15.1pp
- All cycles
- 2024: D+15.1 2020: D+21.1 2016: D+16.8 2012: D+5.3 2008: D+12.3
Not yet ingested
- Civics
- —
Market trends
- HPI YoY
- ▼ -917.39%
- Current HPI
- 283.6467
- Rent YoY
- ▲ 0.30%
- Metro
- Oxnard-Thousand Oaks-Ventura, CA
- State GDP YoY
- ▲ 3.21%
- F500 in state
- 116
Industry mix (Fortune 500 HQ in CA)
| Industry | F500 HQs | Revenue |
|---|---|---|
| Technology | 27 | $1,492B |
|
||
| Financial Services | 3 | $174B |
|
||
| Retail | 3 | $44B |
|
||
| Insurance | 3 | $26B |
|
||
| Media / Entertainment | 2 | $115B |
|
||
| Pharmaceuticals / Biotech | 2 | $62B |
|
||
Price history
1 event — show timeline
- 2026-05-19 Listed $310,000 CSMAR
Cash-flow waterfall
monthlySold comps — $/sqft
last 12 mo · ≤1 miLoading sold comps…