 Fourplex
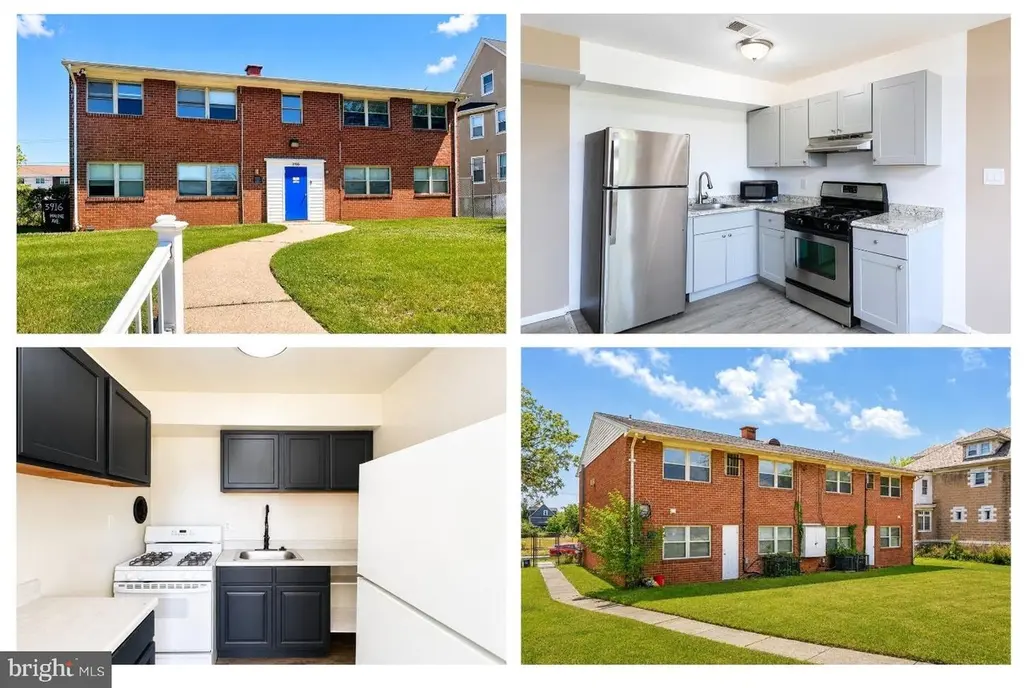
3916 Maine Ave · Baltimore, MD
Flood risk 1/10 · Minimal
- FEMA flood zone
- X (unshaded)
- Chance of flooding over 30 yrs
- 0.0%
- Est. flood insurance / yr
- $507 – $1,088
Fire risk 1/10 · Minimal
- Est. fire insurance / yr
- $755 – $1,403
Heat risk 7/10 · Major
- Hot days now (above 103°F)
- 7 days/yr
- Hot days in 30 yrs
- 15 days/yr
Wind risk 5/10 · Moderate
- Chance of severe wind over 30 yrs
- 23.0%
Air-quality risk 3/10 · Minor
- Unhealthy air days now
- 3 days/yr
- Unhealthy air days in 30 yrs
- 4 days/yr
Risk factors via First Street. Map © Google.
Why this score? — see what drove the B- grade
The composite is a weighted blend of 9 inputs, each scored 0–100. Each bar is that input's sub-score; the figure is the points it added to the 100-point composite (weight × sub-score).
- Cash flow +25.5/30.0
- Appreciation +9.8/10.0
- DSCR +8.4/10.0
- ARV discount +7.5/15.0
- 1% rule +5.9/10.0
- Rent growth +3.8/5.0
- Livability +3.8/5.0
- Condition / age +2.5/5.0
- Schools +1.0/10.0
$450,000
🖨 Deal sheet (PDF) 📄 Offer letter ✓ Due diligence
Multi-family units
County records classify this as Multi-Family (5+ Unit). Listing-text estimate: 4 units. estimate disagrees with records
5+ unit building — per-unit beds/baths from public records are typically unavailable; the breakdown below (if shown) is an estimate from the listing text.
Listing remarks
House hacking opportunity! Whether you're an investor seeking strong cash flow or an owner-occupant looking to offset your mortgage with rental income, this updated 4-unit property, with 1 leased unit and 3 move-in ready units, offers flexibility and an opportunity to earn an estimated $56,400 in annual rental income! Located on a well-maintained block just a stone's throw from the Baltimore County line, 3916 Maine Ave is a standout with its lush green yard and clean exterior presentation. The interior continues to impress. THE OCCUPIED UNIT : The tenant pays $1,100/month plus a $106 utility reimbursement, providing immediate income from day one. THE MOVE-IN READY UNITS : The remaining thre
Key facts
- Move in ready units
- Lush green yard
- Modern lvp flooring
Tags
Property features AI
Finance
- Financial info: Four total units; Four two-bedroom units; One unit currently leased; Three vacant units; Ground rent paid annually
Exterior
- Parking: On-street parking; Paved public parking
- Utilities: Public water; Public sewer; Natural gas hot water; Natural gas heating; Electric for cooling
- Home design: Detached structure; Brick front; Concrete construction; Excellent condition; Fee simple ownership
- Construction: Other foundation; Above-grade and below-grade structures
- Exterior features: Gutter system; Sidewalks; Exterior lighting; Street lights; Front yard; Rear yard; Side yard(s); Property located mid-block; In city limits
Interior
- Kitchen: Disposal; Microwave; Gas oven/range; Range hood; Refrigerator; Stainless steel appliances; Stove; Water heater
- Bedrooms: At least one entry-level bedroom
- Flooring: Luxury vinyl plank
- Heating & cooling: Forced air heating (natural gas); Central air conditioning (electric)
- Interior features: Open floor plan; Combination dining/living area; Combination kitchen/dining area; Combination kitchen/living area; Dining area; Family room off kitchen; Upgraded countertops; Tub with shower; Six-panel doors
Neighborhood map
What this means for you Summary
Snapshot
- This is a 4 × 2-bed/1-bath units multifamily listed at $450k.
Deal economics
- At list price, monthly cash flow is $1k ($13k/yr) — positive. Per door: $262/mo.
- The deal already cash-flows at list — no discount required.
- Meets the 1% rule at list price ($5k rent vs $450k).
- Cap rate 9.1% vs local median 6.0% in Baltimore — top-decile yield for the area; either an underpriced asset or a hidden risk that comps aren't pricing in. Stress-test before assuming the spread holds.
Location & tenants
- Location reads 76/100 on livability (#90 in MD, #3,396 nationally) — a middle-class / working-renter tenant base. Strengths: amenities A+, commute A+, housing A+; Watch: crime F.
- Baltimore City Public Schools (urban): math 7% / reading 16% proficiency, ranked #24 of 24 in MD (top 100%) — low school quality limits family demand, transient renter base, plan for 1-2y turnover; 79% free/reduced lunch — lower-income household profile, screen leases tightly.
- Zoned schools: Elmer A. Henderson: A Johns Hopkins Partnership (math 2% / reading 16%, grade F, #650 of 860 statewide, top 77%, 642 students, 80% FRL); Vanguard Collegiate Middle (math 3% / reading 15%, grade F, #212 of 225 statewide, top 95%, 343 students, 84% FRL); Baltimore Polytechnic Institute (math 71% / reading 84%, grade A-, #22 of 222 statewide, top 10%, 1,555 students, 43% FRL).
- Zoned-school proficiency averages 32% at this address vs 12% district-wide (+20 pts) — the actual schools serving this property are materially stronger than the Baltimore City Public Schools average implies; a family-tenant draw the district grade alone would hide.
- Market conditions: Rents rising fast (+5.2%/yr); 131 active listings in the ZIP; 1,273 units permitted in Baltimore city in 2024 (1,104 in 5+ unit buildings).
- At $4,921/mo this rent would consume 88% of the median local household income ($67k/yr) (locally 2139% of renters already pay >50% of income on rent) — very limited rent-growth headroom before tenants either downsize or default.
Forward outlook
- In year one you build about $46k of equity ($3k loan paydown + $43k appreciation (9.5% local appreciation)).
- Baltimore County population projected to shrink 4% by 2050 — rents likely to lag national; underwrite the cash flow, not the appreciation.
- At projected returns (9.5% appreciation + 5.2% rent growth), your $126k cash investment doubles in ~3 years — after that, you're playing with house money.
- By year 2, paydown + projected appreciation supports a ~$74k cash-out refi (75% LTV) — recoverable capital for the next deal without selling this one.
Negotiation context
- Only 13 days on market — expect competitive offers; lowballing is unlikely to land.
Risks & watch-outs
- Climate carrying-cost: moderate wind risk, 23% chance of damaging wind over 30y; extreme-heat days projected 7→15/yr by 2055 (HVAC capex compounding) — expect insurance premiums to compound above CPI over the hold.
Questions for the listing agent
- Can we see the unit-by-unit rent roll, current vacancy, and any below-market leases? What's the average tenancy length?
- What capital expenditures (roof, boiler, parking lot, exteriors) have been made in the last 5 years, and what's planned in the next 2?
- Built in 1966 — when were the roof, HVAC, electrical panel, plumbing, and water heater last replaced?
- Is there a deadline driving the sale (1031 exchange, divorce, estate, relocation)? That informs how much negotiation room exists.
- Schools are D-rated, which usually means shorter tenancies and higher turnover. Who's the typical renter profile here, and what's been the actual vacancy rate?
- Crime grade is F in this area — have there been break-ins, vandalism, or insurance claims at this property in the last 3 years? What carrier currently insures it and at what premium?
- What's the average days-on-market for RENTAL listings here right now (not sales)? A rising rental-DOM trend means longer vacancies and softer asking-rent achievability than the comps imply.
- What's the recent tenant-quality profile in this submarket — average credit score on applications, eviction rate, late-payment / NSF rate, and stable-employment percentage? A property-management company in the area should have these aggregated.
- How much new apartment / multifamily construction is in the pipeline within 1–3 miles? Heavy new supply (>2% of stock underway) typically softens rents 12–24 months out; light construction supports rent growth.
Investment metrics
- 1% rule
- 1.09% ✓
- Cap rate
- 9.08%
- Cash-on-cash
- 9.97%
- DSCR
- 1.44
- GRM
- 7.6
CMA / ARV
No comps found within radius.
Show comp detail 2 sales within ~0.75 mi
| Address | Dist | Beds/Ba | Sqft | Sold | Price | $/sf | Match |
|---|---|---|---|---|---|---|---|
| 3717 Boarman Ave | 0.65mi | 8/— | 4,096 | 11mo | $478,500 | $117 | 48 |
| 3711 Egerton Rd | 0.24mi | 9/3.0 (+1) | 3,264 | 20mo | $415,000 | $127 | 43 |
Match score weights: distance 35% · size 25% · config 20% · recency 20%. Top-matched comps best support the ARV.
Projected returns pro-forma
9.5% appreciation · 5.23% rent growth · sell at horizon
- IRR
- 31.6%
- Equity multiple
- 3.44×
- Total profit
- $307,596
- Equity at exit
- $389,074
- IRR
- 28.2%
- Equity multiple
- 7.94×
- Total profit
- $874,607
- Equity at exit
- $822,269
Cash invested: $126,000 (down + closing). Projections, not guarantees.
Landlord ↔ Tenant lean methodology
- Overall (CITY)
- 12 Strongly Tenant-Friendly
- State Maryland
- 27 Tenant-Leaning · D+14
- County
- — inherits STATE
- City Baltimore
- 12 Strongly Tenant-Friendly · D+58
ZIP-level market 21207
- Home prices YoY
- 1.1%
- Rents YoY
- 5.2%
- Active inventory
- 131
- Price-to-rent
- 30.5×
Monthly cashflow live
- Estimated rent
- $4,921 high interval (Pro) →
- Mortgage (P&I)
- −$2,360
- Tax from tax record
- −$294 /mo · $3,523/yr
- Insurance
- −$188
- HOA
- −$0
- Vacancy / Maint / Mgmt
- −$1,033
- Net cashflow
- $1,047
Break-even live
Sensitivity live
| Price | -10% $1,301 | -5% $1,174 | +0% $1,047 | +5% $919 | +10% $792 |
|---|---|---|---|---|---|
| Rent | -10% $658 | -5% $852 | +0% $1,047 | +5% $1,241 | +10% $1,435 |
| Rate | -1.0pp $1,273 | -0.5pp $1,161 | base $1,047 | +0.5pp $930 | +1.0pp $811 |
4-unit breakdown (identical units grouped — click to expand)
| Units | Beds | Baths | Est. rent |
|---|---|---|---|
| 4× units | 2 | 1 | $4,920 |
| #1 | 2 | 1 | $1,230 |
| #2 | 2 | 1 | $1,230 |
| #3 | 2 | 1 | $1,230 |
| #4 | 2 | 1 | $1,230 |
| Total (4 units) | $4,921 | ||
UW: 25.0% down · 7.5% · 30yr · 1.5% tax · 5.0% vac · 8.0% maint · 8.0% mgmt
Financing live
Cash to close
- Down payment
- $112,500
- Closing costs
- $13,500
- Reserves months
- —
- Total cash needed
- —
Loan-product check · same deal, 3 products live
Conventional
25% down · 7.5% · 30yr
- Down + closing
- —
- Monthly P&I
- —
- Monthly cashflow
- —
- DSCR
- —
- Eligible?
- —
Personal DTI + credit; lowest rate.
DSCR
20% down · 8.5% · 30yr
- Down + closing
- —
- Monthly P&I
- —
- Monthly cashflow
- —
- DSCR
- —
- Eligible?
- —
No personal income docs; deal must DSCR.
Hard money
10% down · 12.0% · 12mo
- Down + closing
- —
- Monthly P&I
- —
- Monthly cashflow
- —
- DSCR
- —
- Eligible?
- —
Short-term bridge; refi at stabilization.
Listing history 9 events
-
2026-06-13statusdays on market $450,000 Pending 13 DOM
-
2026-06-09days on market $450,000 Active 11 DOM
-
2026-06-08days on market $450,000 Active 10 DOM
-
2026-06-07days on market $450,000 Active 9 DOM
-
2026-06-04days on market $450,000 Active 6 DOM
-
2026-06-03days on market $450,000 Active 5 DOM
-
2026-06-02days on market $450,000 Active 4 DOM
-
2026-06-01days on market $450,000 Active 3 DOM
-
2026-05-31days on market $450,000 Active 2 DOM
ⓘ Source: listings_history table (triggers on properties + properties_extension) + one-shot
backfill from property_details.listing_events for pre-trigger history.
Tax reassessment forecast MD · Partial reset (capped growth)
- Current annual tax
- $3,523 · $294/mo
- Projected year-2 tax
- $4,214 · $351/mo
- Expected delta
- +$691/yr (+$58/mo · 19.6%)
ⓘ Screening estimate from a state-policy table — verify with the county assessor before closing.
Climate risk First Street
- Flood 1/10 Low FEMA zone X (unshaded) · 0% chance over 30 yrs
- Wildfire 1/10 Low
- Heat 7/10 Severe 7 d/yr ≥103°F today · 15 d/yr by 30 yrs out
- Wind 5/10 Major 23% chance of damaging wind over 30 yrs
- Air quality 3/10 Moderate 3 unhealthy d/yr today · 4 by 30 yrs out
Nearby sold comps map
Loading sold comps map…
Walkable amenities ~0.75 mi
Loading nearby amenities…
Taxation est. · year 1
- Rental income
- $59,052
- − Mortgage interest
- −$25,207
- − Property taxes
- −$3,523
- − Insurance
- −$2,250
- − Repairs & maintenance
- −$4,724
- − Management
- −$4,724
- − Depreciation
- −$13,091
- Taxable income
- $5,533
- Est. tax owed @ 24.0%
- −$1,328
- After-tax cash flow
- $11,232/yr
For passive investors: Depreciation is non-cash, so a rental often shows a tax loss while cash-flowing — sheltering income. Rental losses are passive: they offset passive income freely, and up to $25,000/yr can offset ordinary (W-2) income if you actively participate and your MAGI is under $100k (phasing out to $0 by $150k); unused losses carry forward. On sale, claimed depreciation is recaptured at up to 25%, and gains may owe capital-gains tax (a 1031 exchange can defer both). Figures are a year-1 estimate at your 24.0% rate — not tax advice; consult a CPA.
Schools (NCES district)
- District
- Baltimore City Public Schools
- NCES district ID
- 2400090
- Math proficiency
- 7% ▼ -9.00%
- Reading proficiency
- 16% ▼ -5.00%
- Median HH income
- $42,108
- Composite
- 10.08/100
- National rank
- #9805
- State rank
- #24 of 24 in MD
Livability — Baltimore
- Score
- 76/100
- State rank
- #90
- US rank
- #3396
Category grades
Schools grade is shown separately in the Schools card above.
Census & demographics
- Census place
- Baltimore, MD
- County
- Baltimore County · 769,527 people
- City population
- 588,727
- Metro
- Baltimore-Columbia-Towson, MD
- Population (ZIP)
- 47,099
- Household income
- $67,060
- Rent vs Own
- Severe rent burden
- 2139.0
Population outlook (Baltimore County) Hauer SSP2
- Today (2025)
- 624,249 people
- By 2030
- 621,541 · -0.4%
- By 2040
- 609,756 · -2.3%
- By 2050
- 597,249 · -4.3%
- By 2075
- 552,236 · -11.5%
- By 2100
- 513,934 · -17.7%
Race, ethnicity, and origin ACS 2023
- Neighborhood character
- Predominantly Black (78%)
- Race & ethnicity
- Black 78% White 8% Hispanic / Latino 7% Two or more races 5% Asian 3%
- Hispanic origin (detail)
- Puerto Rican 1%
- Common ancestry
- Swedish 1%
- Foreign-born
- 13% · Canada, Philippines, South Korea
- Languages at home
- 86% English-only · Spanish 4% French/Haitian/Cajun 1% Other Asian/Pacific 1%
Political lean MEDSL · Baltimore
- 2024 margin
- Solid D (+73.0) · D 85.2% · R 12.2% · Other 2.6%
- 2008→2024 swing
- -2.5pp toward R · 2008: 75.5pp · 2024: 73.0pp
- All cycles
- 2024: D+73.0 2020: D+76.6 2016: D+74.6 2012: D+76.4 2008: D+75.5
Not yet ingested
- Civics
- —
Market trends
- HPI YoY
- ▲ 9.50%
- Current HPI
- 843.63
- Rent YoY
- ▲ 5.23%
- Metro
- Baltimore-Columbia-Towson, MD
- State GDP YoY
- ▲ 2.97%
- F500 in state
- 12
Industry mix (Fortune 500 HQ in MD)
| Industry | F500 HQs | Revenue |
|---|---|---|
| Aerospace / Defense | 1 | $71B |
|
||
| Utilities | 1 | $25B |
|
||
| Hotels | 1 | $24B |
|
||
| Consumer Goods | 1 | $7B |
|
||
| Real Estate | 1 | $6B |
|
||
| Chemicals | 1 | $2B |
|
||
Price history
-70.8% since first listed5 events — show timeline
- 2026-05-29 Listed $450,000 BRIGHT MLS
- 2015-02-27 Sold (Public Records) $500,000 Public Records
- 2011-09-02 Sold (Public Records) $90,000 Public Records
- 2010-07-22 Sold (Public Records) $478,636 Public Records
- 1990-02-22 Sold (Public Records) $1,540,500 Public Records
Property tax history
+2.7%/yrLatest (2025): $3,523 · +0.0% YoY. Source: county tax records.
Cash-flow waterfall
monthlySold comps — $/sqft
last 12 mo · ≤1 miLoading sold comps…