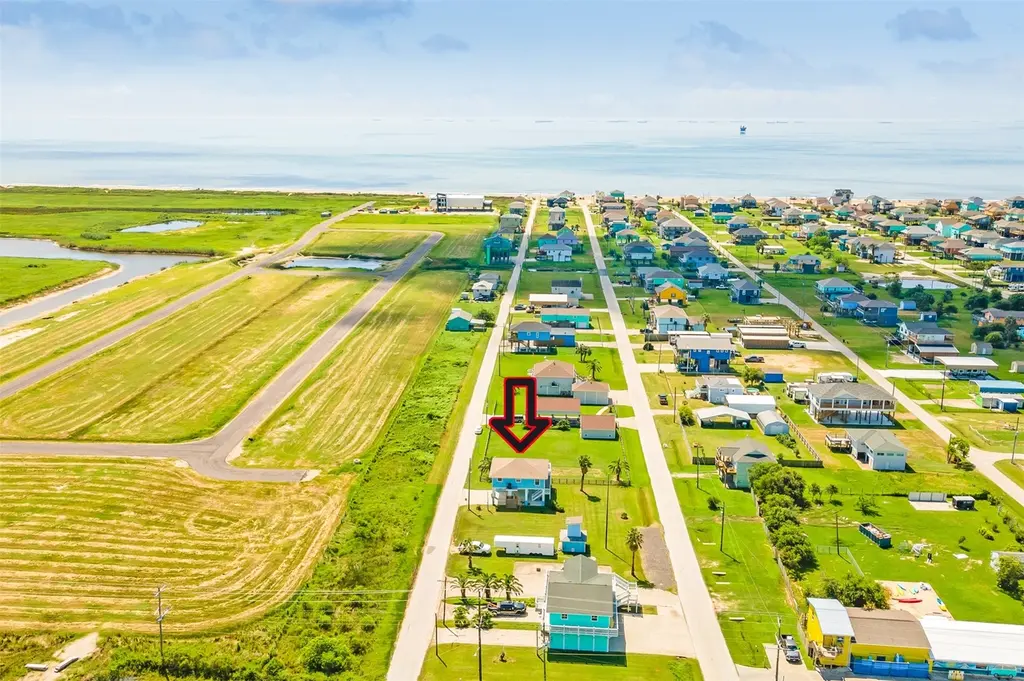
966 Mr G · Bolivar Peninsula, TX
Flood risk 10/10 · Severe
- FEMA flood zone
- VE
- Chance of flooding over 30 yrs
- 0.99%
- Est. flood insurance / yr
- $5,013 – $11,043
Fire risk 3/10 · Minor
- Est. fire insurance / yr
- $1,222 – $2,270
Heat risk 10/10 · Severe
- Hot days now (above 107°F)
- 7 days/yr
- Hot days in 30 yrs
- 26 days/yr
Wind risk 10/10 · Severe
- Chance of severe wind over 30 yrs
- 99.0%
Air-quality risk 2/10 · Minimal
- Unhealthy air days now
- 2 days/yr
- Unhealthy air days in 30 yrs
- 2 days/yr
Risk factors via First Street. Map © Google.
Why this score? — see what drove the C- grade
The composite is a weighted blend of 9 inputs, each scored 0–100. Each bar is that input's sub-score; the figure is the points it added to the 100-point composite (weight × sub-score).
- ARV discount +15.0/15.0
- Cash flow +10.8/30.0
- Appreciation +5.4/10.0
- Condition / age +4.0/5.0
- 1% rule +3.2/10.0
- Livability +3.2/5.0
- DSCR +3.1/10.0
- Schools +3.0/10.0
- Rent growth +2.5/5.0
$309,900
🖨 Deal sheet (PDF) 📄 Offer letter ✓ Due diligence
Listing remarks MLS
Discover your dream beach house in the heart of Crystal Beach! This charming 2-bed, 1-bath home offers an open floor plan with neutral tones and white cabinetry, creating a bright and airy living space. The oversized garage and slab beneath the house provide extra parking and an ideal entertainment area. Enjoy beach views from the balcony, perfect for watching both sunrises and sunsets. An outdoor shower adds convenience after a day in the sand. Fully furnished and centrally located, this property is ideal as a vacation getaway or a potential rental. Don’t miss out on this prime opportunity!
Key facts
- Outdoor shower
- 5,000 sq ft lot
- Garage
Tags
Neighborhood map
What this means for you Summary
Snapshot
- This is a 2-bed/1.0-bath single-family listed at $310k. Condition is rated good.
Deal economics
- At list price, monthly cash flow is $-811 ($-10k/yr) — negative.
- To cash-flow at today's rent, offer at most $193k (37.9% below list).
- To meet the 1% rule (rent ≥ 1% of price), the offer needs to be $253k (18.3% below list).
- Recommended offer: $193k (37.9% below list) — sets the bar for cash-flow.
- Cap rate 5.7% vs local median 2.1% in Bolivar Peninsula — top-decile yield for the area; either an underpriced asset or a hidden risk that comps aren't pricing in. Stress-test before assuming the spread holds.
Location & tenants
- Location reads 65/100 on livability (#719 in TX) — a middle-class / working-renter tenant base. Strengths: crime A+, cost of living A+, housing A+; Watch: amenities F, commute F, health & safety F.
- Galveston ISD (town): math 33% / reading 39% proficiency, ranked #514 of 826 in TX (top 62%) — families likely to look elsewhere, expect single-tenant / working-renter base with shorter leases; 68% free/reduced lunch — lower-income household profile, screen leases tightly.
- Zoned schools: Oppe El (math 67% / reading 60%, grade B, #291 of 4,322 statewide, top 7%, 610 students, 63% FRL); Central Middle (math 18% / reading 21%, grade F, #1,445 of 1,662 statewide, top 88%, 879 students, 80% FRL); Ball H S (math 17% / reading 44%, grade F, #1,085 of 1,632 statewide, top 67%, 1,934 students, 73% FRL) — zoned schools at 72% FRL track the district average.
- Market conditions: 13 active listings in the ZIP; 4 comparable units currently listed for rent nearby; rentals leasing fast (median 5d on market — plan ~1-2 weeks tenant-placement turnaround); 3,258 units permitted in Galveston County in 2024 (0 in 5+ unit buildings).
Forward outlook
- In year one you build about $5k of equity ($2k loan paydown + $2k appreciation (0.8% local appreciation)).
- Galveston County population projected at +43% by 2050 — long-run rental-demand tailwind backs the buy-and-hold thesis.
- By year 7, paydown + projected appreciation supports a ~$32k cash-out refi (75% LTV) — recoverable capital for the next deal without selling this one.
Negotiation context
- It's been on market 667 days — a 12% lower offer ($273k) is reasonable based on typical stale-listing flexibility.
- 2 sale attempts since 4y ago with the ask held roughly flat each time — persistent listings suggest the price (not the market) is what's stuck; bring a comps-based counter.
Risks & watch-outs
- Watch-outs: flood insurance adds $669/mo.
- Climate carrying-cost: in FEMA flood zone VE (mandatory federal flood insurance); severe wind risk, 99% chance of damaging wind over 30y; extreme-heat days projected 7→26/yr by 2055 (HVAC capex compounding) — expect insurance premiums to compound above CPI over the hold.
Questions for the listing agent
- What do current leases actually rent for vs. the listed asking? Can we see a recent rent roll and the last 12 months of T-12 income?
- It's been on market 667 days. Have you received any prior offers? Is the seller open to a 38% concession, seller financing, or rate buy-down credit?
- What's the actual annual flood-insurance premium (NFIP or private), and is the property in a SFHA with mandatory coverage?
- Why hasn't it sold? Are there any deal-killer items the seller is aware of (foundation, flood, title, zoning, code violations)?
- Is there a deadline driving the sale (1031 exchange, divorce, estate, relocation)? That informs how much negotiation room exists.
- Schools are D-rated, which usually means shorter tenancies and higher turnover. Who's the typical renter profile here, and what's been the actual vacancy rate?
- What's the average days-on-market for RENTAL listings here right now (not sales)? A rising rental-DOM trend means longer vacancies and softer asking-rent achievability than the comps imply.
- What's the recent tenant-quality profile in this submarket — average credit score on applications, eviction rate, late-payment / NSF rate, and stable-employment percentage? A property-management company in the area should have these aggregated.
- How much new for-sale + rental construction is in the pipeline within 1–3 miles? Heavy new supply typically softens prices + rents 12–24 months out; constrained supply supports both.
Investment metrics
- 1% rule
- 0.82% ✗
- Cap rate
- 5.74%
- Cash-on-cash
- -1.96%
- DSCR
- 0.91
- GRM
- 10.2
CMA / ARV
- ARV (median comp)
- $447,631
- List price
- $309,900
- Delta
- -30.77%
- Verdict
- UNDERPRICED
- Comps
- 20 within 1.0 mi
Show comp detail 12 sales within ~0.75 mi
| Address | Dist | Beds/Ba | Sqft | Sold | Price | $/sf | Match |
|---|---|---|---|---|---|---|---|
| 894 West Ln | 0.21mi | 3/3.5 (+1) | 1,200 (0%) | 3mo | $385,000 | $321 | 72 |
| 700 Palmetto Dr | 0.42mi | 3/2.0 (+1) | 1,160 (-3%) | 1mo | $474,900 | $409 | 65 |
| 875 Palmetto Dr | 0.30mi | 3/2.0 (+1) | 1,260 (+5%) | 8mo | $395,000 | $313 | 62 |
| 954 Palmetto Dr | 0.21mi | 1/1.5 (-1) | 1,080 (-10%) | 10mo | $199,000 | $184 | 58 |
| 948 Holiday | 0.27mi | 3/2.0 (+1) | 1,092 (-9%) | 10mo | $370,000 | $339 | 56 |
| 886 Wommack | 0.22mi | 3/3.0 (+1) | 1,308 (+9%) | 11mo | $480,000 | $367 | 53 |
| 819 West Ln | 0.38mi | 3/2.0 (+1) | 1,271 (+6%) | 20mo | $490,000 | $386 | 47 |
| 855 West Ln | 0.29mi | 3/2.0 (+1) | 1,305 (+9%) | 20mo | $419,000 | $321 | 46 |
| 955 Townsend Dr | 0.42mi | 3/2.0 (+1) | 1,134 (-6%) | 20mo | $379,000 | $334 | 45 |
| 865 Main St | 0.68mi | 2/2.0 | 1,120 (-7%) | 12mo | $303,000 | $271 | 44 |
| 842 Sea Spray Dr | 0.64mi | 3/2.0 (+1) | 1,360 (+13%) | 1mo | $435,000 | $320 | 38 |
| 1316 Sunrise | 0.53mi | 3/2.0 (+1) | 1,333 (+11%) | 17mo | $549,000 | $412 | 33 |
Match score weights: distance 35% · size 25% · config 20% · recency 20%. Top-matched comps best support the ARV.
Projected returns pro-forma
0.8% appreciation · 3.0% rent growth · sell at horizon
- IRR
- -11.3%
- Equity multiple
- 0.44×
- Total profit
- $-48,453
- Equity at exit
- $102,551
- IRR
- -5.1%
- Equity multiple
- 0.40×
- Total profit
- $-52,399
- Equity at exit
- $133,807
Cash invested: $86,772 (down + closing). Projections, not guarantees.
Landlord ↔ Tenant lean methodology
- Overall (STATE)
- 87 Strongly Landlord-Friendly
- State Texas
- 87 Strongly Landlord-Friendly · R+5
- County
- — inherits STATE
- City
- — inherits STATE
ZIP-level market 77560
- Home prices YoY
- 0.8%
- Active inventory
- 13
- Price-to-rent
- 10.2×
Monthly cashflow live
- Estimated rent
- $2,531 medium interval (Pro) →
- Mortgage (P&I)
- −$1,625
- Tax est. 1.5%
- −$387 /mo · $4,648/yr
- Insurance
- −$129
- Flood insurance flood zone
- −$669 /mo · $8,028/yr
- HOA
- −$0
- Vacancy / Maint / Mgmt
- −$532
- Net cashflow
- $-811
Break-even live
Sensitivity live
| Price | -10% $-597 | -5% $-704 | +0% $-811 | +5% $-918 | +10% $-1,025 |
|---|---|---|---|---|---|
| Rent | -10% $-1,011 | -5% $-911 | +0% $-811 | +5% $-711 | +10% $-611 |
| Rate | -1.0pp $-655 | -0.5pp $-732 | base $-811 | +0.5pp $-891 | +1.0pp $-973 |
UW: 25.0% down · 7.5% · 30yr · 1.5% tax · 5.0% vac · 8.0% maint · 8.0% mgmt
Financing live
Cash to close
- Down payment
- $77,475
- Closing costs
- $9,297
- Reserves months
- —
- Total cash needed
- —
Loan-product check · same deal, 3 products live
Conventional
25% down · 7.5% · 30yr
- Down + closing
- —
- Monthly P&I
- —
- Monthly cashflow
- —
- DSCR
- —
- Eligible?
- —
Personal DTI + credit; lowest rate.
DSCR
20% down · 8.5% · 30yr
- Down + closing
- —
- Monthly P&I
- —
- Monthly cashflow
- —
- DSCR
- —
- Eligible?
- —
No personal income docs; deal must DSCR.
Hard money
10% down · 12.0% · 12mo
- Down + closing
- —
- Monthly P&I
- —
- Monthly cashflow
- —
- DSCR
- —
- Eligible?
- —
Short-term bridge; refi at stabilization.
Rent comps 4 comps
| Address | Beds | Baths | Sqft | Rent | $/sqft | DOM | Units | Dist |
|---|---|---|---|---|---|---|---|---|
| 863 S Selwyn Rd Unit 1558167P Crystal Beach, TX | 3.0 | 2.0 | 1356 | $2,864 | $2.11 | 0d | 1 | 0.88mi |
| 970 S Jacks Rd Unit 1223248P Crystal Beach, TX | 3.0 | 2.0 | 1248 | $2,558 | $2.05 | 0d | 1 | 1.01mi |
| 1166 N Jacks Rd Port Bolivar, TX | 2.0 | 1.0 | 918 | $2,050 | $2.23 | 4d | 1 | 1.12mi |
| 948 Kahla Dr Unit 1223246P Crystal Beach, TX | 2.0 | 2.0 | 1227 | $2,496 | $2.03 | 9d | 1 | 1.14mi |
Listing history 22 events
-
2026-06-21days on market $309,900 Active 667 DOM
-
2026-06-18days on market $309,900 Active 664 DOM
-
2026-06-17days on market $309,900 Active 663 DOM
-
2026-06-16days on market $309,900 Active 662 DOM
-
2026-06-15days on market $309,900 Active 661 DOM
-
2026-06-13days on market $309,900 Active 659 DOM
-
2026-06-09days on market $309,900 Active 655 DOM
-
2026-06-08days on market $309,900 Active 654 DOM
-
2026-06-07days on market $309,900 Active 653 DOM
-
2026-06-04days on market $309,900 Active 650 DOM
-
2026-06-03days on market $309,900 Active 649 DOM
-
2026-06-01days on market $309,900 Active 647 DOM
-
2026-05-31days on market $309,900 Active 646 DOM
-
2024-08-23$309,900 Active 604-char remark
Show marketing remark (604 chars)
Discover your dream beach house in the heart of Crystal Beach! This charming 2-bed, 1-bath home offers an open floor plan with neutral tones and white cabinetry, creating a bright and airy living space. The oversized garage and slab beneath the house provide extra parking and an ideal entertainment area. Enjoy beach views from the balcony, perfect for watching both sunrises and sunsets. An outdoor shower adds convenience after a day in the sand. Fully furnished and centrally located, this property is ideal as a vacation getaway or a potential rental. Don’t miss out on this prime opportunity!
-
2022-11-28historical
-
2022-09-12price $399,000
-
2022-09-11price $399,000
-
2022-07-21price $435,000
-
2022-07-20price $435,000
-
2022-05-08price $447,000
-
2022-05-08price $447,000
-
2022-03-16$485,000 Active
ⓘ Source: listings_history table (triggers on properties + properties_extension) + one-shot
backfill from property_details.listing_events for pre-trigger history.
Climate risk First Street
- Flood 10/10 Extreme FEMA zone VE · 99% chance over 30 yrs
- Wildfire 3/10 Moderate
- Heat 10/10 Extreme 7 d/yr ≥107°F today · 26 d/yr by 30 yrs out
- Wind 10/10 Extreme 99% chance of damaging wind over 30 yrs
- Air quality 2/10 Low 2 unhealthy d/yr today · 2 by 30 yrs out
Nearby sold comps map
Loading sold comps map…
Walkable amenities ~0.75 mi
Loading nearby amenities…
Taxation est. · year 1
- Rental income
- $30,376
- − Mortgage interest
- −$17,359
- − Property taxes
- −$4,648
- − Insurance
- −$9,578
- − Repairs & maintenance
- −$2,430
- − Management
- −$2,430
- − Depreciation
- −$9,015
- Taxable loss
- −$15,085
- Est. tax savings @ 24.0%
- +$3,620
- After-tax cash flow
- $-6,111/yr
For passive investors: Depreciation is non-cash, so a rental often shows a tax loss while cash-flowing — sheltering income. Rental losses are passive: they offset passive income freely, and up to $25,000/yr can offset ordinary (W-2) income if you actively participate and your MAGI is under $100k (phasing out to $0 by $150k); unused losses carry forward. On sale, claimed depreciation is recaptured at up to 25%, and gains may owe capital-gains tax (a 1031 exchange can defer both). Figures are a year-1 estimate at your 24.0% rate — not tax advice; consult a CPA.
Condition & rehab AI · 12 photos
This charming 2-bedroom, 1-bath home in Crystal Beach is in good condition with a good condition score of 80. It offers an open floor plan, modern appliances, and a well-maintained exterior. The property is ideal for a vacation getaway or potential rental.
Value-add opportunities
- Both update flooring — modern flooring can enhance both resale and rental value
- Both update paint exterior — fresh paint can enhance curb appeal and value
- Both update blinds — new blinds can improve energy efficiency and aesthetics
Renovation cost estimate screening
Value-add ROI direction
- Both update flooring — modern flooring can enhance both resale and rental value ↑
- Both update paint exterior — fresh paint can enhance curb appeal and value ↑
- Both update blinds — new blinds can improve energy efficiency and aesthetics ↑
ⓘ Cost ranges are severity-bucket heuristics (US national rule-of-thumb). Get contractor quotes + a written scope before underwriting a rehab budget.
Schools (NCES district)
- District
- Galveston ISD
- NCES district ID
- 4820280
- Math proficiency
- 33% ▼ -14.00%
- Reading proficiency
- 39% ▼ -4.00%
- Median HH income
- $40,162
- Composite
- 30.22/100
- National rank
- #6299
- State rank
- #514 of 826 in TX
Livability — Bolivar Peninsula
- Score
- 65/100
- State rank
- #719
- US rank
- #13437
Category grades
Schools grade is shown separately in the Schools card above.
Census & demographics
- Census place
- Bolivar Peninsula, TX
- City population
- 2,957
- Population (ZIP)
- 1,095
Population outlook (Galveston County) Hauer SSP2
- Today (2025)
- 390,640 people
- By 2030
- 425,226 · +8.9%
- By 2040
- 493,765 · +26.4%
- By 2050
- 559,698 · +43.3%
- By 2075
- 719,260 · +84.1%
- By 2100
- 819,628 · +109.8%
Race, ethnicity, and origin ACS 2023
- Neighborhood character
- Diverse neighborhood (Simpson 0.60)
- Race & ethnicity
- White 56% Black 21% Hispanic / Latino 21% Two or more races 10%
- Hispanic origin (detail)
- Mexican 17%
- Common ancestry
- Lithuanian 2%
- Foreign-born
- 2% · Canada
- Languages at home
- 84% English-only · Spanish 16%
Political lean MEDSL · Galveston
- 2024 margin
- Strong R (+27.4) · D 35.7% · R 63.1% · Other 1.2%
- 2008→2024 swing
- -7.9pp toward R · 2008: -19.5pp · 2024: -27.4pp
- All cycles
- 2024: R+27.4 2020: R+22.6 2016: R+22.6 2012: R+26.9 2008: R+19.5
Not yet ingested
- Civics
- —
Market trends
- HPI YoY
- ▲ 0.80%
- Current HPI
- 97.7497
- Rent YoY
- —
- Metro
- —
- State GDP YoY
- ▲ 3.95%
- F500 in state
- 110
Industry mix (Fortune 500 HQ in TX)
| Industry | F500 HQs | Revenue |
|---|---|---|
| Energy | 16 | $1,198B |
|
||
| Technology | 5 | $198B |
|
||
| Engineering / Construction | 4 | $72B |
|
||
| Energy Services | 3 | $60B |
|
||
| Utilities | 3 | $41B |
|
||
| Healthcare | 2 | $330B |
|
||
Price history
-36.1% since first listed9 events — show timeline
- 2024-08-23 Listed $309,900 HARMLS
- 2022-11-28 Listing Removed — HARMLS
- 2022-09-12 Price Changed $399,000 Galveston MLS
- 2022-09-11 Price Changed $399,000 HARMLS
- 2022-07-21 Price Changed $435,000 Galveston MLS
- 2022-07-20 Price Changed $435,000 HARMLS
- 2022-05-08 Price Changed $447,000 Galveston MLS
- 2022-05-08 Price Changed $447,000 HARMLS
- 2022-03-16 Listed $485,000 HARMLS
Cash-flow waterfall
monthlySold comps — $/sqft
last 12 mo · ≤1 miLoading sold comps…