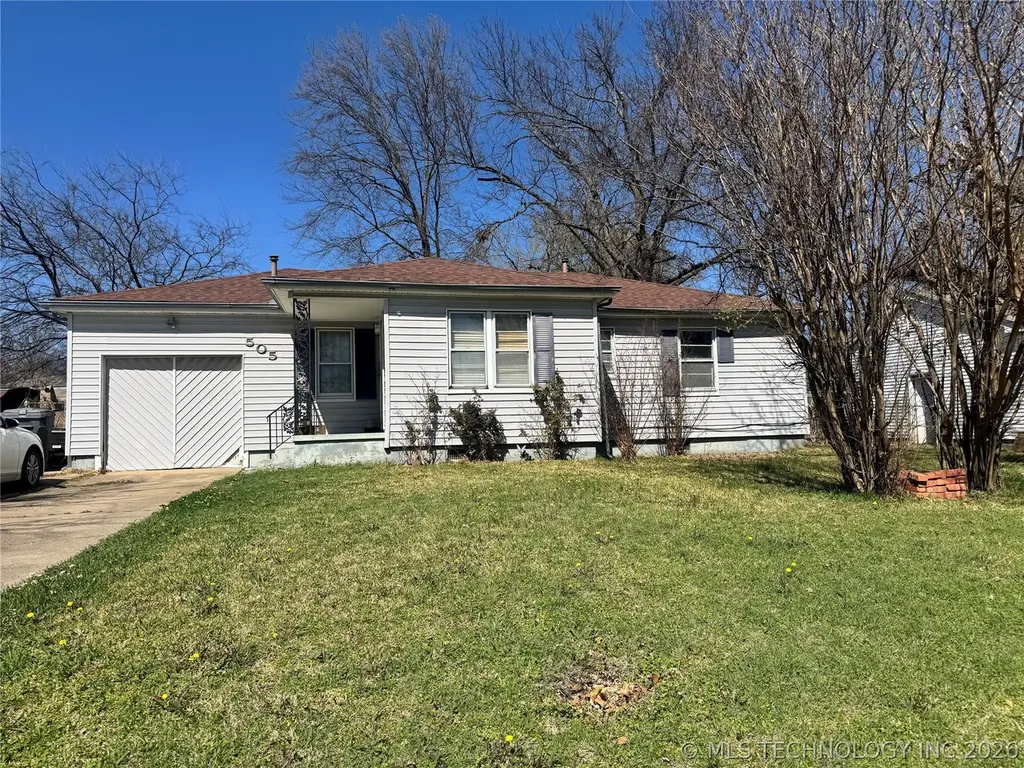
505 Oak · Ardmore, OK
Flood risk 1/10 · Minimal
- FEMA flood zone
- X (unshaded)
- Chance of flooding over 30 yrs
- 0.0%
- Est. flood insurance / yr
- $507 – $1,088
Fire risk 5/10 · Moderate
- Est. fire insurance / yr
- $2,463 – $4,575
Heat risk 6/10 · Moderate
- Hot days now (above 112°F)
- 7 days/yr
- Hot days in 30 yrs
- 20 days/yr
Wind risk 4/10 · Minor
- Chance of severe wind over 30 yrs
- 11.0%
Air-quality risk 3/10 · Minor
- Unhealthy air days now
- 2 days/yr
- Unhealthy air days in 30 yrs
- 3 days/yr
Risk factors via First Street. Map © Google.
Why this score? — see what drove the B+ grade
The composite is a weighted blend of 9 inputs, each scored 0–100. Each bar is that input's sub-score; the figure is the points it added to the 100-point composite (weight × sub-score).
- Cash flow +30.0/30.0
- ARV discount +15.0/15.0
- 1% rule +10.0/10.0
- DSCR +10.0/10.0
- Rent growth +4.3/5.0
- Livability +2.9/5.0
- Condition / age +2.5/5.0
- Schools +1.1/10.0
- Appreciation +0.0/10.0
$79,000
🖨 Deal sheet (PDF) 📄 Offer letter ✓ Due diligence
Listing remarks
3-bedroom, 1-bath home located in Ardmore. Updates include roof and central heat & AC updated in 2022, offering added peace of mind for future owners. The property also has a privacy-fenced backyard, perfect for outdoor enjoyment. This property presents a great opportunity for investors or buyers looking to add their personal touch. Call today for more information! (pool does not stay)
Key facts
- Roof updated
- 6,970 sq ft lot
- Garage
Tags
Property features AI
Exterior
- Parking: Attached garage (1 car)
- Security: No safety shelter
- Utilities: Electricity available; Natural gas available; Public water; Public sewer
- Home design: Single-story; Faces south; Crawlspace foundation
- Construction: Vinyl siding; Wood frame construction; Asphalt/fiberglass roof; Built according to public records
- Exterior features: Porch; Privacy fencing
Interior
- Kitchen: Oven; Range
- Flooring: Carpet; Vinyl
- Bathrooms: 1 full bathroom
- Heating & cooling: Central heating (electric); Central air conditioning
- Interior features: Butcher block counters; Ceiling fan(s); Other interior features
- Laundry & utility: Gas water heater
Neighborhood map
What this means for you Summary
Snapshot
- This is a 3-bed/1.0-bath single-family listed at $79k.
Deal economics
- At list price, monthly cash flow is $543 ($7k/yr) — positive.
- The deal already cash-flows at list — no discount required.
- Meets the 1% rule at list price ($1k rent vs $79k).
- Recommended offer: $78k (1.5% below list) — sets the bar for market timing.
- Cap rate 14.5% vs local median 4.6% in Ardmore — top-decile yield for the area; either an underpriced asset or a hidden risk that comps aren't pricing in. Stress-test before assuming the spread holds.
Location & tenants
- Location reads 58/100 on livability (#447 in OK) — a working-class tenant base; expect higher turnover. Strengths: cost of living A+, housing A+; Watch: schools F, crime F, amenities F.
- Ardmore (town): math 12% / reading 15% proficiency, ranked #241 of 270 in OK (top 89%) — low school quality limits family demand, transient renter base, plan for 1-2y turnover; 73% free/reduced lunch — lower-income household profile, screen leases tightly.
- Market conditions: Rents rising fast (+7.4%/yr); 379 active listings in the ZIP; 73 units permitted in Carter County in 2024 (0 in 5+ unit buildings).
Forward outlook
- Local home prices are declining (-3.0%/yr); year-one equity from $546 of loan paydown is wiped out by about $2k of value loss. Plan a longer hold.
- Carter County population projected at +9% by 2050 — modest demand growth; plan on rents tracking national, not racing it.
- At projected returns (-3.0% appreciation + 7.4% rent growth), your $22k cash investment doubles in ~4 years — after that, you're playing with house money.
Negotiation context
- It's been on market 25 days — a 2% lower offer ($78k) is reasonable based on typical stale-listing flexibility.
- Current owner paid $33k; list at $79k implies a 139% gain — meaningful room to come down on a strong offer.
Risks & watch-outs
- Watch-outs: built in 1955 — expect roof / HVAC / electrical / plumbing capex.
- Climate carrying-cost: moderate wildfire risk; extreme-heat days projected 7→20/yr by 2055 (HVAC capex compounding) — expect insurance premiums to compound above CPI over the hold.
Questions for the listing agent
- Built in 1955 — when were the roof, HVAC, electrical panel, plumbing, and water heater last replaced?
- Is there a deadline driving the sale (1031 exchange, divorce, estate, relocation)? That informs how much negotiation room exists.
- Schools are F-rated, which usually means shorter tenancies and higher turnover. Who's the typical renter profile here, and what's been the actual vacancy rate?
- Crime grade is F in this area — have there been break-ins, vandalism, or insurance claims at this property in the last 3 years? What carrier currently insures it and at what premium?
- What's the average days-on-market for RENTAL listings here right now (not sales)? A rising rental-DOM trend means longer vacancies and softer asking-rent achievability than the comps imply.
- What's the recent tenant-quality profile in this submarket — average credit score on applications, eviction rate, late-payment / NSF rate, and stable-employment percentage? A property-management company in the area should have these aggregated.
- How much new for-sale + rental construction is in the pipeline within 1–3 miles? Heavy new supply typically softens prices + rents 12–24 months out; constrained supply supports both.
Investment metrics
- 1% rule
- 1.69% ✓
- Cap rate
- 14.54%
- Cash-on-cash
- 29.45%
- DSCR
- 2.31
- GRM
- 4.9
CMA / ARV
- ARV (on-the-fly)
- $122,208
- Comps found
- 12
Show comp detail 12 sales within ~0.75 mi
| Address | Dist | Beds/Ba | Sqft | Sold | Price | $/sf | Match |
|---|---|---|---|---|---|---|---|
| 421 Elm | 0.24mi | 3/1.5 | 926 (+2%) | 2mo | $132,000 | $143 | 82 |
| 414 Locust | 0.21mi | 3/1.0 | 864 (-5%) | 0mo | $118,000 | $137 | 81 |
| 711 Cherry | 0.36mi | 2/1.0 (-1) | 872 (-4%) | 7mo | $133,500 | $153 | 65 |
| 718 Ash St | 0.43mi | 2/1.0 (-1) | 880 (-4%) | 7mo | $118,000 | $134 | 64 |
| 428 Elm | 0.25mi | 3/2.0 | 1,012 (+11%) | 7mo | $139,000 | $137 | 60 |
| 704 Ash St | 0.35mi | 3/1.0 | 992 (+9%) | 12mo | $90,900 | $92 | 59 |
| 703 Cherry St | 0.32mi | 2/1.0 (-1) | 840 (-8%) | 10mo | $94,764 | $113 | 59 |
| 505 Locust | 0.10mi | 3/1.5 | 1,028 (+13%) | 18mo | $145,000 | $141 | 57 |
| 818 Northwest Blvd | 0.71mi | 2/1.0 (-1) | 928 (+2%) | 3mo | $114,900 | $124 | 57 |
| 1408 Holt | 0.74mi | 2/1.0 (-1) | 883 (-3%) | 13mo | $88,000 | $100 | 44 |
| 703 15th Ave NW | 0.61mi | 2/1.0 (-1) | 1,020 (+12%) | 11mo | $64,000 | $63 | 38 |
| 1413 Healdton Blvd | 0.75mi | 3/1.5 | 1,008 (+10%) | 17mo | $129,900 | $129 | 31 |
Match score weights: distance 35% · size 25% · config 20% · recency 20%. Top-matched comps best support the ARV.
Projected returns pro-forma
-3.0% appreciation · 7.38% rent growth · sell at horizon
- IRR
- 28.6%
- Equity multiple
- 2.26×
- Total profit
- $27,903
- Equity at exit
- $11,779
- IRR
- 38.5%
- Equity multiple
- 5.36×
- Total profit
- $96,338
- Equity at exit
- $6,830
Cash invested: $22,120 (down + closing). Projections, not guarantees.
Landlord ↔ Tenant lean methodology
- Overall (STATE)
- 83 Strongly Landlord-Friendly
- State Oklahoma
- 83 Strongly Landlord-Friendly · R+20
- County
- — inherits STATE
- City
- — inherits STATE
ZIP-level market 73401
- Home prices YoY
- -21.7%
- Rents YoY
- 7.4%
- Active inventory
- 379
- Price-to-rent
- 4.9×
Monthly cashflow live
- Estimated rent
- $1,332 medium interval (Pro) →
- Mortgage (P&I)
- −$414
- Tax from tax record
- −$62 /mo · $741/yr
- Insurance
- −$33
- HOA
- −$0
- Vacancy / Maint / Mgmt
- −$280
- Net cashflow
- $543
Break-even live
Sensitivity live
| Price | -10% $588 | -5% $565 | +0% $543 | +5% $521 | +10% $498 |
|---|---|---|---|---|---|
| Rent | -10% $438 | -5% $490 | +0% $543 | +5% $596 | +10% $648 |
| Rate | -1.0pp $583 | -0.5pp $563 | base $543 | +0.5pp $522 | +1.0pp $502 |
UW: 25.0% down · 7.5% · 30yr · 1.5% tax · 5.0% vac · 8.0% maint · 8.0% mgmt
Financing live
Cash to close
- Down payment
- $19,750
- Closing costs
- $2,370
- Reserves months
- —
- Total cash needed
- —
Loan-product check · same deal, 3 products live
Conventional
25% down · 7.5% · 30yr
- Down + closing
- —
- Monthly P&I
- —
- Monthly cashflow
- —
- DSCR
- —
- Eligible?
- —
Personal DTI + credit; lowest rate.
DSCR
20% down · 8.5% · 30yr
- Down + closing
- —
- Monthly P&I
- —
- Monthly cashflow
- —
- DSCR
- —
- Eligible?
- —
No personal income docs; deal must DSCR.
Hard money
10% down · 12.0% · 12mo
- Down + closing
- —
- Monthly P&I
- —
- Monthly cashflow
- —
- DSCR
- —
- Eligible?
- —
Short-term bridge; refi at stabilization.
Listing history 4 events
-
2026-05-19price $79,000
-
2026-04-29$89,000 Active
-
2022-05-04soldstatus $33,000
-
2002-08-29soldstatus $40,000
ⓘ Source: listings_history table (triggers on properties + properties_extension) + one-shot
backfill from property_details.listing_events for pre-trigger history.
Tax reassessment forecast OK · Resets to sale price
- Current annual tax
- $741 · $62/mo
- Projected year-2 tax
- $741 · $62/mo
- Expected delta
- $0/yr ($0/mo · -0.0%)
ⓘ Screening estimate from a state-policy table — verify with the county assessor before closing.
Climate risk First Street
- Flood 1/10 Low FEMA zone X (unshaded) · 0% chance over 30 yrs
- Wildfire 5/10 Major
- Heat 6/10 Major 7 d/yr ≥112°F today · 20 d/yr by 30 yrs out
- Wind 4/10 Moderate 11% chance of damaging wind over 30 yrs
- Air quality 3/10 Moderate 2 unhealthy d/yr today · 3 by 30 yrs out
Nearby sold comps map
Loading sold comps map…
Walkable amenities ~0.75 mi
Loading nearby amenities…
Taxation est. · year 1
- Rental income
- $15,978
- − Mortgage interest
- −$4,425
- − Property taxes
- −$741
- − Insurance
- −$395
- − Repairs & maintenance
- −$1,278
- − Management
- −$1,278
- − Depreciation
- −$2,298
- Taxable income
- $5,562
- Est. tax owed @ 24.0%
- −$1,335
- After-tax cash flow
- $5,180/yr
For passive investors: Depreciation is non-cash, so a rental often shows a tax loss while cash-flowing — sheltering income. Rental losses are passive: they offset passive income freely, and up to $25,000/yr can offset ordinary (W-2) income if you actively participate and your MAGI is under $100k (phasing out to $0 by $150k); unused losses carry forward. On sale, claimed depreciation is recaptured at up to 25%, and gains may owe capital-gains tax (a 1031 exchange can defer both). Figures are a year-1 estimate at your 24.0% rate — not tax advice; consult a CPA.
Schools (NCES district)
- District
- Ardmore
- NCES district ID
- 4003180
- Math proficiency
- 12% ▼ -7.00%
- Reading proficiency
- 15% ▼ -6.00%
- Median HH income
- $35,194
- Composite
- 11.1/100
- National rank
- #9733
- State rank
- #241 of 270 in OK
Livability — Ardmore
- Score
- 58/100
- State rank
- #447
- US rank
- #21387
Category grades
Schools grade is shown separately in the Schools card above.
Census & demographics
- Census place
- Ardmore, OK
- County
- Carter County · 36,833 people
- City population
- 36,833
- Metro
- Ardmore, OK
- Population (ZIP)
- 36,833
- Household income
- $61,989
- Rent vs Own
- Severe rent burden
- 1026.0
Population outlook (Carter County) Hauer SSP2
- Today (2025)
- 50,892 people
- By 2030
- 51,913 · +2.0%
- By 2040
- 53,857 · +5.8%
- By 2050
- 55,604 · +9.3%
- By 2075
- 60,670 · +19.2%
- By 2100
- 62,366 · +22.5%
Race, ethnicity, and origin ACS 2023
- Neighborhood character
- Diverse neighborhood (Simpson 0.57)
- Race & ethnicity
- White 65% Two or more races 14% Hispanic / Latino 9% Native American 8% Black 7% Asian 1%
- Hispanic origin (detail)
- Mexican 7%
- Common ancestry
- Slovak 2% Lithuanian 1% Italian 1%
- Foreign-born
- 4% · Canada
- Languages at home
- 92% English-only · Spanish 5%
Political lean MEDSL · Carter
- 2024 margin
- Solid R (+54.7) · D 21.9% · R 76.7% · Other 1.4%
- 2008→2024 swing
- -14.2pp toward R · 2008: -40.5pp · 2024: -54.7pp
- All cycles
- 2024: R+54.7 2020: R+52.5 2016: R+52.6 2012: R+42.7 2008: R+40.5
Not yet ingested
- Civics
- —
Market trends
- HPI YoY
- ▼ -74.93%
- Current HPI
- 269.7381
- Rent YoY
- ▲ 7.38%
- Metro
- Ardmore, OK
- State GDP YoY
- ▲ 1.55%
- F500 in state
- 6
Industry mix (Fortune 500 HQ in OK)
| Industry | F500 HQs | Revenue |
|---|---|---|
| Energy | 3 | $48B |
|
||
Price history
+97.5% since first listed4 events — show timeline
- 2026-05-19 Price Changed $79,000 MLS Technology, Inc.
- 2026-04-29 Listed $89,000 MLS Technology, Inc.
- 2022-05-04 Sold (Public Records) $33,000 Public Records
- 2002-08-29 Sold (Public Records) $40,000 Public Records
Property tax history
+7.4%/yrLatest (2025): $741 · -11.4% YoY. Source: county tax records.
Cash-flow waterfall
monthlySold comps — $/sqft
last 12 mo · ≤1 miLoading sold comps…