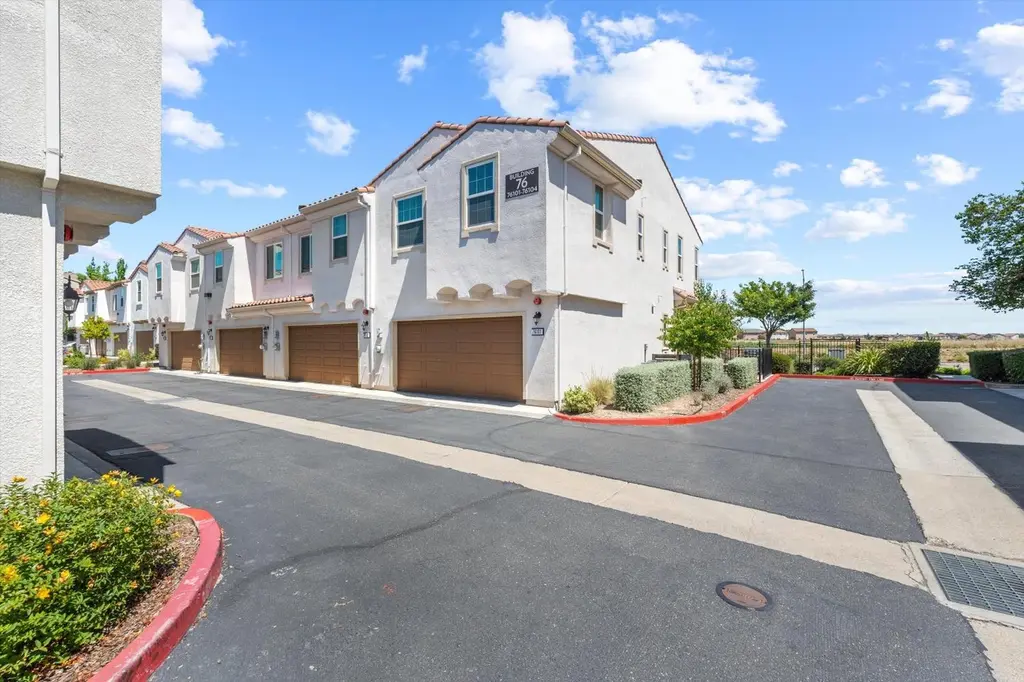
5301 E Commerce Way #76101 · Sacramento, CA
Flood risk 1/10 · Minimal
- FEMA flood zone
- A99
- Chance of flooding over 30 yrs
- 0.0%
- Est. flood insurance / yr
- $1,009 – $1,996
Fire risk 5/10 · Moderate
- Est. fire insurance / yr
- $659 – $1,223
Heat risk 7/10 · Major
- Hot days now (above 103°F)
- 7 days/yr
- Hot days in 30 yrs
- 15 days/yr
Wind risk 1/10 · Minimal
- Chance of severe wind over 30 yrs
- —
Air-quality risk 10/10 · Severe
- Unhealthy air days now
- 29 days/yr
- Unhealthy air days in 30 yrs
- 33 days/yr
Risk factors via First Street. Map © Google.
Why this score? — see what drove the D- grade
The composite is a weighted blend of 9 inputs, each scored 0–100. Each bar is that input's sub-score; the figure is the points it added to the 100-point composite (weight × sub-score).
- Appreciation +9.6/10.0
- ARV discount +9.1/15.0
- Cash flow +5.2/30.0
- Schools +4.1/10.0
- Livability +3.6/5.0
- Rent growth +2.9/5.0
- 1% rule +2.6/10.0
- Condition / age +2.5/5.0
- DSCR +0.0/10.0
$384,900
🖨 Deal sheet 📄 Offer letter ✓ Due diligence
Listing remarks
Discover this beautifully designed condo featuring a spacious open-concept layout that seamlessly connects the Great Room, kitchen, and dining area, perfect for both everyday living and entertaining. This home offers 3 generously sized bedrooms and 2.5 bathrooms, providing ample space for comfortable living. A 2-car garage adds convenience with plenty of room for parking and storage. The heart of the home is the modern kitchen, thoughtfully designed with sleek stainless steel appliances, elegant stone countertops, and a functional island with a built-in sink ideal for meal prep and gathering with family and friends. Upstairs, retreat to the private living spaces, including a well-appointed
Key facts
- $515 HOA
- 2 garage spots
- Community pool
Neighborhood map
What this means for you Summary
Snapshot
- This is a 3-bed/2.5-bath condo listed at $385k.
Deal economics
- At list price, monthly cash flow is $-1k ($-12k/yr) — negative.
- To cash-flow at today's rent, offer at most $208k (46.0% below list).
- To meet the 1% rule (rent ≥ 1% of price), the offer needs to be $292k (24.2% below list).
- Recommended offer: $208k (46.0% below list) — sets the bar for cash-flow.
Location & tenants
- Location reads 71/100 on livability (#218 in CA) — a middle-class / working-renter tenant base. Strengths: amenities A+, commute A+, housing A; Watch: schools D+, crime F, cost of living F.
- Natomas Unified (urban): math 33% / reading 60% proficiency, ranked #155 of 517 in CA (top 30%) — families likely to look elsewhere, expect single-tenant / working-renter base with shorter leases.
- Market conditions: Rents rising (+1.4%/yr); 402 active listings in the ZIP; 23 comparable units currently listed for rent nearby; rentals at typical pace (median 16d on market — plan ~3-4 weeks tenant-placement turnaround); high-income renter base; 6,825 units permitted in Sacramento County in 2024 (1,752 in 5+ unit buildings).
- This rent runs 31% of the median local income ($114k/yr) — at the standard rent-burdened threshold; future hikes will face affordability resistance.
Forward outlook
- In year one you build about $38k of equity ($3k loan paydown + $35k appreciation (9.2% local appreciation)).
- Sacramento County population projected at +17% by 2050 — long-run rental-demand tailwind backs the buy-and-hold thesis.
- By year 2, paydown + projected appreciation supports a ~$61k cash-out refi (75% LTV) — recoverable capital for the next deal without selling this one.
Negotiation context
- It's been on market 30 days — a 2% lower offer ($379k) is reasonable based on typical stale-listing flexibility.
Risks & watch-outs
- Watch-outs: flood insurance adds $125/mo.
- Climate carrying-cost: in FEMA flood zone A99 (mandatory federal flood insurance); moderate wildfire risk; extreme-heat days projected 7→15/yr by 2055 (HVAC capex compounding) — expect insurance premiums to compound above CPI over the hold.
Questions for the listing agent
- What do current leases actually rent for vs. the listed asking? Can we see a recent rent roll and the last 12 months of T-12 income?
- What's the actual annual flood-insurance premium (NFIP or private), and is the property in a SFHA with mandatory coverage?
- What does the HOA fee cover, when was the last increase, and are there any pending special assessments or reserve-fund shortfalls?
- Any open or pending special assessments — roof, HVAC, plumbing, elevator, façade? What's the per-unit balance and payoff schedule, and is the seller paying it off at close or rolling it to the buyer?
- Is there a deadline driving the sale (1031 exchange, divorce, estate, relocation)? That informs how much negotiation room exists.
- Schools are D-rated, which usually means shorter tenancies and higher turnover. Who's the typical renter profile here, and what's been the actual vacancy rate?
- Crime grade is F in this area — have there been break-ins, vandalism, or insurance claims at this property in the last 3 years? What carrier currently insures it and at what premium?
- The area grade is low — what's the realistic commute time and amenity access for the typical tenant pool here? Any planned neighborhood developments (good or bad) we should know about?
- What's the average days-on-market for RENTAL listings here right now (not sales)? A rising rental-DOM trend means longer vacancies and softer asking-rent achievability than the comps imply.
- What's the recent tenant-quality profile in this submarket — average credit score on applications, eviction rate, late-payment / NSF rate, and stable-employment percentage? A property-management company in the area should have these aggregated.
- How much new apartment / multifamily construction is in the pipeline within 1–3 miles? Heavy new supply (>2% of stock underway) typically softens rents 12–24 months out; light construction supports rent growth.
Investment metrics
- 1% rule
- 0.76% ✗
- Cap rate
- 3.56%
- Cash-on-cash
- -9.77%
- DSCR
- 0.57
- GRM
- 11.0
CMA / ARV
- ARV (median comp)
- $398,712
- List price
- $384,900
- Delta
- -2.21%
- Verdict
- FAIR
- Comps
- 20 within 1.0 mi
Projected returns pro-forma
9.18% appreciation · 1.43% rent growth · sell at horizon
- IRR
- 14.1%
- Equity multiple
- 2.12×
- Total profit
- $120,372
- Equity at exit
- $324,092
- IRR
- 13.7%
- Equity multiple
- 4.64×
- Total profit
- $392,317
- Equity at exit
- $676,133
Cash invested: $107,772 (down + closing). Projections, not guarantees.
Landlord ↔ Tenant lean methodology
- Overall (STATE)
- 18 Strongly Tenant-Friendly
- State California
- 18 Strongly Tenant-Friendly · D+13
- County
- — inherits STATE
- City
- — inherits STATE
ZIP-level market 95835
- Home prices YoY
- 3.5%
- Rents YoY
- 1.4%
- Active inventory
- 402
- Price-to-rent
- 11.0×
Monthly cashflow live
- Estimated rent
- $2,917 high interval (Pro) →
- Mortgage (P&I)
- −$2,018
- Tax from tax record
- −$488 /mo · $5,857/yr
- Insurance
- −$160
- Flood insurance flood zone
- −$125 /mo · $1,502/yr
- HOA
- −$515
- Vacancy / Maint / Mgmt
- −$613
- Net cashflow
- $-1,003
Break-even live
UW: 25.0% down · 7.5% · 30yr · 1.5% tax · 5.0% vac · 8.0% maint · 8.0% mgmt
Financing live
Cash to close
- Down payment
- $96,225
- Closing costs
- $11,547
- Reserves months
- —
- Total cash needed
- —
Loan-product check · same deal, 3 products live
Conventional
25% down · 7.5% · 30yr
- Down + closing
- —
- Monthly P&I
- —
- Monthly cashflow
- —
- DSCR
- —
- Eligible?
- —
Personal DTI + credit; lowest rate.
DSCR
20% down · 8.5% · 30yr
- Down + closing
- —
- Monthly P&I
- —
- Monthly cashflow
- —
- DSCR
- —
- Eligible?
- —
No personal income docs; deal must DSCR.
Hard money
10% down · 12.0% · 12mo
- Down + closing
- —
- Monthly P&I
- —
- Monthly cashflow
- —
- DSCR
- —
- Eligible?
- —
Short-term bridge; refi at stabilization.
Rent comps 23 comps
| Address | Beds | Baths | Sqft | Rent | $/sqft | DOM | Units | Dist |
|---|---|---|---|---|---|---|---|---|
| 5301 E Commerce Way Sacramento, CA | 3.0 | 2.5 | 1334 | $2,662 | $2.00 | 23d | 2 | 0.07mi |
| 5301 E Commerce Way Sacramento, CA | 3.0 | 2.5 | 1334 | $2,648 | $1.98 | 16d | 3 | 0.07mi |
| 5301 E Commerce Way #58104 Sacramento, CA | 3.0 | 2.5 | 1315 | $2,900 | $2.21 | 1d | 1 | 0.16mi |
| 11 Long Warf Pl Sacramento, CA | 3.0 | 2.5 | 1708 | $2,795 | $1.64 | 1d | 1 | 0.18mi |
| 3396 Shaker Way Sacramento, CA | 3.0 | 2.5 | 1815 | $3,250 | $1.79 | 12d | 1 | 0.39mi |
| 30 Sheen Ct Sacramento, CA | 3.0 | 2.5 | 1652 | $2,850 | $1.73 | 43d | 1 | 0.44mi |
| 3712 Bayou Rd Sacramento, CA | 3.0 | 2.5 | 1660 | $4,000 | $2.41 | 3d | 1 | 0.57mi |
| 3044 Enchanted Walk Sacramento, CA | 3.0 | 2.5 | 1351 | $2,300 | $1.70 | 1d | 1 | 0.60mi |
| 3766 Bayou Rd Sacramento, CA | 3.0 | 2.5 | 1660 | $2,675 | $1.61 | 43d | 1 | 0.63mi |
| 3301 N Park Dr Sacramento, CA | 3.0 | 2.5 | 1678 | $2,672 | $1.59 | 43d | 2 | 0.70mi |
| 260 Wapello Cir Sacramento, CA | 3.0 | 3.0 | 1697 | $2,650 | $1.56 | 7d | 1 | 0.73mi |
| 570 Wapello Cir Sacramento, CA | 3.0 | 2.5 | 1697 | $3,000 | $1.77 | 43d | 1 | 0.84mi |
| 5050 Trouville Ln Sacramento, CA | 3.0 | 2.5 | 1583 | $2,950 | $1.86 | 43d | 1 | 0.86mi |
| 4800 Westlake Pkwy #3008 Sacramento, CA | 2.0 | 2.0 | 1304 | $2,250 | $1.73 | 43d | 1 | 1.08mi |
| 4800 Westlake Pkwy Sacramento, CA | 1.0–2.0 | 1.5–2.5 | 1214 | $2,250 | $1.85 | 2d | 3 | 1.09mi |
| 4800 Kokomo Dr Sacramento, CA | 1.0–3.0 | 1.0–3.5 | 1229 | $3,819 | $3.11 | 1d | 26 | 1.16mi |
| 5350 Dunlay Dr #911 Sacramento, CA | 3.0 | 2.0 | 1519 | $2,750 | $1.81 | 1d | 1 | 1.23mi |
| 5350 Dunlay Dr Sacramento, CA | 2.0–3.0 | 2.0 | 1585 | $2,750 | $1.74 | 17d | 3 | 1.23mi |
| 5350 Dunlay Dr Sacramento, CA | 2.0–3.0 | 2.0 | 1585 | $2,750 | $1.74 | 21d | 2 | 1.23mi |
| 620 Candela Cir Sacramento, CA | 3.0 | 2.5 | 1681 | $2,595 | $1.54 | 43d | 1 | 1.26mi |
| 301 Candela Cir Sacramento, CA | 3.0 | 2.5 | 1541 | $2,750 | $1.78 | 14d | 1 | 1.28mi |
| 17 Hertford Cir Sacramento, CA | 3.0 | 2.5 | 1511 | $2,450 | $1.62 | 23d | 1 | 1.47mi |
| 4470 Saone Walk Sacramento, CA | 3.0–4.0 | 2.5–3.5 | 1846 | $2,595 | $1.41 | 1d | 1 | 1.47mi |
HOA detail condo
- Monthly dues
- $515 · $6,180/yr
- Assessments
- None detected in remarks — confirm with the listing agent.
Listing history 14 events
-
2026-06-18days on market $384,900 Active 30 DOM
-
2026-06-17days on market $384,900 Active 29 DOM
-
2026-06-16days on market $384,900 Active 28 DOM
-
2026-06-15days on market $384,900 Active 27 DOM
-
2026-06-13days on market $384,900 Active 25 DOM
-
2026-06-13days on market $384,900 Active 24 DOM
-
2026-06-09days on market $384,900 Active 21 DOM
-
2026-06-08days on market $384,900 Active 20 DOM
-
2026-06-07days on market $384,900 Active 19 DOM
-
2026-06-05days on market $384,900 Active 16 DOM
-
2026-06-03days on market $384,900 Active 15 DOM
-
2026-06-02days on market $384,900 Active 14 DOM
-
2026-06-01days on market $384,900 Active 13 DOM
-
2026-05-31days on market $384,900 Active 12 DOM
ⓘ Source: listings_history table (triggers on properties + properties_extension) + one-shot
backfill from property_details.listing_events for pre-trigger history.
Tax reassessment forecast CA · Resets to sale price
- Current annual tax
- $5,857 · $488/mo
- Projected year-2 tax
- $5,857 · $488/mo
- Expected delta
- $0/yr ($0/mo · 0.0%)
ⓘ Screening estimate from a state-policy table — verify with the county assessor before closing.
Climate risk First Street
- Flood 1/10 Low FEMA zone A99 · 0% chance over 30 yrs
- Wildfire 5/10 Major
- Heat 7/10 Severe 7 d/yr ≥103°F today · 15 d/yr by 30 yrs out
- Wind 1/10 Low
- Air quality 10/10 Extreme 29 unhealthy d/yr today · 33 by 30 yrs out
Nearby sold comps map
Loading sold comps map…
Walkable amenities ~0.75 mi
Loading nearby amenities…
Taxation est. · year 1
- Rental income
- $35,003
- − Mortgage interest
- −$21,560
- − Property taxes
- −$5,857
- − Insurance
- −$3,427
- − Repairs & maintenance
- −$2,800
- − Management
- −$2,800
- − HOA
- −$6,180
- − Depreciation
- −$11,197
- Taxable loss
- −$18,818
- Est. tax savings @ 24.0%
- +$4,516
- After-tax cash flow
- $-7,516/yr
For passive investors: Depreciation is non-cash, so a rental often shows a tax loss while cash-flowing — sheltering income. Rental losses are passive: they offset passive income freely, and up to $25,000/yr can offset ordinary (W-2) income if you actively participate and your MAGI is under $100k (phasing out to $0 by $150k); unused losses carry forward. On sale, claimed depreciation is recaptured at up to 25%, and gains may owe capital-gains tax (a 1031 exchange can defer both). Figures are a year-1 estimate at your 24.0% rate — not tax advice; consult a CPA.
Schools (NCES district)
- District
- Natomas Unified
- NCES district ID
- 0600036
- Math proficiency
- 33% ▼ -1.00%
- Reading proficiency
- 60% ▲ 13.00%
- Median HH income
- $67,969
- Composite
- 41.49/100
- National rank
- #3457
- State rank
- #155 of 517 in CA
Livability — Sacramento
- Score
- 71/100
- State rank
- #218
- US rank
- #6957
Category grades
Schools grade is shown separately in the Schools card above.
Census & demographics
- Census place
- Sacramento, CA
- County
- Sacramento County · 1,539,646 people
- City population
- 761,410
- Metro
- Sacramento-Roseville-Folsom, CA
- Population (ZIP)
- 42,004
- Household income
- $114,468
- Rent vs Own
- Severe rent burden
- 1234.0
Population outlook (Sacramento County) Hauer SSP2
- Today (2025)
- 1,660,763 people
- By 2030
- 1,732,990 · +4.3%
- By 2040
- 1,855,755 · +11.7%
- By 2050
- 1,941,335 · +16.9%
- By 2075
- 2,046,162 · +23.2%
- By 2100
- 1,961,444 · +18.1%
Race, ethnicity, and origin ACS 2023
- Neighborhood character
- Highly diverse neighborhood (Simpson 0.78)
- Race & ethnicity
- Asian 30% White 29% Hispanic / Latino 19% Two or more races 15% Black 13%
- Hispanic origin (detail)
- Mexican 15%
- Common ancestry
- Scotch-Irish 2% Italian 1% Romanian 1%
- Foreign-born
- 25% · China, Canada, Vietnam
- Languages at home
- 66% English-only · Other Indo-European 10% Spanish 8% Other Asian/Pacific 4%
Political lean MEDSL · Sacramento
- 2024 margin
- D (+19.7) · D 58.1% · R 38.4% · Other 3.5%
- 2008→2024 swing
- +0.7pp no change · 2008: 19.0pp · 2024: 19.7pp
- All cycles
- 2024: D+19.7 2020: D+25.3 2016: D+23.7 2012: D+16.3 2008: D+19.0
Not yet ingested
- Civics
- —
Market trends
- HPI YoY
- ▲ 9.18%
- Current HPI
- 271.4823
- Rent YoY
- ▲ 1.43%
- Metro
- Sacramento-Roseville-Folsom, CA
- State GDP YoY
- ▲ 3.21%
- F500 in state
- 116
Industry mix (Fortune 500 HQ in CA)
| Industry | F500 HQs | Revenue |
|---|---|---|
| Technology | 27 | $1,492B |
|
||
| Financial Services | 3 | $174B |
|
||
| Retail | 3 | $44B |
|
||
| Insurance | 3 | $26B |
|
||
| Media / Entertainment | 2 | $115B |
|
||
| Pharmaceuticals / Biotech | 2 | $62B |
|
||
Property tax history
+49.9%/yrLatest (2025): $5,857 · -3.7% YoY. Source: county tax records.
Cash-flow waterfall
monthlySold comps — $/sqft
last 12 mo · ≤1 miLoading sold comps…