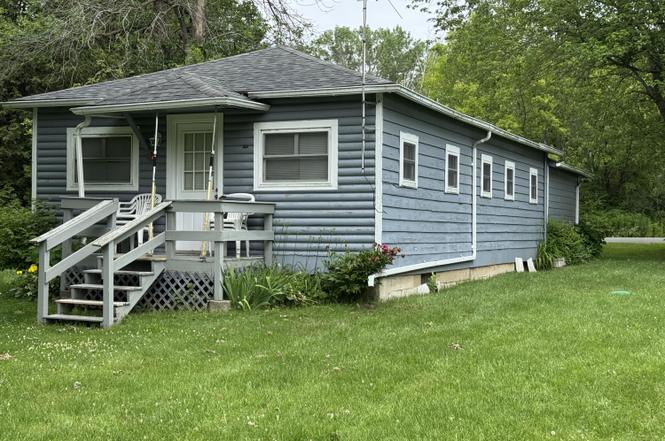
32 Jefferson Rd · Cumberland Head, NY
Flood risk 1/10 · Minimal
- FEMA flood zone
- X (unshaded)
- Chance of flooding over 30 yrs
- 0.0%
- Est. flood insurance / yr
- $507 – $1,088
Fire risk 1/10 · Minimal
- Est. fire insurance / yr
- $691 – $1,283
Heat risk 2/10 · Minimal
- Hot days now (above 94°F)
- 7 days/yr
- Hot days in 30 yrs
- 14 days/yr
Wind risk 1/10 · Minimal
- Chance of severe wind over 30 yrs
- 1.0%
Air-quality risk 2/10 · Minimal
- Unhealthy air days now
- 1 days/yr
- Unhealthy air days in 30 yrs
- 1 days/yr
Risk factors via First Street. Map © Google.
Why this score? — see what drove the B+ grade
The composite is a weighted blend of 9 inputs, each scored 0–100. Each bar is that input's sub-score; the figure is the points it added to the 100-point composite (weight × sub-score).
- Cash flow +30.0/30.0
- ARV discount +15.0/15.0
- 1% rule +10.0/10.0
- DSCR +10.0/10.0
- Schools +4.4/10.0
- Livability +3.5/5.0
- Rent growth +2.5/5.0
- Condition / age +2.5/5.0
- Appreciation +0.0/10.0
$100,000
🖨 Deal sheet (PDF) 📄 Offer letter ✓ Due diligence
Listing remarks
Cute 3 season camp on Cumberlead head with 4 bedrooms and 1 bath would make a great seasonal place Place comes fully furnished and is being sold as is
Key facts
- 8,250 sq ft lot
- Built 1945
- Listed 64 days
Neighborhood map
What this means for you Summary
Snapshot
- This is a 3-bed/1.0-bath single-family listed at $100k.
Deal economics
- At list price, monthly cash flow is $572 ($7k/yr) — positive.
- The deal already cash-flows at list — no discount required.
- Meets the 1% rule at list price ($2k rent vs $100k).
- Recommended offer: $94k (6.0% below list) — sets the bar for market timing.
Location & tenants
- Location reads 69/100 on livability (#473 in NY) — a middle-class / working-renter tenant base. Strengths: crime A+, employment A+, housing A+; Watch: schools D, amenities F, commute F.
- Beekmantown Central School District (rural): math 45% / reading 57% proficiency, ranked #360 of 590 in NY (top 61%) — acceptable for families but not a draw, mixed tenant base, ~2y average lease.
- Market conditions: 184 active listings in the ZIP; 192 units permitted in Clinton County in 2024 (64 in 5+ unit buildings).
Forward outlook
- Local home prices are declining (-3.0%/yr); year-one equity from $691 of loan paydown is wiped out by about $3k of value loss. Plan a longer hold.
- Clinton County population projected at -16% by 2050 — secular population decline; favor cash flow + early exit over multi-decade hold.
- At projected returns (-3.0% appreciation + 3.0% rent growth), your $28k cash investment doubles in ~5 years — after that, you're playing with house money.
Negotiation context
- It's been on market 64 days — a 6% lower offer ($94k) is reasonable based on typical stale-listing flexibility.
- 2 sale attempts with the ask held roughly flat each time — persistent listings suggest the price (not the market) is what's stuck; bring a comps-based counter.
Risks & watch-outs
- Watch-outs: built in 1945 — expect roof / HVAC / electrical / plumbing capex.
Questions for the listing agent
- It's been on market 64 days. Have you received any prior offers? Is the seller open to a 6% concession, seller financing, or rate buy-down credit?
- Built in 1945 — when were the roof, HVAC, electrical panel, plumbing, and water heater last replaced?
- Why hasn't it sold? Are there any deal-killer items the seller is aware of (foundation, flood, title, zoning, code violations)?
- Is there a deadline driving the sale (1031 exchange, divorce, estate, relocation)? That informs how much negotiation room exists.
- Schools are D-rated, which usually means shorter tenancies and higher turnover. Who's the typical renter profile here, and what's been the actual vacancy rate?
- What's the average days-on-market for RENTAL listings here right now (not sales)? A rising rental-DOM trend means longer vacancies and softer asking-rent achievability than the comps imply.
- What's the recent tenant-quality profile in this submarket — average credit score on applications, eviction rate, late-payment / NSF rate, and stable-employment percentage? A property-management company in the area should have these aggregated.
- How much new for-sale + rental construction is in the pipeline within 1–3 miles? Heavy new supply typically softens prices + rents 12–24 months out; constrained supply supports both.
Investment metrics
- 1% rule
- 1.57% ✓
- Cap rate
- 13.15%
- Cash-on-cash
- 24.50%
- DSCR
- 2.09
- GRM
- 5.3
CMA / ARV
- ARV (on-the-fly)
- $168,720
- Comps found
- 6
Show comp detail 6 sales within ~0.75 mi
| Address | Dist | Beds/Ba | Sqft | Sold | Price | $/sf | Match |
|---|---|---|---|---|---|---|---|
| 30 Rocky Point St | 0.07mi | 3/1.0 | 950 (+4%) | 10mo | $128,000 | $135 | 82 |
| 43 Seneca Dr | 0.54mi | 3/1.0 | 911 (-0%) | 4mo | $227,000 | $249 | 71 |
| 15 Mohican Lane Ln | 0.62mi | 3/1.0 | 900 (-1%) | 4mo | $78,000 | $87 | 66 |
| 19 Seneca Dr | 0.58mi | 2/1.0 (-1) | 1,009 (+11%) | 1mo | $226,805 | $225 | 49 |
| 8 Mohawk Road Rd | 0.68mi | 3/1.0 | 1,025 (+12%) | 8mo | $180,000 | $176 | 41 |
| 7 Chenango Road Rd | 0.75mi | 3/1.0 | 1,025 (+12%) | 12mo | $189,995 | $185 | 34 |
Match score weights: distance 35% · size 25% · config 20% · recency 20%. Top-matched comps best support the ARV.
Projected returns pro-forma
-3.0% appreciation · 3.0% rent growth · sell at horizon
- IRR
- 17.9%
- Equity multiple
- 1.72×
- Total profit
- $20,222
- Equity at exit
- $14,910
- IRR
- 26.3%
- Equity multiple
- 3.31×
- Total profit
- $64,546
- Equity at exit
- $8,646
Cash invested: $28,000 (down + closing). Projections, not guarantees.
Landlord ↔ Tenant lean methodology
- Overall (STATE)
- 15 Strongly Tenant-Friendly
- State New York
- 15 Strongly Tenant-Friendly · D+10
- County
- — inherits STATE
- City
- — inherits STATE
ZIP-level market 12901
- Home prices YoY
- -22.5%
- Active inventory
- 184
- Price-to-rent
- 5.3×
Monthly cashflow live
- Estimated rent
- $1,573 medium interval (Pro) →
- Mortgage (P&I)
- −$524
- Tax from tax record
- −$105 /mo · $1,262/yr
- Insurance
- −$42
- HOA
- −$0
- Vacancy / Maint / Mgmt
- −$330
- Net cashflow
- $572
Break-even live
Sensitivity live
| Price | -10% $628 | -5% $600 | +0% $572 | +5% $543 | +10% $515 |
|---|---|---|---|---|---|
| Rent | -10% $447 | -5% $510 | +0% $572 | +5% $634 | +10% $696 |
| Rate | -1.0pp $622 | -0.5pp $597 | base $572 | +0.5pp $546 | +1.0pp $519 |
UW: 25.0% down · 7.5% · 30yr · 1.5% tax · 5.0% vac · 8.0% maint · 8.0% mgmt
Financing live
Cash to close
- Down payment
- $25,000
- Closing costs
- $3,000
- Reserves months
- —
- Total cash needed
- —
Loan-product check · same deal, 3 products live
Conventional
25% down · 7.5% · 30yr
- Down + closing
- —
- Monthly P&I
- —
- Monthly cashflow
- —
- DSCR
- —
- Eligible?
- —
Personal DTI + credit; lowest rate.
DSCR
20% down · 8.5% · 30yr
- Down + closing
- —
- Monthly P&I
- —
- Monthly cashflow
- —
- DSCR
- —
- Eligible?
- —
No personal income docs; deal must DSCR.
Hard money
10% down · 12.0% · 12mo
- Down + closing
- —
- Monthly P&I
- —
- Monthly cashflow
- —
- DSCR
- —
- Eligible?
- —
Short-term bridge; refi at stabilization.
Listing history 4 events
-
2026-01-06status Pending
-
2025-11-21status Active
-
2025-07-15status Pending
-
2025-06-26$100,000 Active
ⓘ Source: listings_history table (triggers on properties + properties_extension) + one-shot
backfill from property_details.listing_events for pre-trigger history.
Tax reassessment forecast NY · Partial reset (capped growth)
- Current annual tax
- $1,262 · $105/mo
- Projected year-2 tax
- $1,476 · $123/mo
- Expected delta
- +$214/yr (+$18/mo · 16.9%)
ⓘ Screening estimate from a state-policy table — verify with the county assessor before closing.
Climate risk First Street
- Flood 1/10 Low FEMA zone X (unshaded) · 0% chance over 30 yrs
- Wildfire 1/10 Low
- Heat 2/10 Low 7 d/yr ≥94°F today · 14 d/yr by 30 yrs out
- Wind 1/10 Low 100% chance of damaging wind over 30 yrs
- Air quality 2/10 Low 1 unhealthy d/yr today · 1 by 30 yrs out
Nearby sold comps map
Loading sold comps map…
Walkable amenities ~0.75 mi
Loading nearby amenities…
Taxation est. · year 1
- Rental income
- $18,882
- − Mortgage interest
- −$5,602
- − Property taxes
- −$1,262
- − Insurance
- −$500
- − Repairs & maintenance
- −$1,511
- − Management
- −$1,511
- − Depreciation
- −$2,909
- Taxable income
- $5,587
- Est. tax owed @ 24.0%
- −$1,341
- After-tax cash flow
- $5,520/yr
For passive investors: Depreciation is non-cash, so a rental often shows a tax loss while cash-flowing — sheltering income. Rental losses are passive: they offset passive income freely, and up to $25,000/yr can offset ordinary (W-2) income if you actively participate and your MAGI is under $100k (phasing out to $0 by $150k); unused losses carry forward. On sale, claimed depreciation is recaptured at up to 25%, and gains may owe capital-gains tax (a 1031 exchange can defer both). Figures are a year-1 estimate at your 24.0% rate — not tax advice; consult a CPA.
Schools (NCES district)
- District
- Beekmantown Central School District
- NCES district ID
- 3604290
- Math proficiency
- 45% ▲ 2.00%
- Reading proficiency
- 57% ▲ 18.00%
- Median HH income
- $53,577
- Composite
- 43.91/100
- National rank
- #2914
- State rank
- #360 of 590 in NY
Livability — Cumberland Head
- Score
- 69/100
- State rank
- #473
- US rank
- #8361
Category grades
Schools grade is shown separately in the Schools card above.
Census & demographics
- Census place
- Cumberland Head, NY
- Population (ZIP)
- 32,012
Population outlook (Clinton County) Hauer SSP2
- Today (2025)
- 78,791 people
- By 2030
- 76,848 · -2.5%
- By 2040
- 71,579 · -9.2%
- By 2050
- 66,471 · -15.6%
- By 2075
- 57,361 · -27.2%
- By 2100
- 47,232 · -40.1%
Race, ethnicity, and origin ACS 2023
- Neighborhood character
- Predominantly White (87%)
- Race & ethnicity
- White 87% Two or more races 5% Hispanic / Latino 4% Black 3% Asian 3%
- Common ancestry
- Lithuanian 15% Romanian 3% Slovak 2%
- Foreign-born
- 6% · Canada, China
- Languages at home
- 92% English-only · Spanish 2% French/Haitian/Cajun 2% Other Indo-European 1%
Political lean MEDSL · Clinton
- 2024 margin
- Toss-up / Even · D 48.9% · R 51.1%
- 2008→2024 swing
- -25.1pp toward R · 2008: 22.9pp · 2024: -2.2pp
- All cycles
- 2024: R+2.2 2020: D+5.2 2016: D+0.9 2012: D+25.6 2008: D+22.9
Not yet ingested
- Civics
- —
Market trends
- HPI YoY
- ▼ -73.55%
- Current HPI
- 252.8692
- Rent YoY
- —
- Metro
- —
- State GDP YoY
- ▲ 2.60%
- F500 in state
- 92
Industry mix (Fortune 500 HQ in NY)
| Industry | F500 HQs | Revenue |
|---|---|---|
| Financial Services | 10 | $950B |
|
||
| Consumer Goods | 9 | $162B |
|
||
| Insurance | 4 | $225B |
|
||
| Telecommunications | 2 | $144B |
|
||
| Pharmaceuticals | 2 | $112B |
|
||
| Media / Entertainment | 2 | $69B |
|
||
Price history
4 events — show timeline
- 2026-01-06 Pending — ACVMLS
- 2025-11-21 Relisted — ACVMLS
- 2025-07-15 Pending — ACVMLS
- 2025-06-26 Listed $100,000 ACVMLS
Property tax history
+0.3%/yrLatest (2025): $1,262 · +9.3% YoY. Source: county tax records.
Cash-flow waterfall
monthlySold comps — $/sqft
last 12 mo · ≤1 miLoading sold comps…