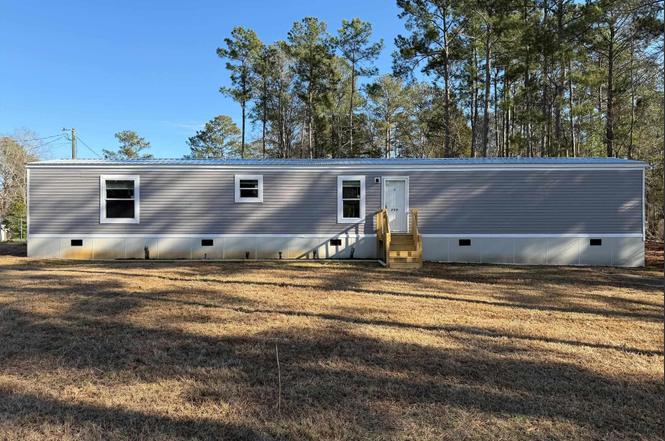
259 Gravel Rd · Prosperity, SC
Flood risk 1/10 · Minimal
- FEMA flood zone
- X (unshaded)
- Chance of flooding over 30 yrs
- 0.0%
- Est. flood insurance / yr
- $507 – $1,088
Fire risk 3/10 · Minor
- Est. fire insurance / yr
- $783 – $1,453
Heat risk 6/10 · Moderate
- Hot days now (above 108°F)
- 7 days/yr
- Hot days in 30 yrs
- 16 days/yr
Wind risk 6/10 · Moderate
- Chance of severe wind over 30 yrs
- 56.0%
Air-quality risk 3/10 · Minor
- Unhealthy air days now
- 3 days/yr
- Unhealthy air days in 30 yrs
- 3 days/yr
Risk factors via First Street. Map © Google.
Why this score? — see what drove the C+ grade
The composite is a weighted blend of 9 inputs, each scored 0–100. Each bar is that input's sub-score; the figure is the points it added to the 100-point composite (weight × sub-score).
- Cash flow +28.0/30.0
- DSCR +9.9/10.0
- ARV discount +7.5/15.0
- 1% rule +6.5/10.0
- Livability +3.6/5.0
- Schools +3.0/10.0
- Rent growth +2.5/5.0
- Condition / age +2.5/5.0
- Appreciation +0.0/10.0
$172,900
🖨 Deal sheet (PDF) 📄 Offer letter ✓ Due diligence
Listing remarks
Brand new 2026 Hamilton Faith 3-bedroom, 2-bath manufactured home (16’ x 76’) on a spacious 1.12-acre level lot in a desirable Lake Murray community. Just a short walk to the lake, this home offers a smart, modern layout perfect for first-time buyers, growing families, or those looking to downsize with style. Enjoy the freedom of no HOA, with plenty of room to build a workshop, garage, or extra outbuildings. Conveniently located only 15 minutes from Prosperity for shopping and dining, and zoned for Newberry schools. Disclaimer: CMLS has not reviewed and, therefore, does not endorse vendors who may appear in listings.
Key facts
- Freedom of no hoa
- Spacious level lot
- 1.12 acre lot
Tags
Property features AI
Exterior
- Utilities: Septic sewer
- Home design: Single-family property; Main entry on the main level
- Construction: Crawlspace foundation
- Exterior features: Vinyl exterior; Gravel road access; Property on approximately 1.12 acres; Private well
Interior
- Bedrooms: Main-level primary bedroom
- Bathrooms: Two full bathrooms
- Interior features: Central heating; Central cooling
Neighborhood map
What this means for you Summary
Snapshot
- This is a 3-bed/2.0-bath other listed at $173k.
Deal economics
- At list price, monthly cash flow is $537 ($6k/yr) — positive.
- The deal already cash-flows at list — no discount required.
- Meets the 1% rule at list price ($2k rent vs $173k).
- Recommended offer: $163k (6.0% below list) — sets the bar for market timing.
Location & tenants
- Location reads 71/100 on livability (#48 in SC) — a middle-class / working-renter tenant base. Strengths: cost of living A+, health & safety A+, housing B+; Watch: employment D+, amenities F, commute F.
- Newberry 01 (rural): math 32% / reading 40% proficiency, ranked #40 of 80 in SC (top 50%) — families likely to look elsewhere, expect single-tenant / working-renter base with shorter leases; 60% free/reduced lunch — lower-income household profile, screen leases tightly.
- Zoned schools: Little Mountain Elementary (math 52% / reading 52%, grade C-, #145 of 597 statewide, top 26%, 396 students, 100% FRL); Mid-Carolina High (math 67% / reading 89%, grade A-, #27 of 196 statewide, top 13%, 723 students, 60% FRL) — zoned schools average 80% FRL vs 60% district-wide (20 pts higher); higher-poverty schools than district average — tighter screening recommended.
- Zoned-school proficiency averages 65% at this address vs 36% district-wide (+29 pts) — the actual schools serving this property are materially stronger than the Newberry 01 average implies; a family-tenant draw the district grade alone would hide.
- Market conditions: 154 active listings in the ZIP; 155 units permitted in Newberry County in 2024 (0 in 5+ unit buildings).
Forward outlook
- Local home prices are declining (-3.0%/yr); year-one equity from $1k of loan paydown is wiped out by about $5k of value loss. Plan a longer hold.
- Newberry County population projected to shrink 6% by 2050 — rents likely to lag national; underwrite the cash flow, not the appreciation.
- At projected returns (-3.0% appreciation + 3.0% rent growth), your $48k cash investment doubles in ~9 years — after that, you're playing with house money.
Negotiation context
- It's been on market 84 days — a 6% lower offer ($163k) is reasonable based on typical stale-listing flexibility.
- 3 sale attempts; this cycle's ask has dropped $22k (11%) from the opening price — seller is motivated, your offer sets the floor, not the list.
- Current owner paid $67k; list at $173k implies a 158% gain — meaningful room to come down on a strong offer.
Risks & watch-outs
- Climate carrying-cost: major wind risk, 56% chance of damaging wind over 30y; extreme-heat days projected 7→16/yr by 2055 (HVAC capex compounding) — expect insurance premiums to compound above CPI over the hold.
Questions for the listing agent
- It's been on market 84 days. Have you received any prior offers? Is the seller open to a 6% concession, seller financing, or rate buy-down credit?
- Why hasn't it sold? Are there any deal-killer items the seller is aware of (foundation, flood, title, zoning, code violations)?
- Is there a deadline driving the sale (1031 exchange, divorce, estate, relocation)? That informs how much negotiation room exists.
- What's the average days-on-market for RENTAL listings here right now (not sales)? A rising rental-DOM trend means longer vacancies and softer asking-rent achievability than the comps imply.
- What's the recent tenant-quality profile in this submarket — average credit score on applications, eviction rate, late-payment / NSF rate, and stable-employment percentage? A property-management company in the area should have these aggregated.
- How much new for-sale + rental construction is in the pipeline within 1–3 miles? Heavy new supply typically softens prices + rents 12–24 months out; constrained supply supports both.
Investment metrics
- 1% rule
- 1.15% ✓
- Cap rate
- 10.02%
- Cash-on-cash
- 13.31%
- DSCR
- 1.59
- GRM
- 7.2
CMA / ARV
No comps found within radius.
Projected returns pro-forma
-3.0% appreciation · 3.0% rent growth · sell at horizon
- IRR
- 3.3%
- Equity multiple
- 1.13×
- Total profit
- $6,106
- Equity at exit
- $25,780
- IRR
- 12.8%
- Equity multiple
- 2.01×
- Total profit
- $49,068
- Equity at exit
- $14,949
Cash invested: $48,412 (down + closing). Projections, not guarantees.
Landlord ↔ Tenant lean methodology
- Overall (STATE)
- 90 Strongly Landlord-Friendly
- State South Carolina
- 90 Strongly Landlord-Friendly · R+6
- County
- — inherits STATE
- City
- — inherits STATE
ZIP-level market 29127
- Home prices YoY
- -33.4%
- Active inventory
- 154
- Price-to-rent
- 7.2×
Monthly cashflow live
- Estimated rent
- $1,992 medium interval (Pro) →
- Mortgage (P&I)
- −$907
- Tax from tax record
- −$58 /mo · $693/yr
- Insurance
- −$72
- HOA
- −$0
- Vacancy / Maint / Mgmt
- −$418
- Net cashflow
- $537
Break-even live
Sensitivity live
| Price | -10% $635 | -5% $586 | +0% $537 | +5% $488 | +10% $439 |
|---|---|---|---|---|---|
| Rent | -10% $379 | -5% $458 | +0% $537 | +5% $615 | +10% $694 |
| Rate | -1.0pp $624 | -0.5pp $581 | base $537 | +0.5pp $492 | +1.0pp $446 |
UW: 25.0% down · 7.5% · 30yr · 1.5% tax · 5.0% vac · 8.0% maint · 8.0% mgmt
Financing live
Cash to close
- Down payment
- $43,225
- Closing costs
- $5,187
- Reserves months
- —
- Total cash needed
- —
Loan-product check · same deal, 3 products live
Conventional
25% down · 7.5% · 30yr
- Down + closing
- —
- Monthly P&I
- —
- Monthly cashflow
- —
- DSCR
- —
- Eligible?
- —
Personal DTI + credit; lowest rate.
DSCR
20% down · 8.5% · 30yr
- Down + closing
- —
- Monthly P&I
- —
- Monthly cashflow
- —
- DSCR
- —
- Eligible?
- —
No personal income docs; deal must DSCR.
Hard money
10% down · 12.0% · 12mo
- Down + closing
- —
- Monthly P&I
- —
- Monthly cashflow
- —
- DSCR
- —
- Eligible?
- —
Short-term bridge; refi at stabilization.
Listing history 26 events
-
2026-06-21days on market $172,900 Active 84 DOM
-
2026-06-18days on market $172,900 Active 81 DOM
-
2026-06-17days on market $172,900 Active 80 DOM
-
2026-06-16days on market $172,900 Active 79 DOM
-
2026-06-15days on market $172,900 Active 78 DOM
-
2026-06-14days on market $172,900 Active 76 DOM
-
2026-06-13days on market $172,900 Active 75 DOM
-
2026-06-09days on market $172,900 Active 72 DOM
-
2026-06-08days on market $172,900 Active 71 DOM
-
2026-06-07days on market $172,900 Active 70 DOM
-
2026-06-05days on market $172,900 Active 67 DOM
-
2026-06-03days on market $172,900 Active 66 DOM
-
2026-06-03days on market $172,900 Active 65 DOM
-
2026-06-01days on market $172,900 Active 64 DOM
-
2026-05-31days on market $172,900 Active 63 DOM
-
2026-05-11status Active
-
2026-03-20status Pending
-
2026-03-05price $172,900
-
2026-02-23price $175,900
-
2026-02-05$194,900 Active
-
2025-12-02historical
-
2025-09-15status Pending
-
2025-09-10price $185,900
-
2025-08-28price $199,900
-
2025-08-11$229,900 Active
-
2025-07-16soldstatus $67,000
ⓘ Source: listings_history table (triggers on properties + properties_extension) + one-shot
backfill from property_details.listing_events for pre-trigger history.
Tax reassessment forecast SC · Resets to sale price
- Current annual tax
- $693 · $58/mo
- Projected year-2 tax
- $986 · $82/mo
- Expected delta
- +$292/yr (+$24/mo · 42.1%)
ⓘ Screening estimate from a state-policy table — verify with the county assessor before closing.
Climate risk First Street
- Flood 1/10 Low FEMA zone X (unshaded) · 0% chance over 30 yrs
- Wildfire 3/10 Moderate
- Heat 6/10 Major 7 d/yr ≥108°F today · 16 d/yr by 30 yrs out
- Wind 6/10 Major 56% chance of damaging wind over 30 yrs
- Air quality 3/10 Moderate 3 unhealthy d/yr today · 3 by 30 yrs out
Nearby sold comps map
Loading sold comps map…
Walkable amenities ~0.75 mi
Loading nearby amenities…
Taxation est. · year 1
- Rental income
- $23,899
- − Mortgage interest
- −$9,685
- − Property taxes
- −$693
- − Insurance
- −$864
- − Repairs & maintenance
- −$1,912
- − Management
- −$1,912
- − Depreciation
- −$5,030
- Taxable income
- $3,802
- Est. tax owed @ 24.0%
- −$913
- After-tax cash flow
- $5,529/yr
For passive investors: Depreciation is non-cash, so a rental often shows a tax loss while cash-flowing — sheltering income. Rental losses are passive: they offset passive income freely, and up to $25,000/yr can offset ordinary (W-2) income if you actively participate and your MAGI is under $100k (phasing out to $0 by $150k); unused losses carry forward. On sale, claimed depreciation is recaptured at up to 25%, and gains may owe capital-gains tax (a 1031 exchange can defer both). Figures are a year-1 estimate at your 24.0% rate — not tax advice; consult a CPA.
Schools (NCES district)
- District
- Newberry 01
- NCES district ID
- 4503030
- Math proficiency
- 32% ▼ -12.00%
- Reading proficiency
- 40% ▼ -1.00%
- Median HH income
- $40,892
- Composite
- 30.28/100
- National rank
- #6282
- State rank
- #40 of 80 in SC
Livability — Prosperity
- Score
- 71/100
- State rank
- #48
- US rank
- #6895
Category grades
Schools grade is shown separately in the Schools card above.
Census & demographics
- Population (ZIP)
- 9,215
Population outlook (Newberry County) Hauer SSP2
- Today (2025)
- 38,350 people
- By 2030
- 38,259 · -0.2%
- By 2040
- 37,487 · -2.3%
- By 2050
- 36,219 · -5.6%
- By 2075
- 32,400 · -15.5%
- By 2100
- 27,201 · -29.1%
Race, ethnicity, and origin ACS 2023
- Neighborhood character
- Predominantly White (72%)
- Race & ethnicity
- White 72% Black 24% Two or more races 3% Hispanic / Latino 2%
- Common ancestry
- Serbian 2% Slovak 1% Romanian 1%
- Foreign-born
- 1% · Canada, Guatemala
- Languages at home
- 98% English-only · Spanish 2%
Political lean MEDSL · Newberry
- 2024 margin
- Solid R (+34.3) · D 32.2% · R 66.6% · Other 1.2%
- 2008→2024 swing
- -16.8pp toward R · 2008: -17.6pp · 2024: -34.3pp
- All cycles
- 2024: R+34.3 2020: R+24.1 2016: R+22.6 2012: R+14.3 2008: R+17.6
Not yet ingested
- Civics
- —
Market trends
- HPI YoY
- ▼ -102.95%
- Current HPI
- 205.2888
- Rent YoY
- —
- Metro
- —
- State GDP YoY
- ▲ 4.51%
- F500 in state
- 2
Industry mix (Fortune 500 HQ in SC)
| Industry | F500 HQs | Revenue |
|---|---|---|
| Packaging | 1 | $7B |
|
||
Price history
+158.1% since first listed11 events — show timeline
- 2026-05-11 Relisted — Consolidated MLS
- 2026-03-20 Pending — Consolidated MLS
- 2026-03-05 Price Changed $172,900 Consolidated MLS
- 2026-02-23 Price Changed $175,900 Consolidated MLS
- 2026-02-05 Listed $194,900 Consolidated MLS
- 2025-12-02 Delisted — Consolidated MLS
- 2025-09-15 Pending — Consolidated MLS
- 2025-09-10 Price Changed $185,900 Consolidated MLS
- 2025-08-28 Price Changed $199,900 Consolidated MLS
- 2025-08-11 Listed $229,900 Consolidated MLS
- 2025-07-16 Sold (Public Records) $67,000 Public Records
Property tax history
+7.5%/yrLatest (2025): $693 · +12.2% YoY. Source: county tax records.
Cash-flow waterfall
monthlySold comps — $/sqft
last 12 mo · ≤1 miLoading sold comps…