2337 Pendleton St · Columbia, SC
Flood risk 1/10 · Minimal
- FEMA flood zone
- X (unshaded)
- Chance of flooding over 30 yrs
- 0.0%
- Est. flood insurance / yr
- $507 – $1,088
Fire risk 1/10 · Minimal
- Est. fire insurance / yr
- $783 – $1,453
Heat risk 6/10 · Moderate
- Hot days now (above 109°F)
- 7 days/yr
- Hot days in 30 yrs
- 16 days/yr
Wind risk 6/10 · Moderate
- Chance of severe wind over 30 yrs
- 66.0%
Air-quality risk 3/10 · Minor
- Unhealthy air days now
- 2 days/yr
- Unhealthy air days in 30 yrs
- 2 days/yr
Risk factors via First Street. Map © Google.
Why this score? — see what drove the B grade
The composite is a weighted blend of 9 inputs, each scored 0–100. Each bar is that input's sub-score; the figure is the points it added to the 100-point composite (weight × sub-score).
- Cash flow +30.0/30.0
- 1% rule +10.0/10.0
- DSCR +10.0/10.0
- ARV discount +7.5/15.0
- Rent growth +4.2/5.0
- Livability +3.9/5.0
- Schools +2.6/10.0
- Condition / age +2.5/5.0
- Appreciation +0.0/10.0
$80,000
🖨 Deal sheet (PDF) 📄 Offer letter ✓ Due diligence
Listing remarks
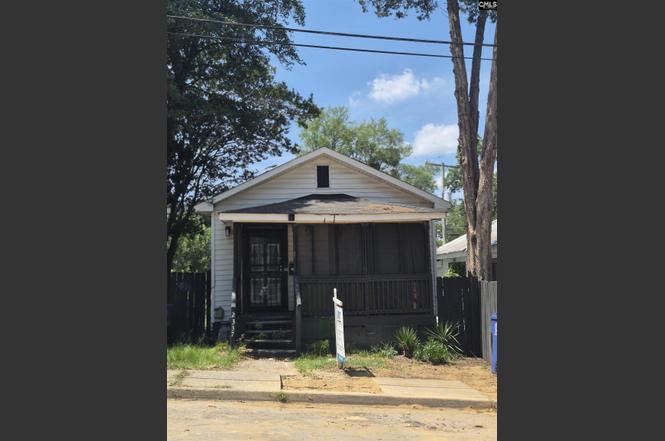
Investor Special! Don't miss this incredible opportunity to transform a hidden gem in the historic Valley Park community. This 1-bedroom, 1-bath ranch-style home is full of potential and ready for your vision. Whether you're an investor looking to add to your portfolio, a flipper seeking your next project, or a buyer eager to create a charming home, this property offers endless possibilities. Location is everything, and this home delivers! Enjoy the convenience of being within walking distance of Martin Luther King Park and just minutes from the vibrant Five Points district, known for its unique shopping, dining, and entertainment options. Centrally located, the property is also less than
Key facts
- 3,179 sq ft lot
- Built 1915
- Listed 6 days
Tags
Property features AI
Exterior
- Utilities: Public sewer; Public water
- Home design: Single-story home
- Construction: Crawlspace foundation
- Exterior features: Aluminum and vinyl exterior; Paved road access; Public water
Interior
- Bedrooms: Master bedroom on the main level
- Flooring: Laminate flooring
- Bathrooms: One full bathroom
- Heating & cooling: Gas heating on the first level; Window air conditioning units
- Interior features: Two fireplaces; Ceiling fan in living area; Laminate flooring in living area
Neighborhood map
What this means for you Summary
Snapshot
- This is a 2-bed/1.0-bath single-family listed at $80k.
Deal economics
- At list price, monthly cash flow is $587 ($7k/yr) — positive.
- The deal already cash-flows at list — no discount required.
- Meets the 1% rule at list price ($1k rent vs $80k).
- Cap rate 15.1% vs local median 5.0% in Columbia — top-decile yield for the area; either an underpriced asset or a hidden risk that comps aren't pricing in. Stress-test before assuming the spread holds.
Location & tenants
- Location reads 78/100 on livability (#18 in SC, #2,436 nationally) — a middle-class / working-renter tenant base. Strengths: amenities A+, commute A+, cost of living A+; Watch: employment D, crime F.
- Richland 01 (urban): math 26% / reading 36% proficiency, ranked #54 of 80 in SC (top 68%) — families likely to look elsewhere, expect single-tenant / working-renter base with shorter leases; 64% free/reduced lunch — lower-income household profile, screen leases tightly.
- Zoned schools: A. C. Moore Elementary (math 52% / reading 47%, grade D, #168 of 597 statewide, top 31%, 204 students, 100% FRL); Dreher High (math 47% / reading 92%, grade B, #60 of 196 statewide, top 32%, 1,150 students, 100% FRL) — zoned schools average 100% FRL vs 64% district-wide (36 pts higher); higher-poverty schools than district average — tighter screening recommended.
- Zoned-school proficiency averages 60% at this address vs 31% district-wide (+28 pts) — the actual schools serving this property are materially stronger than the Richland 01 average implies; a family-tenant draw the district grade alone would hide.
- Market conditions: Rents rising fast (+7.0%/yr); 150 active listings in the ZIP; 27 comparable units currently listed for rent nearby; rentals at typical pace (median 25d on market — plan ~3-4 weeks tenant-placement turnaround); 3,472 units permitted in Richland County in 2024 (1,096 in 5+ unit buildings).
Forward outlook
- Local home prices are declining (-3.0%/yr); year-one equity from $553 of loan paydown is wiped out by about $2k of value loss. Plan a longer hold.
- Richland County population projected at +30% by 2050 — long-run rental-demand tailwind backs the buy-and-hold thesis.
- At projected returns (-3.0% appreciation + 7.0% rent growth), your $22k cash investment doubles in ~4 years — after that, you're playing with house money.
Negotiation context
- Only 6 days on market — expect competitive offers; lowballing is unlikely to land.
Risks & watch-outs
- Watch-outs: built in 1915 — expect roof / HVAC / electrical / plumbing capex.
- Climate carrying-cost: major wind risk, 66% chance of damaging wind over 30y; extreme-heat days projected 7→16/yr by 2055 (HVAC capex compounding) — expect insurance premiums to compound above CPI over the hold.
Questions for the listing agent
- Built in 1915 — when were the roof, HVAC, electrical panel, plumbing, and water heater last replaced?
- Is there a deadline driving the sale (1031 exchange, divorce, estate, relocation)? That informs how much negotiation room exists.
- Schools are D-rated, which usually means shorter tenancies and higher turnover. Who's the typical renter profile here, and what's been the actual vacancy rate?
- Crime grade is F in this area — have there been break-ins, vandalism, or insurance claims at this property in the last 3 years? What carrier currently insures it and at what premium?
- What's the average days-on-market for RENTAL listings here right now (not sales)? A rising rental-DOM trend means longer vacancies and softer asking-rent achievability than the comps imply.
- What's the recent tenant-quality profile in this submarket — average credit score on applications, eviction rate, late-payment / NSF rate, and stable-employment percentage? A property-management company in the area should have these aggregated.
- How much new for-sale + rental construction is in the pipeline within 1–3 miles? Heavy new supply typically softens prices + rents 12–24 months out; constrained supply supports both.
Investment metrics
- 1% rule
- 1.72% ✓
- Cap rate
- 15.10%
- Cash-on-cash
- 31.45%
- DSCR
- 2.40
- GRM
- 4.8
CMA / ARV
No comps found within radius.
Projected returns pro-forma
-3.0% appreciation · 6.95% rent growth · sell at horizon
- IRR
- 30.5%
- Equity multiple
- 2.34×
- Total profit
- $30,089
- Equity at exit
- $11,928
- IRR
- 39.8%
- Equity multiple
- 5.45×
- Total profit
- $99,578
- Equity at exit
- $6,917
Cash invested: $22,400 (down + closing). Projections, not guarantees.
Landlord ↔ Tenant lean methodology
- Overall (STATE)
- 90 Strongly Landlord-Friendly
- State South Carolina
- 90 Strongly Landlord-Friendly · R+6
- County
- — inherits STATE
- City
- — inherits STATE
ZIP-level market 29205
- Rents YoY
- 7.0%
- Active inventory
- 150
- Price-to-rent
- 4.8×
Monthly cashflow live
- Estimated rent
- $1,375 high interval (Pro) →
- Mortgage (P&I)
- −$420
- Tax from tax record
- −$46 /mo · $554/yr
- Insurance
- −$33
- HOA
- −$0
- Vacancy / Maint / Mgmt
- −$289
- Net cashflow
- $587
Break-even live
Sensitivity live
| Price | -10% $632 | -5% $610 | +0% $587 | +5% $564 | +10% $542 |
|---|---|---|---|---|---|
| Rent | -10% $478 | -5% $533 | +0% $587 | +5% $641 | +10% $696 |
| Rate | -1.0pp $627 | -0.5pp $607 | base $587 | +0.5pp $566 | +1.0pp $545 |
UW: 25.0% down · 7.5% · 30yr · 1.5% tax · 5.0% vac · 8.0% maint · 8.0% mgmt
Financing live
Cash to close
- Down payment
- $20,000
- Closing costs
- $2,400
- Reserves months
- —
- Total cash needed
- —
Loan-product check · same deal, 3 products live
Conventional
25% down · 7.5% · 30yr
- Down + closing
- —
- Monthly P&I
- —
- Monthly cashflow
- —
- DSCR
- —
- Eligible?
- —
Personal DTI + credit; lowest rate.
DSCR
20% down · 8.5% · 30yr
- Down + closing
- —
- Monthly P&I
- —
- Monthly cashflow
- —
- DSCR
- —
- Eligible?
- —
No personal income docs; deal must DSCR.
Hard money
10% down · 12.0% · 12mo
- Down + closing
- —
- Monthly P&I
- —
- Monthly cashflow
- —
- DSCR
- —
- Eligible?
- —
Short-term bridge; refi at stabilization.
Rent comps 27 comps
| Address | Beds | Baths | Sqft | Rent | $/sqft | DOM | Units | Dist |
|---|---|---|---|---|---|---|---|---|
| 2347 Stark St Columbia, SC | 2.0 | 1.0 | 876 | $1,100 | $1.26 | 24d | 1 | 0.05mi |
| 2229 Greene St Columbia, SC | 3.0 | 2.0 | 1050 | $1,695 | $1.61 | 20d | 1 | 0.20mi |
| 2223 Greene St Unit 2223 Columbia, SC | 1.0 | 1.0 | 655 | $795 | $1.21 | 24d | 1 | 0.21mi |
| 2455 Gervais St Unit B Columbia, SC | 2.0 | 1.0 | 650 | $1,100 | $1.69 | 24d | 1 | 0.25mi |
| 2009 Greene St #201 Columbia, SC | 1.0 | 1.0 | 625 | $1,200 | $1.92 | 15d | 1 | 0.41mi |
| 1012 Laurens St Columbia, SC | 2.0 | 1.0 | 750 | $1,900 | $2.53 | 12d | 1 | 0.42mi |
| 2002 Greene St Columbia, SC | 2.0 | 1.0–2.0 | 795 | $1,325 | $1.67 | 15d | 1 | 0.45mi |
| 2710 Preston St Columbia, SC | 2.0 | 1.0 | 1000 | $1,495 | $1.50 | 24d | 1 | 0.57mi |
| 2508 Laurel St Unit B Columbia, SC | 2.0 | 1.0 | 750 | $950 | $1.27 | 24d | 1 | 0.74mi |
| 2413 Laurel St Unit C Columbia, SC | 2.0 | 1.0 | 800 | $900 | $1.12 | 24d | 1 | 0.77mi |
| 1421 Shirley St Columbia, SC | 1.0 | 1.0 | 750 | $750 | $1.00 | 15d | 1 | 0.83mi |
| 1520 Senate St Columbia, SC | 2.0 | 1.5 | 1045 | $2,300 | $2.20 | 24d | 1 | 0.85mi |
| 3111 Kline St Columbia, SC | 2.0 | 2.0 | 950 | $1,850 | $1.95 | 24d | 1 | 0.94mi |
| 209 S Harden St Unit 04 Columbia, SC | 2.0 | 1.0 | 800 | $1,050 | $1.31 | 24d | 1 | 1.09mi |
| 1230 Pendleton St Columbia, SC | 1.0–2.0 | 1.0 | 702 | $1,500 | $2.14 | 15d | 9 | 1.12mi |
| 2511 Chestnut St Columbia, SC | 2.0 | 1.0 | 928 | $1,300 | $1.40 | 15d | 1 | 1.12mi |
| 318 S Woodrow St Columbia, SC | 2.0 | 1.0 | 1103 | $1,700 | $1.54 | 24d | 1 | 1.23mi |
| 1155 Lady St Columbia, SC | 2.0 | 1.0–2.0 | 687 | $2,300 | $3.35 | 15d | 8 | 1.26mi |
| 601 Main St Columbia, SC | 1.0–2.0 | 1.0–2.0 | 1244 | $2,500 | $2.01 | 15d | 2 | 1.29mi |
| 601 Main St Columbia, SC | 1.0–2.0 | 1.0–2.0 | 1098 | $2,500 | $2.28 | 24d | 2 | 1.29mi |
| 2225 Waites Rd Unit 2225A Columbia, SC | 2.0 | 1.0 | 714 | $1,100 | $1.54 | 24d | 1 | 1.30mi |
| 3125 Heyward St Unit B Columbia, SC | 2.0 | 1.0 | 1100 | $1,600 | $1.45 | 24d | 1 | 1.33mi |
| 1930 Marion St Columbia, SC | 2.0 | 1.0 | 612 | $1,500 | $2.45 | 12d | 31 | 1.34mi |
| 2834 Keats St Columbia, SC | 3.0 | 2.0 | 921 | $2,250 | $2.44 | 15d | 1 | 1.35mi |
| 3202 Colin Kelly Dr Columbia, SC | 2.0 | 1.0 | 756 | $825 | $1.09 | 24d | 1 | 1.39mi |
| 3232 Brookwood Ct Unit A Columbia, SC | 2.0 | 1.0 | 800 | $1,000 | $1.25 | 24d | 1 | 1.43mi |
| 334 S Bull St Columbia, SC | 2.0 | 1.0 | 715 | $1,025 | $1.43 | 24d | 1 | 1.45mi |
Listing history 5 events
-
2026-06-21days on market $80,000 Active 6 DOM
-
2026-06-18days on market $80,000 Active 3 DOM
-
2026-06-17days on market $80,000 Active 2 DOM
-
2026-06-15remarks 699-char remark
-
2026-06-15$80,000 Active 1 DOM
ⓘ Source: listings_history table (triggers on properties + properties_extension) + one-shot
backfill from property_details.listing_events for pre-trigger history.
Tax reassessment forecast SC · Resets to sale price
- Current annual tax
- $554 · $46/mo
- Projected year-2 tax
- $554 · $46/mo
- Expected delta
- $0/yr ($0/mo · 0.0%)
ⓘ Screening estimate from a state-policy table — verify with the county assessor before closing.
Climate risk First Street
- Flood 1/10 Low FEMA zone X (unshaded) · 0% chance over 30 yrs
- Wildfire 1/10 Low
- Heat 6/10 Major 7 d/yr ≥109°F today · 16 d/yr by 30 yrs out
- Wind 6/10 Major 66% chance of damaging wind over 30 yrs
- Air quality 3/10 Moderate 2 unhealthy d/yr today · 2 by 30 yrs out
Nearby sold comps map
Loading sold comps map…
Walkable amenities ~0.75 mi
Loading nearby amenities…
Taxation est. · year 1
- Rental income
- $16,496
- − Mortgage interest
- −$4,481
- − Property taxes
- −$554
- − Insurance
- −$400
- − Repairs & maintenance
- −$1,320
- − Management
- −$1,320
- − Depreciation
- −$2,327
- Taxable income
- $6,094
- Est. tax owed @ 24.0%
- −$1,463
- After-tax cash flow
- $5,581/yr
For passive investors: Depreciation is non-cash, so a rental often shows a tax loss while cash-flowing — sheltering income. Rental losses are passive: they offset passive income freely, and up to $25,000/yr can offset ordinary (W-2) income if you actively participate and your MAGI is under $100k (phasing out to $0 by $150k); unused losses carry forward. On sale, claimed depreciation is recaptured at up to 25%, and gains may owe capital-gains tax (a 1031 exchange can defer both). Figures are a year-1 estimate at your 24.0% rate — not tax advice; consult a CPA.
Schools (NCES district)
- District
- Richland 01
- NCES district ID
- 4503360
- Math proficiency
- 26% ▼ -7.00%
- Reading proficiency
- 36% ▼ -5.00%
- Median HH income
- $38,931
- Composite
- 25.94/100
- National rank
- #7335
- State rank
- #54 of 80 in SC
Livability — Columbia
- Score
- 78/100
- State rank
- #18
- US rank
- #2436
Category grades
Schools grade is shown separately in the Schools card above.
Census & demographics
- Census place
- Columbia, SC
- County
- Richland County · 389,530 people
- City population
- 335,994
- Metro
- Columbia, SC
- Population (ZIP)
- 22,223
- Household income
- $64,231
- Rent vs Own
- Severe rent burden
- 1372.0
Population outlook (Richland County) Hauer SSP2
- Today (2025)
- 459,667 people
- By 2030
- 487,524 · +6.1%
- By 2040
- 542,035 · +17.9%
- By 2050
- 595,371 · +29.5%
- By 2075
- 732,998 · +59.5%
- By 2100
- 820,415 · +78.5%
Race, ethnicity, and origin ACS 2023
- Neighborhood character
- Predominantly White (73%)
- Race & ethnicity
- White 73% Black 16% Two or more races 6% Hispanic / Latino 5% Asian 3%
- Common ancestry
- Serbian 6% Slovak 4% Lithuanian 3%
- Foreign-born
- 4% · Canada, China
- Languages at home
- 93% English-only · Spanish 3% German/W. Germanic 1% Chinese 1%
Political lean MEDSL · Richland
- 2024 margin
- Solid D (+34.6) · D 66.4% · R 31.8% · Other 1.8%
- 2008→2024 swing
- +5.7pp toward D · 2008: 28.9pp · 2024: 34.6pp
- All cycles
- 2024: D+34.6 2020: D+38.3 2016: D+32.9 2012: D+33.3 2008: D+28.9
Not yet ingested
- Civics
- —
Market trends
- HPI YoY
- ▼ -457.47%
- Current HPI
- 230.5538
- Rent YoY
- ▲ 6.95%
- Metro
- Columbia, SC
- State GDP YoY
- ▲ 4.51%
- F500 in state
- 2
Industry mix (Fortune 500 HQ in SC)
| Industry | F500 HQs | Revenue |
|---|---|---|
| Packaging | 1 | $7B |
|
||
Price history
1 event — show timeline
- 2026-06-15 Listed $80,000 Consolidated MLS
Property tax history
+0.0%/yrLatest (2025): $554 · +2.2% YoY. Source: county tax records.
Cash-flow waterfall
monthlySold comps — $/sqft
last 12 mo · ≤1 miLoading sold comps…