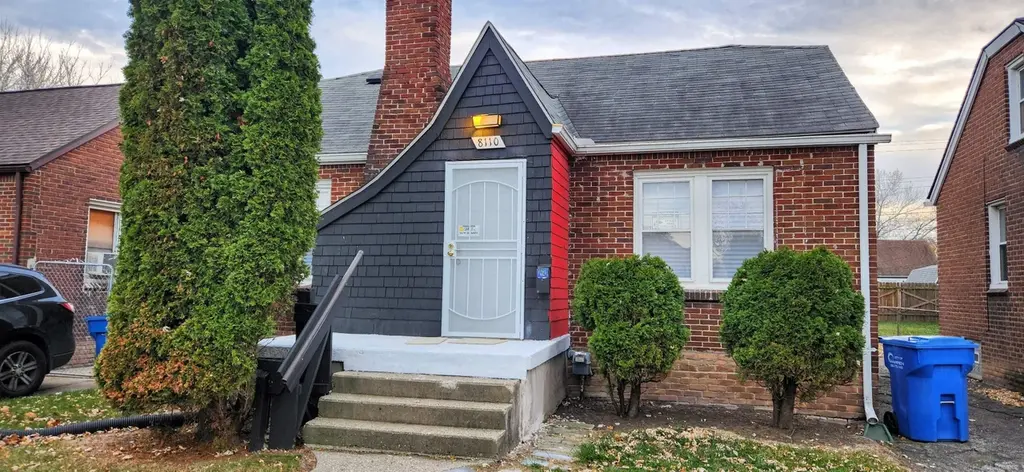
8110 Chalmers Ave · Warren, MI
Flood risk 1/10 · Minimal
- FEMA flood zone
- X (unshaded)
- Chance of flooding over 30 yrs
- 0.0%
- Est. flood insurance / yr
- $507 – $1,088
Fire risk 1/10 · Minimal
- Est. fire insurance / yr
- $784 – $1,456
Heat risk 3/10 · Minor
- Hot days now (above 97°F)
- 7 days/yr
- Hot days in 30 yrs
- 15 days/yr
Wind risk 1/10 · Minimal
- Chance of severe wind over 30 yrs
- —
Air-quality risk 3/10 · Minor
- Unhealthy air days now
- 3 days/yr
- Unhealthy air days in 30 yrs
- 4 days/yr
Risk factors via First Street. Map © Google.
Why this score? — see what drove the D grade
The composite is a weighted blend of 9 inputs, each scored 0–100. Each bar is that input's sub-score; the figure is the points it added to the 100-point composite (weight × sub-score).
- Cash flow +20.8/30.0
- DSCR +6.6/10.0
- 1% rule +5.1/10.0
- Livability +3.7/5.0
- Rent growth +3.2/5.0
- Condition / age +2.5/5.0
- Schools +1.0/10.0
- ARV discount +0.0/15.0
- Appreciation +0.0/10.0
$125,000
🖨 Deal sheet (PDF) 📄 Offer letter ✓ Due diligence
Listing remarks MLS
HURRY on This BEAUTIFUL MOVE-IN READY Wonderful 2 bedroom all BRICK bungalow Large attic which could be converted to 3rd bedroom. Home all newly refreshed including-All new carpeting throughout-including Living room and hall and both bedrooms with all new paint throughout. Spacious living room with actual wood burning fireplace. Large updated kitchen with eating area. Updated Fresh Water Plumbing and updated drain system, updated circuit breaker electric system, new gas furnace replaced in 2015. New hot water tank installed August, 2024. Nice new both steel entry doors. Has large plastic shed. Roof replaced including stripped with all necessary wood replaced in 2014 Asphalt driveway goes almost all the way to back fence Yard fenced on all sides.
Key facts
- Updated drain system
- Updated kitchen
- All brick bungalow
Tags
Neighborhood map
What this means for you Summary
Snapshot
- This is a 2-bed/1.0-bath single-family listed at $125k.
Deal economics
- At list price, monthly cash flow is $172 ($2k/yr) — positive.
- The deal already cash-flows at list — no discount required.
- Meets the 1% rule at list price ($1k rent vs $125k).
- Recommended offer: $114k (9.0% below list) — sets the bar for market timing.
- Cap rate 7.9% vs local median 5.2% in Warren — top-decile yield for the area; either an underpriced asset or a hidden risk that comps aren't pricing in. Stress-test before assuming the spread holds.
Location & tenants
- Location reads 74/100 on livability (#171 in MI, #4,491 nationally) — a middle-class / working-renter tenant base. Strengths: commute A+, cost of living A+, housing A+; Watch: amenities D, employment D, crime D-.
- Van Dyke Public Schools (urban): math 7% / reading 19% proficiency, ranked #512 of 540 in MI (top 95%) — low school quality limits family demand, transient renter base, plan for 1-2y turnover; 80% free/reduced lunch — lower-income household profile, screen leases tightly.
- Zoned schools: Lincoln Elementary School (math 8% / reading 12%, grade F, #1,277 of 1,397 statewide, top 93%, 355 students, 97% FRL); Lincoln Middle School (math 7% / reading 22%, grade F, #460 of 493 statewide, top 93%, 401 students, 96% FRL); Lincoln High School (math 2% / reading 17%, grade F, #692 of 713 statewide, top 98%, 440 students, 91% FRL).
- Market conditions: Rents rising (+2.9%/yr); 168 active listings in the ZIP; 40 comparable units currently listed for rent nearby; rentals at typical pace (median 26d on market — plan ~3-4 weeks tenant-placement turnaround); 1,321 units permitted in Macomb County in 2024 (86 in 5+ unit buildings).
Forward outlook
- Local home prices are declining (-3.0%/yr); year-one equity from $864 of loan paydown is wiped out by about $4k of value loss. Plan a longer hold.
- Macomb County population projected at +9% by 2050 — modest demand growth; plan on rents tracking national, not racing it.
Negotiation context
- It's been on market 115 days — a 9% lower offer ($114k) is reasonable based on typical stale-listing flexibility.
- 12 sale attempts since 30y ago with the ask held roughly flat each time — persistent listings suggest the price (not the market) is what's stuck; bring a comps-based counter.
- Current owner paid $24k; list at $125k implies a 421% gain — meaningful room to come down on a strong offer.
Risks & watch-outs
- Watch-outs: built in 1940 — expect roof / HVAC / electrical / plumbing capex.
Questions for the listing agent
- It's been on market 115 days. Have you received any prior offers? Is the seller open to a 9% concession, seller financing, or rate buy-down credit?
- Built in 1940 — when were the roof, HVAC, electrical panel, plumbing, and water heater last replaced?
- Why hasn't it sold? Are there any deal-killer items the seller is aware of (foundation, flood, title, zoning, code violations)?
- Is there a deadline driving the sale (1031 exchange, divorce, estate, relocation)? That informs how much negotiation room exists.
- Schools are D-rated, which usually means shorter tenancies and higher turnover. Who's the typical renter profile here, and what's been the actual vacancy rate?
- Crime grade is D in this area — have there been break-ins, vandalism, or insurance claims at this property in the last 3 years? What carrier currently insures it and at what premium?
- The area grade is low — what's the realistic commute time and amenity access for the typical tenant pool here? Any planned neighborhood developments (good or bad) we should know about?
- What's the average days-on-market for RENTAL listings here right now (not sales)? A rising rental-DOM trend means longer vacancies and softer asking-rent achievability than the comps imply.
- What's the recent tenant-quality profile in this submarket — average credit score on applications, eviction rate, late-payment / NSF rate, and stable-employment percentage? A property-management company in the area should have these aggregated.
- How much new for-sale + rental construction is in the pipeline within 1–3 miles? Heavy new supply typically softens prices + rents 12–24 months out; constrained supply supports both.
Investment metrics
- 1% rule
- 1.01% ✓
- Cap rate
- 7.95%
- Cash-on-cash
- 5.91%
- DSCR
- 1.26
- GRM
- 8.3
CMA / ARV
- ARV (median comp)
- $104,240
- List price
- $125,000
- Delta
- 19.92%
- Verdict
- OVERPRICED
- Comps
- 20 within 1.0 mi
Show comp detail 12 sales within ~0.75 mi
| Address | Dist | Beds/Ba | Sqft | Sold | Price | $/sf | Match |
|---|---|---|---|---|---|---|---|
| 8434 Orchard Ave | 0.24mi | 3/1.0 (+1) | 1,012 (-0%) | 1mo | $125,000 | $124 | 82 |
| 8285 Packard Ave | 0.22mi | 3/1.0 (+1) | 944 (-7%) | 3mo | $100,000 | $106 | 71 |
| 8441 Fisher Ave | 0.43mi | 3/1.0 (+1) | 992 (-2%) | 2mo | $125,000 | $126 | 69 |
| 7535 Meadow Ave | 0.25mi | 3/1.5 (+1) | 935 (-8%) | 2mo | $125,000 | $134 | 66 |
| 7259 Packard Ave | 0.33mi | 3/1.5 (+1) | 1,089 (+7%) | 2mo | $160,000 | $147 | 64 |
| 8420 Republic Ave | 0.65mi | 3/1.0 (+1) | 1,015 (0%) | 2mo | $150,000 | $148 | 63 |
| 8654 Continental Ave | 0.67mi | 3/1.0 (+1) | 1,008 (-1%) | 1mo | $103,000 | $102 | 62 |
| 8249 Packard Ave | 0.20mi | 3/1.0 (+1) | 871 (-14%) | 1mo | $68,000 | $78 | 61 |
| 11245 Hudson Ave | 0.63mi | 3/1.0 (+1) | 996 (-2%) | 2mo | $72,500 | $73 | 61 |
| 7035 Dodge Ave | 0.57mi | 3/1.0 (+1) | 1,056 (+4%) | 2mo | $84,000 | $80 | 61 |
| 8725 Packard Ave | 0.46mi | 3/1.0 (+1) | 925 (-9%) | 2mo | $135,000 | $146 | 58 |
| 7027 Chalmers Ave | 0.38mi | 3/1.0 (+1) | 900 (-11%) | 3mo | $79,000 | $88 | 56 |
Match score weights: distance 35% · size 25% · config 20% · recency 20%. Top-matched comps best support the ARV.
Projected returns pro-forma
-3.0% appreciation · 2.94% rent growth · sell at horizon
- IRR
- -7.2%
- Equity multiple
- 0.73×
- Total profit
- $-9,362
- Equity at exit
- $18,638
- IRR
- 2.3%
- Equity multiple
- 1.16×
- Total profit
- $5,642
- Equity at exit
- $10,808
Cash invested: $35,000 (down + closing). Projections, not guarantees.
Landlord ↔ Tenant lean methodology
- Overall (STATE)
- 62 Landlord-Friendly
- State Michigan
- 62 Landlord-Friendly · EVEN
- County
- — inherits STATE
- City
- — inherits STATE
ZIP-level market 48089
- Rents YoY
- 2.9%
- Active inventory
- 168
- Price-to-rent
- 8.3×
Monthly cashflow live
- Estimated rent
- $1,259 high interval (Pro) →
- Mortgage (P&I)
- −$656
- Tax from tax record
- −$114 /mo · $1,373/yr
- Insurance
- −$52
- HOA
- −$0
- Vacancy / Maint / Mgmt
- −$264
- Net cashflow
- $172
Break-even live
Sensitivity live
| Price | -10% $243 | -5% $208 | +0% $172 | +5% $137 | +10% $102 |
|---|---|---|---|---|---|
| Rent | -10% $73 | -5% $123 | +0% $172 | +5% $222 | +10% $272 |
| Rate | -1.0pp $235 | -0.5pp $204 | base $172 | +0.5pp $140 | +1.0pp $107 |
UW: 25.0% down · 7.5% · 30yr · 1.5% tax · 5.0% vac · 8.0% maint · 8.0% mgmt
Financing live
Cash to close
- Down payment
- $31,250
- Closing costs
- $3,750
- Reserves months
- —
- Total cash needed
- —
Loan-product check · same deal, 3 products live
Conventional
25% down · 7.5% · 30yr
- Down + closing
- —
- Monthly P&I
- —
- Monthly cashflow
- —
- DSCR
- —
- Eligible?
- —
Personal DTI + credit; lowest rate.
DSCR
20% down · 8.5% · 30yr
- Down + closing
- —
- Monthly P&I
- —
- Monthly cashflow
- —
- DSCR
- —
- Eligible?
- —
No personal income docs; deal must DSCR.
Hard money
10% down · 12.0% · 12mo
- Down + closing
- —
- Monthly P&I
- —
- Monthly cashflow
- —
- DSCR
- —
- Eligible?
- —
Short-term bridge; refi at stabilization.
Rent comps 40 comps
| Address | Beds | Baths | Sqft | Rent | $/sqft | DOM | Units | Dist |
|---|---|---|---|---|---|---|---|---|
| 8162 Orchard Ave Warren, MI | 2.0 | 1.0 | 900 | $1,000 | $1.11 | 45d | 1 | 0.09mi |
| 8065 Meadow Ave Warren, MI | 2.0 | 1.0 | 800 | $1,050 | $1.31 | 26d | 1 | 0.12mi |
| 8251 Hudson Ave Warren, MI | 3.0 | 1.0 | 908 | $1,400 | $1.54 | 26d | 1 | 0.17mi |
| 7568 Hudson Ave Unit 1 Warren, MI | 3.0 | 1.0 | 1415 | $1,100 | $0.78 | 7d | 1 | 0.22mi |
| 7568 Hudson Ave Unit 2 Warren, MI | 2.0 | 1.0 | 1415 | $900 | $0.64 | 7d | 1 | 0.22mi |
| 7511 Toepfer Rd Warren, MI | 3.0 | 1.0 | 1032 | $1,199 | $1.16 | 24d | 1 | 0.24mi |
| 7275 Chalmers Ave Warren, MI | 2.0 | 1.0 | 703 | $1,200 | $1.71 | 26d | 1 | 0.27mi |
| 8640 Chalmers Ave Warren, MI | 3.0 | 1.0 | 804 | $1,423 | $1.77 | 26d | 1 | 0.33mi |
| 8632 Studebaker Ave Warren, MI | 3.0 | 1.0 | 761 | $1,300 | $1.71 | 5d | 1 | 0.34mi |
| 7043 Meadow Ave Warren, MI | 2.0 | 1.0 | 911 | $1,274 | $1.40 | 45d | 1 | 0.39mi |
| 7060 Victory Ave Warren, MI | 3.0 | 1.0 | 945 | $1,450 | $1.53 | 13d | 1 | 0.42mi |
| 8242 Jackson Ave Warren, MI | 3.0 | 1.0 | 840 | $1,198 | $1.43 | 45d | 1 | 0.44mi |
| 8285 Rivard Ave Warren, MI | 3.0 | 1.0 | 902 | $1,549 | $1.72 | 26d | 1 | 0.48mi |
| 11076 Hudson Ave Warren, MI | 3.0 | 1.0 | 936 | $1,395 | $1.49 | 5d | 1 | 0.53mi |
| 8509 Paige Ave Warren, MI | 3.0 | 1.0 | 950 | $1,300 | $1.37 | 26d | 1 | 0.62mi |
| 11228 Sherman Ave Warren, MI | 2.0 | 1.0 | 1000 | $1,200 | $1.20 | 14d | 1 | 0.66mi |
| 11319 Chalmers Ave Warren, MI | 3.0 | 1.0 | 975 | $1,500 | $1.54 | 26d | 1 | 0.67mi |
| 8693 Paige Ave Warren, MI | 3.0 | 1.0 | 900 | $1,300 | $1.44 | 26d | 1 | 0.68mi |
| 11099 Dodge Ave Warren, MI | 2.0 | 1.0 | 1190 | $1,150 | $0.97 | 22d | 1 | 0.70mi |
| 8636 Republic Ave Warren, MI | 2.0 | 1.0 | 800 | $1,250 | $1.56 | 16d | 1 | 0.72mi |
| 8707 Continental Ave Warren, MI | 3.0 | 1.0 | 1100 | $1,200 | $1.09 | 7d | 1 | 0.73mi |
| 8707 Continental Ave Warren, MI | 3.0 | 1.0 | 968 | $1,200 | $1.24 | 19d | 1 | 0.73mi |
| 8212 Timken Ave Warren, MI | 2.0 | 1.0 | 756 | $1,320 | $1.75 | 26d | 1 | 0.75mi |
| 8428 Timken Ave Warren, MI | 3.0 | 1.0 | 860 | $1,250 | $1.45 | 26d | 1 | 0.78mi |
| 8125 Timken Ave Warren, MI | 3.0 | 1.0 | 948 | $1,270 | $1.34 | 7d | 1 | 0.78mi |
| 11377 Sherman Ave Warren, MI | 3.0 | 1.0 | 1200 | $1,400 | $1.17 | 26d | 1 | 0.78mi |
| 11359 Maxwell Ave Unit 11359 Warren, MI | 2.0 | 1.0 | 900 | $1,000 | $1.11 | 5d | 1 | 0.80mi |
| 8716 Timken Ave Warren, MI | 3.0 | 1.0 | 1008 | $1,400 | $1.39 | 26d | 1 | 0.86mi |
| 7256 Ready Ave Warren, MI | 3.0 | 2.0 | 1300 | $1,500 | $1.15 | 26d | 1 | 0.89mi |
| 11331 Continental Ave Warren, MI | 2.0 | 1.0 | 765 | $1,250 | $1.63 | 26d | 1 | 0.92mi |
| 11332 Republic Ave Warren, MI | 3.0 | 1.0 | 1140 | $1,500 | $1.32 | 26d | 1 | 0.94mi |
| 11130 Stephens Rd Warren, MI | 2.0 | 1.0 | 750 | $1,275 | $1.70 | 1d | 1 | 1.12mi |
| 19691 Cliff St #1 Detroit, MI | 2.0 | 1.0 | 850 | $1,000 | $1.18 | 0d | 1 | 1.13mi |
| 19682 Rogge St Detroit, MI | 3.0 | 1.0 | 1000 | $1,350 | $1.35 | 0d | 1 | 1.14mi |
| 21456 Syracuse Ave Warren, MI | 3.0 | 1.0 | 1160 | $1,595 | $1.38 | 45d | 1 | 1.16mi |
| 21456 Syracuse Ave Warren, MI | 3.0 | 1.0 | 1152 | $1,595 | $1.38 | 4d | 1 | 1.16mi |
| 21465 Syracuse Ave Warren, MI | 3.0 | 1.0 | 990 | $1,375 | $1.39 | 45d | 1 | 1.19mi |
| 20290 Annott St Detroit, MI | 3.0 | 1.0 | 1300 | $1,200 | $0.92 | 0d | 1 | 1.28mi |
| 21410 Panama St Warren, MI | 3.0 | 1.0 | 900 | $1,600 | $1.78 | 26d | 1 | 1.28mi |
| 22622 Panama Ave Warren, MI | 3.0 | 1.5 | 920 | $1,395 | $1.52 | 13d | 1 | 1.31mi |
Listing history 39 events
-
2026-06-21days on market $125,000 Active 115 DOM
-
2026-06-18days on market $125,000 Active 112 DOM
-
2026-06-17days on market $125,000 Active 111 DOM
-
2026-06-16days on market $125,000 Active 110 DOM
-
2026-06-15days on market $125,000 Active 109 DOM
-
2026-06-13days on market $125,000 Active 107 DOM
-
2026-06-13days on market $125,000 Active 106 DOM
-
2026-06-09days on market $125,000 Active 103 DOM
-
2026-06-08days on market $125,000 Active 102 DOM
-
2026-06-07days on market $125,000 Active 101 DOM
-
2026-06-04days on market $125,000 Active 98 DOM
-
2026-06-03days on market $125,000 Active 97 DOM
-
2026-06-02days on market $125,000 Active 96 DOM
-
2026-06-01days on market $125,000 Active 95 DOM
-
2026-05-31days on market $125,000 Active 94 DOM
-
2026-02-26$125,000 Active 755-char remark
Show marketing remark (755 chars)
HURRY on This BEAUTIFUL MOVE-IN READY Wonderful 2 bedroom all BRICK bungalow Large attic which could be converted to 3rd bedroom. Home all newly refreshed including-All new carpeting throughout-including Living room and hall and both bedrooms with all new paint throughout. Spacious living room with actual wood burning fireplace. Large updated kitchen with eating area. Updated Fresh Water Plumbing and updated drain system, updated circuit breaker electric system, new gas furnace replaced in 2015. New hot water tank installed August, 2024. Nice new both steel entry doors. Has large plastic shed. Roof replaced including stripped with all necessary wood replaced in 2014 Asphalt driveway goes almost all the way to back fence Yard fenced on all sides.
-
2006-04-19historical
-
2006-04-10historical
-
2006-02-22$69,900
-
2006-02-10historical
-
2006-01-10$69,900
-
2006-01-10historical
-
2005-11-10$72,900
-
2005-11-10historical
-
2005-10-10$72,900
-
2005-09-26$77,900
-
2005-09-26historical
-
2005-09-14historical
-
2005-08-09$79,900
-
2005-08-03historical
-
2005-06-03$86,900
-
2005-06-03historical
-
2005-03-14$79,900
-
2005-03-08$89,900
-
1996-04-10soldstatus $24,000
-
1996-03-25soldstatus $24,000
-
1996-03-18historical
-
1996-02-27$38,500
ⓘ Source: listings_history table (triggers on properties + properties_extension) + one-shot
backfill from property_details.listing_events for pre-trigger history.
Tax reassessment forecast MI · Partial reset (capped growth)
- Current annual tax
- $1,373 · $114/mo
- Projected year-2 tax
- $1,649 · $137/mo
- Expected delta
- +$276/yr (+$23/mo · 20.1%)
ⓘ Screening estimate from a state-policy table — verify with the county assessor before closing.
Climate risk First Street
- Flood 1/10 Low FEMA zone X (unshaded) · 0% chance over 30 yrs
- Wildfire 1/10 Low
- Heat 3/10 Moderate 7 d/yr ≥97°F today · 15 d/yr by 30 yrs out
- Wind 1/10 Low
- Air quality 3/10 Moderate 3 unhealthy d/yr today · 4 by 30 yrs out
Nearby sold comps map
Loading sold comps map…
Walkable amenities ~0.75 mi
Loading nearby amenities…
Taxation est. · year 1
- Rental income
- $15,104
- − Mortgage interest
- −$7,002
- − Property taxes
- −$1,373
- − Insurance
- −$625
- − Repairs & maintenance
- −$1,208
- − Management
- −$1,208
- − Depreciation
- −$3,636
- Taxable income
- $51
- Est. tax owed @ 24.0%
- −$12
- After-tax cash flow
- $2,056/yr
For passive investors: Depreciation is non-cash, so a rental often shows a tax loss while cash-flowing — sheltering income. Rental losses are passive: they offset passive income freely, and up to $25,000/yr can offset ordinary (W-2) income if you actively participate and your MAGI is under $100k (phasing out to $0 by $150k); unused losses carry forward. On sale, claimed depreciation is recaptured at up to 25%, and gains may owe capital-gains tax (a 1031 exchange can defer both). Figures are a year-1 estimate at your 24.0% rate — not tax advice; consult a CPA.
Schools (NCES district)
- District
- Van Dyke Public Schools
- NCES district ID
- 2634680
- Math proficiency
- 7% ▼ -11.00%
- Reading proficiency
- 19% ▼ -5.00%
- Median HH income
- $33,231
- Composite
- 10.46/100
- National rank
- #9784
- State rank
- #512 of 540 in MI
Livability — Warren
- Score
- 74/100
- State rank
- #171
- US rank
- #4491
Category grades
Schools grade is shown separately in the Schools card above.
Census & demographics
- Census place
- Warren, MI
- County
- Macomb County · 638,552 people
- City population
- 114,937
- Metro
- Detroit-Warren-Dearborn, MI
- Population (ZIP)
- 31,853
- Household income
- $52,366
- Rent vs Own
- Severe rent burden
- 1754.0
Population outlook (Macomb County) Hauer SSP2
- Today (2025)
- 925,296 people
- By 2030
- 948,226 · +2.5%
- By 2040
- 983,961 · +6.3%
- By 2050
- 1,010,200 · +9.2%
- By 2075
- 1,076,222 · +16.3%
- By 2100
- 1,077,065 · +16.4%
Race, ethnicity, and origin ACS 2023
- Neighborhood character
- Diverse neighborhood (Simpson 0.61)
- Race & ethnicity
- White 53% Black 31% Asian 7% Two or more races 6% Hispanic / Latino 3%
- Common ancestry
- Romanian 11% Lithuanian 3% Slovak 2%
- Foreign-born
- 5% · Canada
- Languages at home
- 92% English-only · Other Asian/Pacific 3% Other Indo-European 2% Arabic 1%
Political lean MEDSL · Macomb
- 2024 margin
- R (+13.7) · D 42.2% · R 55.9% · Other 1.9%
- 2008→2024 swing
- -22.3pp toward R · 2008: 8.6pp · 2024: -13.7pp
- All cycles
- 2024: R+13.7 2020: R+8.1 2016: R+11.6 2012: D+4.0 2008: D+8.6
Not yet ingested
- Civics
- —
Market trends
- HPI YoY
- ▼ -211.46%
- Current HPI
- 154.8325
- Rent YoY
- ▲ 2.94%
- Metro
- Detroit-Warren-Dearborn, MI
- State GDP YoY
- ▲ 1.37%
- F500 in state
- 28
Industry mix (Fortune 500 HQ in MI)
| Industry | F500 HQs | Revenue |
|---|---|---|
| Automotive Parts | 3 | $48B |
|
||
| Automotive | 2 | $372B |
|
||
| Chemicals | 1 | $45B |
|
||
| Automotive Retail | 1 | $29B |
|
||
| Healthcare / Medical Devices | 1 | $23B |
|
||
| Automotive Technology | 1 | $20B |
|
||
Price history
+224.7% since first listed24 events — show timeline
- 2026-02-26 Listed $125,000 REALCOMP
- 2026-02-26 Listed $125,000 MiRealSource-MiMLS
- 2006-04-19 Listing Removed — REALCOMP
- 2006-04-10 Listing Removed — MiRealSource-MiMLS
- 2006-02-22 Listed $69,900 REALCOMP
- 2006-02-10 Listing Removed — REALCOMP
- 2006-01-10 Listing Removed — MiRealSource-MiMLS
- 2006-01-10 Listed $69,900 MiRealSource-MiMLS
- 2005-11-10 Listing Removed — MiRealSource-MiMLS
- 2005-11-10 Listed $72,900 MiRealSource-MiMLS
- 2005-10-10 Listed $72,900 REALCOMP
- 2005-09-26 Listing Removed — MiRealSource-MiMLS
- 2005-09-26 Listed $77,900 MiRealSource-MiMLS
- 2005-09-14 Listing Removed — REALCOMP
- 2005-08-09 Listed $79,900 MiRealSource-MiMLS
- 2005-08-03 Listing Removed — MiRealSource-MiMLS
- 2005-06-03 Listing Removed — MiRealSource-MiMLS
- 2005-06-03 Listed $86,900 MiRealSource-MiMLS
- 2005-03-14 Listed $79,900 REALCOMP
- 2005-03-08 Listed $89,900 MiRealSource-MiMLS
- 1996-04-10 Sold (Public Records) $24,000 Public Records
- 1996-03-25 Sold (MLS) $24,000 MiRealSource-MiMLS
- 1996-03-18 Listing Removed — MiRealSource-MiMLS
- 1996-02-27 Listed $38,500 MiRealSource-MiMLS
Property tax history
+1.8%/yrLatest (2025): $1,373 · +2.6% YoY. Source: county tax records.
Cash-flow waterfall
monthlySold comps — $/sqft
last 12 mo · ≤1 miLoading sold comps…