 Fourplex
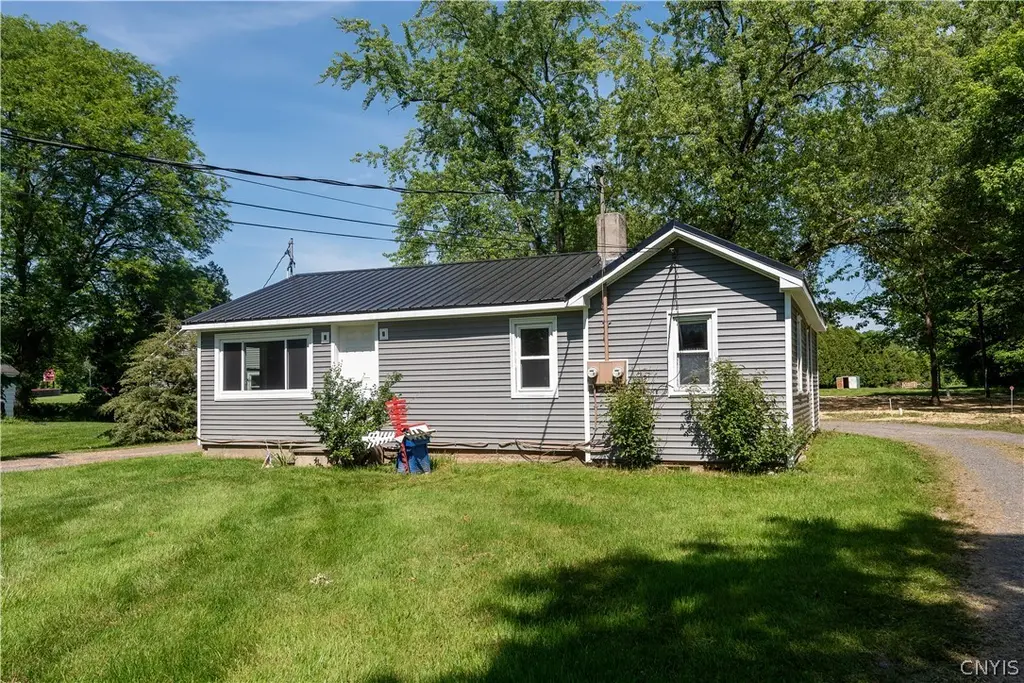
7604-7610 Van Buren Rd #7604 · Village Green, NY
Flood risk 1/10 · Minimal
- FEMA flood zone
- X (unshaded)
- Chance of flooding over 30 yrs
- 0.0%
- Est. flood insurance / yr
- $507 – $1,088
Fire risk 1/10 · Minimal
- Est. fire insurance / yr
- $691 – $1,283
Heat risk 2/10 · Minimal
- Hot days now (above 95°F)
- 7 days/yr
- Hot days in 30 yrs
- 16 days/yr
Wind risk 1/10 · Minimal
- Chance of severe wind over 30 yrs
- 0.0%
Air-quality risk 2/10 · Minimal
- Unhealthy air days now
- 0 days/yr
- Unhealthy air days in 30 yrs
- 1 days/yr
Risk factors via First Street. Map © Google.
Why this score? — see what drove the B grade
The composite is a weighted blend of 9 inputs, each scored 0–100. Each bar is that input's sub-score; the figure is the points it added to the 100-point composite (weight × sub-score).
- Cash flow +30.0/30.0
- 1% rule +10.0/10.0
- DSCR +10.0/10.0
- ARV discount +7.5/15.0
- Schools +4.4/10.0
- Condition / age +3.8/5.0
- Livability +3.2/5.0
- Rent growth +2.5/5.0
- Appreciation +0.0/10.0
$399,900
🖨 Deal sheet 📄 Offer letter ✓ Due diligence
Multi-family units
County records classify this as Multi-Family (2-4 Unit). Listing-text estimate: 4 units. confirmed
Listing remarks
Unique property offers two homes on 2.07 acres in Baldwinsville. Both homes have been updated and ready for new owners, Conveniently located near 690 and I90. Originally built as a family compound mother/grandmother home (7604) and son/daughter-in-law home (7610). Square footage includes both homes - 1947 sq ft at #7610 and 831 sq ft at #7604.
Key facts
- 2.07 acres
- Updated
- Conveniently located
Tags
Property features AI
Finance
- Other: Owner pays: See remarks
- Financial info: Multi-unit property with 2 total units; Separate electric meters: 2; Separate gas meters: 1; Operating expense details: See remarks
Exterior
- Parking: 2-car garage; Gravel parking with two or more spaces
- Utilities: Cable available; High-speed internet available; Public water connected; Septic tank sewer; Circuit breaker electric
- Home design: Single-story building; Resale property; Metal roof; Vinyl siding
- Construction: Built (existing); Copper plumbing; Crawl space basement
- Exterior features: Deck; Irregular residential lot; City street frontage
Interior
- Kitchen: Unit 1: Dishwasher, Oven/Range, Refrigerator, Microwave, Eat-in kitchen; Unit 2: Oven/Range, Refrigerator, Eat-in kitchen
- Bedrooms: Unit 1: 3 bedrooms; Unit 2: 1 bedroom
- Flooring: Luxury vinyl and vinyl flooring (varies)
- Bathrooms: 3 full bathrooms total (Unit 1: 2 full baths; Unit 2: 1 full bath)
- Heating & cooling: Gas heating with baseboard and forced air
- Interior features: Ceiling fan(s)
- Laundry & utility: Unit 1: Washer and Dryer in unit; Unit 2: Laundry in unit; Electric water heater
Neighborhood map
What this means for you Summary
Snapshot
- This is a 4 × 3-bed/1.5-bath units multifamily listed at $400k. Condition is rated good.
Deal economics
- At list price, monthly cash flow is $3k ($38k/yr) — positive. Per door: $791/mo.
- The deal already cash-flows at list — no discount required.
- Meets the 1% rule at list price ($8k rent vs $400k).
- Cap rate 15.8% vs local median 5.3% in Village Green — top-decile yield for the area; either an underpriced asset or a hidden risk that comps aren't pricing in. Stress-test before assuming the spread holds.
Location & tenants
- Location reads 64/100 on livability (#720 in NY) — a middle-class / working-renter tenant base. Strengths: housing A+, cost of living A, crime B; Watch: employment C-, amenities F, commute F.
- Baldwinsville Central School District (suburban): math 47% / reading 53% proficiency, ranked #355 of 590 in NY (top 60%) — acceptable for families but not a draw, mixed tenant base, ~2y average lease; only 18% free/reduced lunch — higher-income household profile.
- Market conditions: 222 active listings in the ZIP; solid renter incomes; 616 units permitted in Onondaga County in 2024 (256 in 5+ unit buildings).
- At $7,502/mo this rent would consume 98% of the median local household income ($92k/yr) (locally 1057% of renters already pay >50% of income on rent) — very limited rent-growth headroom before tenants either downsize or default.
Forward outlook
- Local home prices are declining (-3.0%/yr); year-one equity from $3k of loan paydown is wiped out by about $12k of value loss. Plan a longer hold.
- Onondaga County population projected to shrink 9% by 2050 — rents likely to lag national; underwrite the cash flow, not the appreciation.
- At projected returns (-3.0% appreciation + 3.0% rent growth), your $112k cash investment doubles in ~4 years — after that, you're playing with house money.
Negotiation context
- Only 13 days on market — expect competitive offers; lowballing is unlikely to land.
Risks & watch-outs
- Watch-outs: built in 1950 — expect roof / HVAC / electrical / plumbing capex.
Questions for the listing agent
- Can we see the unit-by-unit rent roll, current vacancy, and any below-market leases? What's the average tenancy length?
- What capital expenditures (roof, boiler, parking lot, exteriors) have been made in the last 5 years, and what's planned in the next 2?
- Built in 1950 — when were the roof, HVAC, electrical panel, plumbing, and water heater last replaced?
- Is there a deadline driving the sale (1031 exchange, divorce, estate, relocation)? That informs how much negotiation room exists.
- What's the average days-on-market for RENTAL listings here right now (not sales)? A rising rental-DOM trend means longer vacancies and softer asking-rent achievability than the comps imply.
- What's the recent tenant-quality profile in this submarket — average credit score on applications, eviction rate, late-payment / NSF rate, and stable-employment percentage? A property-management company in the area should have these aggregated.
- How much new apartment / multifamily construction is in the pipeline within 1–3 miles? Heavy new supply (>2% of stock underway) typically softens rents 12–24 months out; light construction supports rent growth.
Investment metrics
- 1% rule
- 1.88% ✓
- Cap rate
- 15.78%
- Cash-on-cash
- 33.90%
- DSCR
- 2.51
- GRM
- 4.4
CMA / ARV
No comps found within radius.
Projected returns pro-forma
-3.0% appreciation · 3.0% rent growth · sell at horizon
- IRR
- 29.2%
- Equity multiple
- 2.22×
- Total profit
- $136,763
- Equity at exit
- $59,626
- IRR
- 36.6%
- Equity multiple
- 4.38×
- Total profit
- $378,951
- Equity at exit
- $34,576
Cash invested: $111,972 (down + closing). Projections, not guarantees.
Landlord ↔ Tenant lean methodology
- Overall (STATE)
- 15 Strongly Tenant-Friendly
- State New York
- 15 Strongly Tenant-Friendly · D+10
- County
- — inherits STATE
- City
- — inherits STATE
ZIP-level market 13027
- Active inventory
- 222
- Price-to-rent
- 17.8×
Monthly cashflow live
- Estimated rent
- $7,502 medium interval (Pro) →
- Mortgage (P&I)
- −$2,097
- Tax est. 1.5%
- −$500 /mo · $5,998/yr
- Insurance
- −$167
- HOA
- −$0
- Vacancy / Maint / Mgmt
- −$1,575
- Net cashflow
- $3,163
Break-even live
4-unit breakdown (identical units grouped — click to expand)
| Units | Beds | Baths | Est. rent |
|---|---|---|---|
| 4× units | 3 | 1.5 | $7,500 |
| #1 | 3 | 1.5 | $1,875 |
| #2 | 3 | 1.5 | $1,875 |
| #3 | 3 | 1.5 | $1,875 |
| #4 | 3 | 1.5 | $1,875 |
| Total (4 units) | $7,502 | ||
UW: 25.0% down · 7.5% · 30yr · 1.5% tax · 5.0% vac · 8.0% maint · 8.0% mgmt
Financing live
Cash to close
- Down payment
- $99,975
- Closing costs
- $11,997
- Reserves months
- —
- Total cash needed
- —
Loan-product check · same deal, 3 products live
Conventional
25% down · 7.5% · 30yr
- Down + closing
- —
- Monthly P&I
- —
- Monthly cashflow
- —
- DSCR
- —
- Eligible?
- —
Personal DTI + credit; lowest rate.
DSCR
20% down · 8.5% · 30yr
- Down + closing
- —
- Monthly P&I
- —
- Monthly cashflow
- —
- DSCR
- —
- Eligible?
- —
No personal income docs; deal must DSCR.
Hard money
10% down · 12.0% · 12mo
- Down + closing
- —
- Monthly P&I
- —
- Monthly cashflow
- —
- DSCR
- —
- Eligible?
- —
Short-term bridge; refi at stabilization.
Listing history 11 events
-
2026-06-18days on market $399,900 Active 13 DOM
-
2026-06-17days on market $399,900 Active 12 DOM
-
2026-06-16days on market $399,900 Active 11 DOM
-
2026-06-15days on market $399,900 Active 10 DOM
-
2026-06-14days on market $399,900 Active 8 DOM
-
2026-06-13days on market $399,900 Active 7 DOM
-
2026-06-10days on market $399,900 Active 5 DOM
-
2026-06-09days on market $399,900 Active 4 DOM
-
2026-06-08days on market $399,900 Active 3 DOM
-
2026-06-07remarks 345-char remark
-
2026-06-07$399,900 Active 2 DOM
ⓘ Source: listings_history table (triggers on properties + properties_extension) + one-shot
backfill from property_details.listing_events for pre-trigger history.
Climate risk First Street
- Flood 1/10 Low FEMA zone X (unshaded) · 0% chance over 30 yrs
- Wildfire 1/10 Low
- Heat 2/10 Low 7 d/yr ≥95°F today · 16 d/yr by 30 yrs out
- Wind 1/10 Low 0% chance of damaging wind over 30 yrs
- Air quality 2/10 Low 0 unhealthy d/yr today · 1 by 30 yrs out
Nearby sold comps map
Loading sold comps map…
Walkable amenities ~0.75 mi
Loading nearby amenities…
Taxation est. · year 1
- Rental income
- $90,024
- − Mortgage interest
- −$22,401
- − Property taxes
- −$5,998
- − Insurance
- −$2,000
- − Repairs & maintenance
- −$7,202
- − Management
- −$7,202
- − Depreciation
- −$11,633
- Taxable income
- $33,588
- Est. tax owed @ 24.0%
- −$8,061
- After-tax cash flow
- $29,894/yr
For passive investors: Depreciation is non-cash, so a rental often shows a tax loss while cash-flowing — sheltering income. Rental losses are passive: they offset passive income freely, and up to $25,000/yr can offset ordinary (W-2) income if you actively participate and your MAGI is under $100k (phasing out to $0 by $150k); unused losses carry forward. On sale, claimed depreciation is recaptured at up to 25%, and gains may owe capital-gains tax (a 1031 exchange can defer both). Figures are a year-1 estimate at your 24.0% rate — not tax advice; consult a CPA.
Condition & rehab AI · 13 photos
The property is in good condition with updated kitchens and bathrooms. It has a good curb appeal and is ready for new owners. Consider painting the exterior siding and landscaping to further enhance its value.
Value-add opportunities
- Resale Painting exterior siding — Fresh paint can enhance curb appeal and property value.
- Rental Landscaping overgrown areas — Well-maintained landscaping can attract tenants and increase rental value.
Renovation cost estimate screening
Value-add ROI direction
- Resale Painting exterior siding — Fresh paint can enhance curb appeal and property value. ↑
- Rental Landscaping overgrown areas — Well-maintained landscaping can attract tenants and increase rental value. ↑
ⓘ Cost ranges are severity-bucket heuristics (US national rule-of-thumb). Get contractor quotes + a written scope before underwriting a rehab budget.
Schools (NCES district)
- District
- Baldwinsville Central School District
- NCES district ID
- 3603870
- Math proficiency
- 47% ▼ -11.00%
- Reading proficiency
- 53% ▲ 2.00%
- Median HH income
- $65,182
- Composite
- 44.22/100
- National rank
- #2848
- State rank
- #355 of 590 in NY
Livability — Village Green
- Score
- 64/100
- State rank
- #720
- US rank
- #13628
Category grades
Schools grade is shown separately in the Schools card above.
Census & demographics
- Census place
- Village Green, NY
- County
- Onondaga County · 247,257 people
- Metro
- Syracuse, NY
- Population (ZIP)
- 35,088
- Household income
- $91,797
- Rent vs Own
- Severe rent burden
- 1057.0
Population outlook (Onondaga County) Hauer SSP2
- Today (2025)
- 467,894 people
- By 2030
- 463,381 · -1.0%
- By 2040
- 447,697 · -4.3%
- By 2050
- 426,399 · -8.9%
- By 2075
- 373,661 · -20.1%
- By 2100
- 307,967 · -34.2%
Race, ethnicity, and origin ACS 2023
- Neighborhood character
- Predominantly White (89%)
- Race & ethnicity
- White 89% Two or more races 6% Hispanic / Latino 4% Black 2% Asian 1%
- Common ancestry
- Romanian 6% Lithuanian 5% Subsaharan African 2%
- Foreign-born
- 3% · Canada
- Languages at home
- 96% English-only · Other Indo-European 1% Russian/Polish/Slavic 1% Spanish 1%
Political lean MEDSL · Onondaga
- 2024 margin
- D (+17.3) · D 58.6% · R 41.4%
- 2008→2024 swing
- -3.0pp toward R · 2008: 20.3pp · 2024: 17.3pp
- All cycles
- 2024: D+17.3 2020: D+20.6 2016: D+12.8 2012: D+21.1 2008: D+20.3
Not yet ingested
- Civics
- —
Market trends
- HPI YoY
- ▼ -204.01%
- Current HPI
- 321.8247
- Rent YoY
- —
- Metro
- Syracuse, NY
- State GDP YoY
- ▲ 2.60%
- F500 in state
- 92
Industry mix (Fortune 500 HQ in NY)
| Industry | F500 HQs | Revenue |
|---|---|---|
| Financial Services | 10 | $950B |
|
||
| Consumer Goods | 9 | $162B |
|
||
| Insurance | 4 | $225B |
|
||
| Telecommunications | 2 | $144B |
|
||
| Pharmaceuticals | 2 | $112B |
|
||
| Media / Entertainment | 2 | $69B |
|
||
Price history
1 event — show timeline
- 2026-06-05 Listed $399,900 CNYIS
Cash-flow waterfall
monthlySold comps — $/sqft
last 12 mo · ≤1 miLoading sold comps…