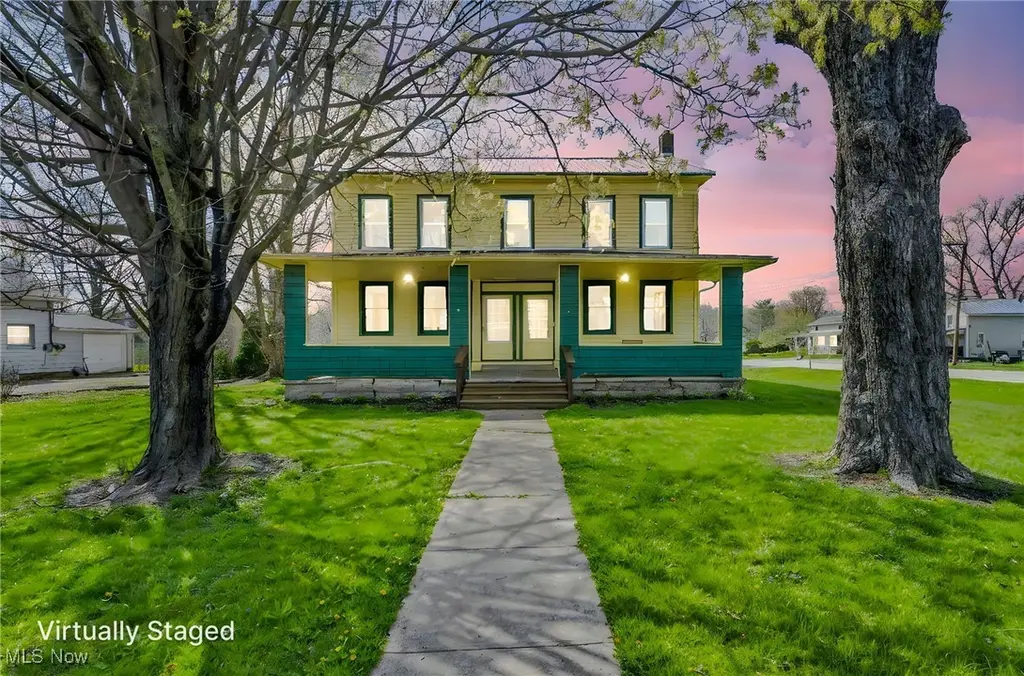
 Fourplex
8935-8941 S Main St · Windham, OH
Flood risk No data
- FEMA flood zone
- —
- Chance of flooding over 30 yrs
- —
- Est. flood insurance / yr
- —
Fire risk No data
- Est. fire insurance / yr
- —
Heat risk No data
- Hot days now (above threshold)
- —
- Hot days in 30 yrs
- —
Wind risk No data
- Chance of severe wind over 30 yrs
- —
Air-quality risk No data
- Unhealthy air days now
- —
- Unhealthy air days in 30 yrs
- —
Risk factors via First Street. Map © Google.
Why this score? — see what drove the B grade
The composite is a weighted blend of 9 inputs, each scored 0–100. Each bar is that input's sub-score; the figure is the points it added to the 100-point composite (weight × sub-score).
- Cash flow +30.0/30.0
- 1% rule +10.0/10.0
- DSCR +10.0/10.0
- ARV discount +9.2/15.0
- Condition / age +3.8/5.0
- Livability +3.1/5.0
- Schools +2.9/10.0
- Rent growth +2.5/5.0
- Appreciation +0.0/10.0
$189,900
🖨 Deal sheet 📄 Offer letter ✓ Due diligence
Multi-family units
County records classify this as Multi-Family (2-4 Unit). Listing-text estimate: 4 units. confirmed
Listing remarks MLS
Investors Dream! Welcome to this home8935 S. Main St. This used to be a twinplex but the prior owner removed the dividing wall. Wall can be put back up and made back into an investment property. Each side has 2 bedrooms with 1 updated bathroom, kitchen and family room. Each side is roughly 1200 sq feet. There is a 2 car garage in the back of the residence. There are 2 furnaces, 2 hot water tanks, 2 electrical panels. The gas can be easily converted to 2 and same with the water meter. Each unit has a back door as well. Call for a private showing today! Dividing wall will need to be put back up. Seller is working on getting quotes
Key facts
- 0.72 acre lot
- 2 garage spots
- Built 1890
Neighborhood map
What this means for you Summary
Snapshot
- This is a 4 × 2-bed/1-bath units multifamily listed at $190k. Condition is rated good.
Deal economics
- At list price, monthly cash flow is $2k ($29k/yr) — positive. Per door: $595/mo.
- The deal already cash-flows at list — no discount required.
- Meets the 1% rule at list price ($5k rent vs $190k).
- Recommended offer: $167k (12.0% below list) — sets the bar for market timing.
Location & tenants
- Location reads 62/100 on livability (#886 in OH) — a middle-class / working-renter tenant base. Strengths: cost of living A+, housing A+, crime A; Watch: schools C-, amenities F, commute F.
- Windham Exempted Village (town): math 27% / reading 43% proficiency, ranked #564 of 656 in OH (top 86%) — families likely to look elsewhere, expect single-tenant / working-renter base with shorter leases; 68% free/reduced lunch — lower-income household profile, screen leases tightly.
- Market conditions: 15 active listings in the ZIP; 196 units permitted in Portage County in 2024 (10 in 5+ unit buildings).
- At $4,673/mo this rent would consume 86% of the median local household income ($65k/yr) — very limited rent-growth headroom before tenants either downsize or default.
Forward outlook
- Local home prices are declining (-3.0%/yr); year-one equity from $1k of loan paydown is wiped out by about $6k of value loss. Plan a longer hold.
- At projected returns (-3.0% appreciation + 3.0% rent growth), your $53k cash investment doubles in ~3 years — after that, you're playing with house money.
Negotiation context
- It's been on market 231 days — a 12% lower offer ($167k) is reasonable based on typical stale-listing flexibility.
- 2 sale attempts since 24y ago; this cycle's ask has dropped $18k (9%) from the opening price — seller is motivated, your offer sets the floor, not the list.
Risks & watch-outs
- Watch-outs: built in 1890 — expect roof / HVAC / electrical / plumbing capex.
Questions for the listing agent
- It's been on market 231 days. Have you received any prior offers? Is the seller open to a 12% concession, seller financing, or rate buy-down credit?
- Can we see the unit-by-unit rent roll, current vacancy, and any below-market leases? What's the average tenancy length?
- What capital expenditures (roof, boiler, parking lot, exteriors) have been made in the last 5 years, and what's planned in the next 2?
- Built in 1890 — when were the roof, HVAC, electrical panel, plumbing, and water heater last replaced?
- Why hasn't it sold? Are there any deal-killer items the seller is aware of (foundation, flood, title, zoning, code violations)?
- Is there a deadline driving the sale (1031 exchange, divorce, estate, relocation)? That informs how much negotiation room exists.
- What's the average days-on-market for RENTAL listings here right now (not sales)? A rising rental-DOM trend means longer vacancies and softer asking-rent achievability than the comps imply.
- What's the recent tenant-quality profile in this submarket — average credit score on applications, eviction rate, late-payment / NSF rate, and stable-employment percentage? A property-management company in the area should have these aggregated.
- How much new apartment / multifamily construction is in the pipeline within 1–3 miles? Heavy new supply (>2% of stock underway) typically softens rents 12–24 months out; light construction supports rent growth.
Investment metrics
- 1% rule
- 2.46% ✓
- Cap rate
- 21.33%
- Cash-on-cash
- 53.70%
- DSCR
- 3.39
- GRM
- 3.4
CMA / ARV
- ARV (median comp)
- $197,302
- List price
- $189,900
- Delta
- -3.75%
- Verdict
- FAIR
- Comps
- 3 within 1.0 mi
Projected returns pro-forma
-3.0% appreciation · 3.0% rent growth · sell at horizon
- IRR
- 51.8%
- Equity multiple
- 3.27×
- Total profit
- $120,838
- Equity at exit
- $28,315
- IRR
- 57.1%
- Equity multiple
- 6.65×
- Total profit
- $300,642
- Equity at exit
- $16,419
Cash invested: $53,172 (down + closing). Projections, not guarantees.
Landlord ↔ Tenant lean methodology
- Overall (STATE)
- 73 Landlord-Friendly
- State Ohio
- 73 Landlord-Friendly · R+6
- County
- — inherits STATE
- City
- — inherits STATE
ZIP-level market 44288
- Home prices YoY
- -22.1%
- Active inventory
- 15
- Price-to-rent
- 13.5×
Monthly cashflow live
- Estimated rent
- $4,673 medium interval (Pro) →
- Mortgage (P&I)
- −$996
- Tax est. 1.5%
- −$237 /mo · $2,848/yr
- Insurance
- −$79
- HOA
- −$0
- Vacancy / Maint / Mgmt
- −$981
- Net cashflow
- $2,379
Break-even live
4-unit breakdown (identical units grouped — click to expand)
| Units | Beds | Baths | Est. rent |
|---|---|---|---|
| 4× units | 2 | 1 | $4,672 |
| #1 | 2 | 1 | $1,168 |
| #2 | 2 | 1 | $1,168 |
| #3 | 2 | 1 | $1,168 |
| #4 | 2 | 1 | $1,168 |
| Total (4 units) | $4,673 | ||
UW: 25.0% down · 7.5% · 30yr · 1.5% tax · 5.0% vac · 8.0% maint · 8.0% mgmt
Financing live
Cash to close
- Down payment
- $47,475
- Closing costs
- $5,697
- Reserves months
- —
- Total cash needed
- —
Loan-product check · same deal, 3 products live
Conventional
25% down · 7.5% · 30yr
- Down + closing
- —
- Monthly P&I
- —
- Monthly cashflow
- —
- DSCR
- —
- Eligible?
- —
Personal DTI + credit; lowest rate.
DSCR
20% down · 8.5% · 30yr
- Down + closing
- —
- Monthly P&I
- —
- Monthly cashflow
- —
- DSCR
- —
- Eligible?
- —
No personal income docs; deal must DSCR.
Hard money
10% down · 12.0% · 12mo
- Down + closing
- —
- Monthly P&I
- —
- Monthly cashflow
- —
- DSCR
- —
- Eligible?
- —
Short-term bridge; refi at stabilization.
Listing history 18 events
-
2026-06-18days on market $189,900 Active 231 DOM
-
2026-06-17days on market $189,900 Active 230 DOM
-
2026-06-16days on market $189,900 Active 229 DOM
-
2026-06-15days on market $189,900 Active 228 DOM
-
2026-06-13days on market $189,900 Active 226 DOM
-
2026-06-12days on market $189,900 Active 225 DOM
-
2026-06-09days on market $189,900 Active 222 DOM
-
2026-06-08days on market $189,900 Active 221 DOM
-
2026-06-08days on market $189,900 Active 220 DOM
-
2026-06-07days on market $189,900 Active 219 DOM
-
2026-06-04days on market $189,900 Active 216 DOM
-
2026-06-02days on market $189,900 Active 215 DOM
-
2026-06-01days on market $189,900 Active 214 DOM
-
2026-05-31days on market $189,900 Active 213 DOM
-
2026-04-15price $189,900 638-char remark
Show marketing remark (638 chars)
Investors Dream! Welcome to this home8935 S. Main St. This used to be a twinplex but the prior owner removed the dividing wall. Wall can be put back up and made back into an investment property. Each side has 2 bedrooms with 1 updated bathroom, kitchen and family room. Each side is roughly 1200 sq feet. There is a 2 car garage in the back of the residence. There are 2 furnaces, 2 hot water tanks, 2 electrical panels. The gas can be easily converted to 2 and same with the water meter. Each unit has a back door as well. Call for a private showing today! Dividing wall will need to be put back up. Seller is working on getting quotes
-
2025-10-29$207,900 Active 638-char remark
Show marketing remark (638 chars)
Investors Dream! Welcome to this home8935 S. Main St. This used to be a twinplex but the prior owner removed the dividing wall. Wall can be put back up and made back into an investment property. Each side has 2 bedrooms with 1 updated bathroom, kitchen and family room. Each side is roughly 1200 sq feet. There is a 2 car garage in the back of the residence. There are 2 furnaces, 2 hot water tanks, 2 electrical panels. The gas can be easily converted to 2 and same with the water meter. Each unit has a back door as well. Call for a private showing today! Dividing wall will need to be put back up. Seller is working on getting quotes
-
2003-03-31historical
-
2002-09-26$175,000
ⓘ Source: listings_history table (triggers on properties + properties_extension) + one-shot
backfill from property_details.listing_events for pre-trigger history.
Nearby sold comps map
Loading sold comps map…
Walkable amenities ~0.75 mi
Loading nearby amenities…
Taxation est. · year 1
- Rental income
- $56,076
- − Mortgage interest
- −$10,637
- − Property taxes
- −$2,848
- − Insurance
- −$950
- − Repairs & maintenance
- −$4,486
- − Management
- −$4,486
- − Depreciation
- −$5,524
- Taxable income
- $27,144
- Est. tax owed @ 24.0%
- −$6,515
- After-tax cash flow
- $22,037/yr
For passive investors: Depreciation is non-cash, so a rental often shows a tax loss while cash-flowing — sheltering income. Rental losses are passive: they offset passive income freely, and up to $25,000/yr can offset ordinary (W-2) income if you actively participate and your MAGI is under $100k (phasing out to $0 by $150k); unused losses carry forward. On sale, claimed depreciation is recaptured at up to 25%, and gains may owe capital-gains tax (a 1031 exchange can defer both). Figures are a year-1 estimate at your 24.0% rate — not tax advice; consult a CPA.
Condition & rehab AI · 12 photos
This multi-family home is in good condition with some cosmetic updates needed. The kitchen and bathrooms are in need of updating, which would significantly increase its value.
Repairs flagged
- Moderate kitchen cabinets — dated and in need of updating
- Moderate bathroom fixtures — dated and in need of updating
- Major kitchen appliances — outdated and in need of replacement
Value-add opportunities
- Both update kitchen cabinets and appliances — modernizing the kitchen will appeal to both buyers and renters
- Both update bathroom fixtures — modernizing the bathrooms will appeal to both buyers and renters
- Both paint interior walls — painting the interior walls will improve the home's curb appeal and make it more inviting
Renovation cost estimate screening
| Repair item | Severity | Est. cost |
|---|---|---|
| kitchen cabinets · dated and in need of updating | Moderate | $3,000–15,000 |
| bathroom fixtures · dated and in need of updating | Moderate | $3,000–15,000 |
| kitchen appliances · outdated and in need of replacement | Major | $15,000–50,000 |
| Total estimated repair cost · 3 items | $21,000–80,000 |
Value-add ROI direction
- Both update kitchen cabinets and appliances — modernizing the kitchen will appeal to both buyers and renters ↑
- Both update bathroom fixtures — modernizing the bathrooms will appeal to both buyers and renters ↑
- Both paint interior walls — painting the interior walls will improve the home's curb appeal and make it more inviting ↑
ⓘ Cost ranges are severity-bucket heuristics (US national rule-of-thumb). Get contractor quotes + a written scope before underwriting a rehab budget.
Schools (NCES district)
- District
- Windham Exempted Village
- NCES district ID
- 3904566
- Math proficiency
- 27% ▼ -27.00%
- Reading proficiency
- 43% ▼ -9.00%
- Median HH income
- $40,882
- Composite
- 29.42/100
- National rank
- #6522
- State rank
- #564 of 656 in OH
Livability — Windham
- Score
- 62/100
- State rank
- #886
- US rank
- #16824
Category grades
Schools grade is shown separately in the Schools card above.
Census & demographics
- Census place
- Windham, OH
- County
- Portage · 165,699 people
- Metro
- Akron, OH
- Population (ZIP)
- 3,555
- Household income
- $65,147
- Rent vs Own
- Severe rent burden
- 12.9
Population outlook (Portage County) Hauer SSP2
- Today (2025)
- 166,109 people
- By 2030
- 167,752 · +1.0%
- By 2040
- 168,640 · +1.5%
- By 2050
- 167,469 · +0.8%
- By 2075
- 170,131 · +2.4%
- By 2100
- 167,958 · +1.1%
Race, ethnicity, and origin ACS 2023
- Neighborhood character
- Predominantly White (89%)
- Race & ethnicity
- White 89% Two or more races 8% Hispanic / Latino 3% Black 3%
- Common ancestry
- Romanian 5% Iranian 1% Scotch-Irish 1%
- Foreign-born
- 0%
Political lean MEDSL · Portage
- 2024 margin
- R (+15.5) · D 41.8% · R 57.3%
- 2008→2024 swing
- -24.5pp toward R · 2008: 9.0pp · 2024: -15.5pp
- All cycles
- 2024: R+15.5 2020: R+12.5 2016: R+10.2 2012: D+4.9 2008: D+9.0
Not yet ingested
- Civics
- —
Market trends
- HPI YoY
- ▼ -49.36%
- Current HPI
- 173.5838
- Rent YoY
- —
- Metro
- —
- State GDP YoY
- ▲ 1.98%
- F500 in state
- 48
Industry mix (Fortune 500 HQ in OH)
| Industry | F500 HQs | Revenue |
|---|---|---|
| Insurance | 3 | $145B |
|
||
| Industrial Machinery | 3 | $49B |
|
||
| Financial Services | 3 | $24B |
|
||
| Consumer Goods | 2 | $93B |
|
||
| Aerospace / Defense | 2 | $47B |
|
||
| Utilities | 2 | $33B |
|
||
Price history
+8.5% since first listed4 events — show timeline
- 2026-04-15 Price Changed $189,900 MLSNOW
- 2025-10-29 Listed $207,900 MLSNOW
- 2003-03-31 Listing Removed — MLSNOW
- 2002-09-26 Listed $175,000 MLSNOW
Cash-flow waterfall
monthlySold comps — $/sqft
last 12 mo · ≤1 miLoading sold comps…