 🏗️ New Construction
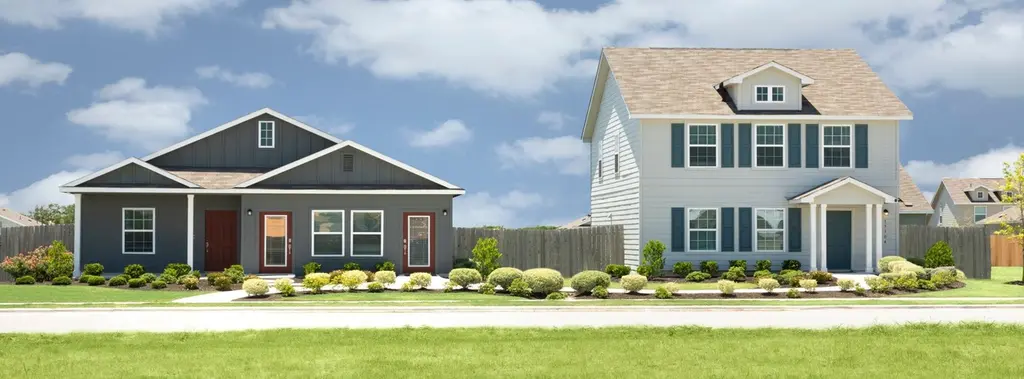
Sentosa Plan · Elgin, TX
Flood risk 1/10 · Minimal
- FEMA flood zone
- X (unshaded)
- Chance of flooding over 30 yrs
- 0.0%
- Est. flood insurance / yr
- $507 – $1,088
Fire risk 2/10 · Minimal
- Est. fire insurance / yr
- $1,222 – $2,270
Heat risk 8/10 · Major
- Hot days now (above 109°F)
- 7 days/yr
- Hot days in 30 yrs
- 24 days/yr
Wind risk 8/10 · Major
- Chance of severe wind over 30 yrs
- 80.0%
Air-quality risk 1/10 · Minimal
- Unhealthy air days now
- 0 days/yr
- Unhealthy air days in 30 yrs
- 0 days/yr
Risk factors via First Street. Map © Google.
Why this score? — see what drove the D+ grade
The composite is a weighted blend of 9 inputs, each scored 0–100. Each bar is that input's sub-score; the figure is the points it added to the 100-point composite (weight × sub-score).
- Cash flow +10.4/30.0
- Appreciation +10.0/10.0
- ARV discount +7.5/15.0
- Condition / age +4.0/5.0
- Livability +3.7/5.0
- Rent growth +3.3/5.0
- 1% rule +3.1/10.0
- DSCR +3.0/10.0
- Schools +2.0/10.0
$250,999
🖨 Deal sheet 📄 Offer letter ✓ Due diligence
Listing remarks
Cottage II is a collection of new homes for sale at Elm Creek, a masterplan community in the charming city of Elgin, TX. The community offers affordable homes and access to a state-of-the-art community center. There are tons of local shops and restaurants nearby, plus Austin is only 40 minutes away for more entertainment options.
Key facts
- Masterplan community
- Community center
- Restaurants nearby
Tags
Property features AI
Finance
- Other: By appointment only showing
- Financial info: List price $250,999
Exterior
- Parking: Attached 2-car garage; 2 parking spaces total
- Home design: Single-family plan (Sentosa); Located in Elgin, TX
- Construction: New construction (Plan)
- Exterior features: Living area approximately 1,575
Interior
- Bedrooms: 4 bedrooms
- Bathrooms: 2 bathrooms (full)
- Interior features: New construction plan (Sentosa)
Neighborhood map
What this means for you Summary
Snapshot
- This is a 4-bed/2.0-bath single-family listed at $251k. Condition is rated good.
Deal economics
- At list price, monthly cash flow is $-142 ($-2k/yr) — negative.
- To cash-flow at today's rent, offer at most $247k (1.7% below list).
- To meet the 1% rule (rent ≥ 1% of price), the offer needs to be $216k (14.0% below list).
- Recommended offer: $216k (14.0% below list) — sets the bar for 1% rule.
- Cap rate 5.7% vs local median 4.4% in Elgin — meaningfully above typical; check what's discounted (condition, days-on-market, listing class) to confirm the premium yield is real.
Location & tenants
- Location reads 74/100 on livability (#167 in TX, #4,404 nationally) — a middle-class / working-renter tenant base. Strengths: cost of living A+, housing A+, health & safety A+; Watch: schools F, amenities F, commute F.
- Elgin ISD (rural): math 17% / reading 26% proficiency, ranked #741 of 826 in TX (top 90%) — low school quality limits family demand, transient renter base, plan for 1-2y turnover; 67% free/reduced lunch — lower-income household profile, screen leases tightly.
- Market conditions: Rents rising (+3.1%/yr); 807 active listings in the ZIP; 17 comparable units currently listed for rent nearby; rentals at typical pace (median 20d on market — plan ~3-4 weeks tenant-placement turnaround); solid renter incomes; 17,121 units permitted in Travis County in 2024 (11,963 in 5+ unit buildings).
Forward outlook
- In year one you build about $29k of equity ($2k loan paydown + $27k appreciation (10.0% local appreciation)).
- Travis County population projected at +60% by 2050 — long-run rental-demand tailwind backs the buy-and-hold thesis.
- By year 2, paydown + projected appreciation supports a ~$46k cash-out refi (75% LTV) — recoverable capital for the next deal without selling this one.
Negotiation context
- It's been on market 36 days — a 3% lower offer ($243k) is reasonable based on typical stale-listing flexibility.
Risks & watch-outs
- Climate carrying-cost: severe wind risk, 80% chance of damaging wind over 30y; extreme-heat days projected 7→24/yr by 2055 (HVAC capex compounding) — expect insurance premiums to compound above CPI over the hold.
Questions for the listing agent
- What do current leases actually rent for vs. the listed asking? Can we see a recent rent roll and the last 12 months of T-12 income?
- It's been on market 36 days. Have you received any prior offers? Is the seller open to a 14% concession, seller financing, or rate buy-down credit?
- Is there a deadline driving the sale (1031 exchange, divorce, estate, relocation)? That informs how much negotiation room exists.
- Schools are F-rated, which usually means shorter tenancies and higher turnover. Who's the typical renter profile here, and what's been the actual vacancy rate?
- The area grade is low — what's the realistic commute time and amenity access for the typical tenant pool here? Any planned neighborhood developments (good or bad) we should know about?
- What's the average days-on-market for RENTAL listings here right now (not sales)? A rising rental-DOM trend means longer vacancies and softer asking-rent achievability than the comps imply.
- What's the recent tenant-quality profile in this submarket — average credit score on applications, eviction rate, late-payment / NSF rate, and stable-employment percentage? A property-management company in the area should have these aggregated.
- How much new for-sale + rental construction is in the pipeline within 1–3 miles? Heavy new supply typically softens prices + rents 12–24 months out; constrained supply supports both.
Investment metrics
- 1% rule
- 0.81% ✗
- Cap rate
- 5.66%
- Cash-on-cash
- -2.28%
- DSCR
- 0.90
- GRM
- 10.3
CMA / ARV
- ARV (median comp)
- $267,348
- List price
- $250,999
- Delta
- -6.12%
- Verdict
- FAIR
- Comps
- 20 within 1.0 mi
Show comp detail 12 sales within ~0.75 mi
| Address | Dist | Beds/Ba | Sqft | Sold | Price | $/sf | Match |
|---|---|---|---|---|---|---|---|
| 13409 Trumpet Creeper Dr | 0.23mi | 4/2.0 | 1,575 (0%) | 1mo | $248,990 | $158 | 89 |
| 23821 Glowing Embers Dr | 0.23mi | 4/2.0 | 1,667 (+6%) | 1mo | $245,999 | $148 | 79 |
| 13316 Trumpet Creeper Dr | 0.21mi | 3/2.0 (-1) | 1,510 (-4%) | 1mo | $250,999 | $166 | 78 |
| 13400 Trumpet Creeper Dr | 0.23mi | 3/2.0 (-1) | 1,510 (-4%) | 1mo | $257,990 | $171 | 77 |
| 13324 Trumpet Creeper Dr | 0.22mi | 3/2.0 (-1) | 1,510 (-4%) | 2mo | $252,990 | $168 | 77 |
| 23829 Glowing Embers Dr | 0.26mi | 4/2.0 | 1,667 (+6%) | 2mo | $249,990 | $150 | 77 |
| 23817 Glowing Embers Dr | 0.23mi | 3/2.0 (-1) | 1,474 (-6%) | 1mo | $221,990 | $151 | 73 |
| 23501 Firelight Dr | 0.12mi | 3/2.0 (-1) | 1,411 (-10%) | 2mo | $228,990 | $162 | 71 |
| 13321 Trumpet Creeper Dr | 0.19mi | 3/2.0 (-1) | 1,411 (-10%) | 1mo | $237,999 | $169 | 68 |
| 13309 Trumpet Creeper Dr | 0.18mi | 3/2.0 (-1) | 1,402 (-11%) | 2mo | $226,990 | $162 | 67 |
| 13405 Trumpet Creeper Dr | 0.22mi | 3/2.0 (-1) | 1,411 (-10%) | 2mo | $237,990 | $169 | 66 |
| 13421 Trumpet Creeper Dr | 0.25mi | 3/2.0 (-1) | 1,402 (-11%) | 1mo | $241,999 | $173 | 65 |
Match score weights: distance 35% · size 25% · config 20% · recency 20%. Top-matched comps best support the ARV.
Projected returns pro-forma
10.0% appreciation · 3.12% rent growth · sell at horizon
- IRR
- 22.7%
- Equity multiple
- 2.83×
- Total profit
- $136,851
- Equity at exit
- $240,848
- IRR
- 20.3%
- Equity multiple
- 6.49×
- Total profit
- $410,714
- Equity at exit
- $519,398
Cash invested: $74,857 (down + closing). Projections, not guarantees.
Landlord ↔ Tenant lean methodology
- Overall (STATE)
- 87 Strongly Landlord-Friendly
- State Texas
- 87 Strongly Landlord-Friendly · R+5
- County
- — inherits STATE
- City
- — inherits STATE
ZIP-level market 78621
- Home prices YoY
- 7.6%
- Rents YoY
- 3.1%
- Active inventory
- 807
- Price-to-rent
- 9.7×
Monthly cashflow live
- Estimated rent
- $2,159 high interval (Pro) →
- Mortgage (P&I)
- −$1,402
- Tax est. 1.5%
- −$334 /mo · $4,010/yr
- Insurance
- −$111
- HOA
- −$0
- Vacancy / Maint / Mgmt
- −$453
- Net cashflow
- $-142
Break-even live
UW: 25.0% down · 7.5% · 30yr · 1.5% tax · 5.0% vac · 8.0% maint · 8.0% mgmt
Financing live
Cash to close
- Down payment
- $66,837
- Closing costs
- $8,020
- Reserves months
- —
- Total cash needed
- —
Loan-product check · same deal, 3 products live
Conventional
25% down · 7.5% · 30yr
- Down + closing
- —
- Monthly P&I
- —
- Monthly cashflow
- —
- DSCR
- —
- Eligible?
- —
Personal DTI + credit; lowest rate.
DSCR
20% down · 8.5% · 30yr
- Down + closing
- —
- Monthly P&I
- —
- Monthly cashflow
- —
- DSCR
- —
- Eligible?
- —
No personal income docs; deal must DSCR.
Hard money
10% down · 12.0% · 12mo
- Down + closing
- —
- Monthly P&I
- —
- Monthly cashflow
- —
- DSCR
- —
- Eligible?
- —
Short-term bridge; refi at stabilization.
Rent comps 17 comps
| Address | Beds | Baths | Sqft | Rent | $/sqft | DOM | Units | Dist |
|---|---|---|---|---|---|---|---|---|
| 13249 Illumination Rd Unit R3 Elgin, TX | 4.0 | 3.0 | 2000 | $560 | $0.28 | 21d | 1 | 0.17mi |
| 13249 Illumination Rd Unit R2 Elgin, TX | 4.0 | 3.0 | 2000 | $600 | $0.30 | 17d | 1 | 0.17mi |
| 23408 Tiny Moons Way Elgin, TX | 4.0 | 2.5 | 2000 | $1,960 | $0.98 | 20d | 1 | 0.17mi |
| 13249 Illumination Rd Unit R4 Elgin, TX | 4.0 | 3.0 | 2000 | $589 | $0.29 | 43d | 1 | 0.24mi |
| 13305 Banquete St Elgin, TX | 4.0 | 2.0 | 1707 | $1,995 | $1.17 | 43d | 1 | 0.59mi |
| 13501 Mussel Run Elgin, TX | 4.0 | 2.0 | 1667 | $1,800 | $1.08 | 16d | 1 | 0.60mi |
| 13124 Maidenhair Trl Elgin, TX | 4.0 | 2.0 | 1448 | $1,775 | $1.23 | 16d | 1 | 0.64mi |
| 13124 Maidenhair Trl Elgin, TX | 4.0 | 2.0 | 1448 | $1,775 | $1.23 | 23d | 1 | 0.64mi |
| 17812 Prairie Verbena Ln Elgin, TX | 3.0 | 2.5 | 2049 | $2,199 | $1.07 | 43d | 1 | 0.65mi |
| 13520 Knights Branch Dr Elgin, TX | 3.0 | 2.5 | 1600 | $1,850 | $1.16 | 2d | 1 | 0.72mi |
| 13604 Menard Way Elgin, TX | 3.0 | 2.0 | 1474 | $1,875 | $1.27 | 23d | 1 | 0.74mi |
| 13725 Knights Branch Dr Elgin, TX | 4.0 | 2.5 | 1800 | $2,100 | $1.17 | 23d | 1 | 0.83mi |
| 13804 Knights Branch Dr Elgin, TX | 3.0 | 2.5 | 1427 | $1,900 | $1.33 | 4d | 1 | 0.85mi |
| 13121 Blackeyed Susan Trl Elgin, TX | 4.0 | 2.0 | 1586 | $1,800 | $1.13 | 17d | 1 | 0.88mi |
| 14129 Tordillo Dr Elgin, TX | 4.0 | 2.5 | 1874 | $2,675 | $1.43 | 23d | 1 | 0.98mi |
| 14129 Tordillo Dr Unit NA Elgin, TX | 4.0 | 2.5 | 1874 | $2,595 | $1.38 | 4d | 1 | 0.98mi |
| 13501 Sierra Wind Ln Elgin, TX | 4.0 | 2.5 | 2066 | $2,500 | $1.21 | 20d | 1 | 1.35mi |
Listing history 14 events
-
2026-06-18days on market $250,999 Active 36 DOM
-
2026-06-17days on market $250,999 Active 35 DOM
-
2026-06-16days on market $250,999 Active 34 DOM
-
2026-06-15days on market $250,999 Active 33 DOM
-
2026-06-13days on market $250,999 Active 31 DOM
-
2026-06-09days on market $250,999 Active 27 DOM
-
2026-06-08days on market $250,999 Active 26 DOM
-
2026-06-07days on market $250,999 Active 25 DOM
-
2026-06-04days on market $250,999 Active 22 DOM
-
2026-06-03days on market $250,999 Active 21 DOM
-
2026-06-02days on market $250,999 Active 20 DOM
-
2026-06-01days on market $250,999 Active 19 DOM
-
2026-05-31days on market $250,999 Active 18 DOM
-
2026-05-13$250,999 Active 331-char remark
ⓘ Source: listings_history table (triggers on properties + properties_extension) + one-shot
backfill from property_details.listing_events for pre-trigger history.
Climate risk First Street
- Flood 1/10 Low FEMA zone X (unshaded) · 0% chance over 30 yrs
- Wildfire 2/10 Low
- Heat 8/10 Severe 7 d/yr ≥109°F today · 24 d/yr by 30 yrs out
- Wind 8/10 Severe 80% chance of damaging wind over 30 yrs
- Air quality 1/10 Low 0 unhealthy d/yr today · 0 by 30 yrs out
Nearby sold comps map
Loading sold comps map…
Walkable amenities ~0.75 mi
Loading nearby amenities…
Taxation est. · year 1
- Rental income
- $25,907
- − Mortgage interest
- −$14,976
- − Property taxes
- −$4,010
- − Insurance
- −$1,337
- − Repairs & maintenance
- −$2,073
- − Management
- −$2,073
- − Depreciation
- −$7,777
- Taxable loss
- −$6,338
- Est. tax savings @ 24.0%
- +$1,521
- After-tax cash flow
- $-183/yr
For passive investors: Depreciation is non-cash, so a rental often shows a tax loss while cash-flowing — sheltering income. Rental losses are passive: they offset passive income freely, and up to $25,000/yr can offset ordinary (W-2) income if you actively participate and your MAGI is under $100k (phasing out to $0 by $150k); unused losses carry forward. On sale, claimed depreciation is recaptured at up to 25%, and gains may owe capital-gains tax (a 1031 exchange can defer both). Figures are a year-1 estimate at your 24.0% rate — not tax advice; consult a CPA.
Condition & rehab AI · 1 photo
This home is in good condition with a good exterior and landscaping. A fresh coat of paint and some landscaping improvements would significantly enhance its curb appeal and value.
Value-add opportunities
- Both Paint exterior walls — Enhances curb appeal and can increase both resale and rental value
- Both Upgrade landscaping — Improves curb appeal and can increase both resale and rental value
Renovation cost estimate screening
Value-add ROI direction
- Both Paint exterior walls — Enhances curb appeal and can increase both resale and rental value ↑
- Both Upgrade landscaping — Improves curb appeal and can increase both resale and rental value ↑
ⓘ Cost ranges are severity-bucket heuristics (US national rule-of-thumb). Get contractor quotes + a written scope before underwriting a rehab budget.
Schools (NCES district)
- District
- Elgin ISD
- NCES district ID
- 4818360
- Math proficiency
- 17% ▼ -9.00%
- Reading proficiency
- 26% ▼ -5.00%
- Median HH income
- $55,176
- Composite
- 19.62/100
- National rank
- #8749
- State rank
- #741 of 826 in TX
Livability — Elgin
- Score
- 74/100
- State rank
- #167
- US rank
- #4404
Category grades
Schools grade is shown separately in the Schools card above.
Census & demographics
- County
- Bastrop County · 68,601 people
- City population
- 27,860
- Metro
- Austin-Round Rock-Georgetown, TX
- Population (ZIP)
- 30,411
- Household income
- $98,534
- Rent vs Own
- Severe rent burden
- 235.0
Population outlook (Travis County) Hauer SSP2
- Today (2025)
- 1,545,133 people
- By 2030
- 1,729,269 · +11.9%
- By 2040
- 2,097,596 · +35.8%
- By 2050
- 2,463,890 · +59.5%
- By 2075
- 3,249,374 · +110.3%
- By 2100
- 3,801,868 · +146.1%
Race, ethnicity, and origin ACS 2023
- Neighborhood character
- Diverse neighborhood (Simpson 0.64)
- Race & ethnicity
- Hispanic / Latino 46% White 38% Two or more races 19% Black 11% Native American 1%
- Hispanic origin (detail)
- Mexican 38%
- Common ancestry
- Slovak 2% Italian 2% Romanian 1%
- Foreign-born
- 17% · Canada, Vietnam
- Languages at home
- 63% English-only · Spanish 36%
Political lean MEDSL · Travis
- 2024 margin
- Solid D (+39.3) · D 68.8% · R 29.4% · Other 1.8%
- 2008→2024 swing
- +9.9pp toward D · 2008: 29.4pp · 2024: 39.3pp
- All cycles
- 2024: D+39.3 2020: D+45.0 2016: D+38.9 2012: D+23.9 2008: D+29.4
Not yet ingested
- Civics
- —
Market trends
- HPI YoY
- ▲ 29.47%
- Current HPI
- 416.87
- Rent YoY
- ▲ 3.12%
- Metro
- Austin-Round Rock-Georgetown, TX
- State GDP YoY
- ▲ 3.95%
- F500 in state
- 110
Industry mix (Fortune 500 HQ in TX)
| Industry | F500 HQs | Revenue |
|---|---|---|
| Energy | 16 | $1,198B |
|
||
| Technology | 5 | $198B |
|
||
| Engineering / Construction | 4 | $72B |
|
||
| Energy Services | 3 | $60B |
|
||
| Utilities | 3 | $41B |
|
||
| Healthcare | 2 | $330B |
|
||
Cash-flow waterfall
monthlySold comps — $/sqft
last 12 mo · ≤1 miLoading sold comps…