 🔨 Auction
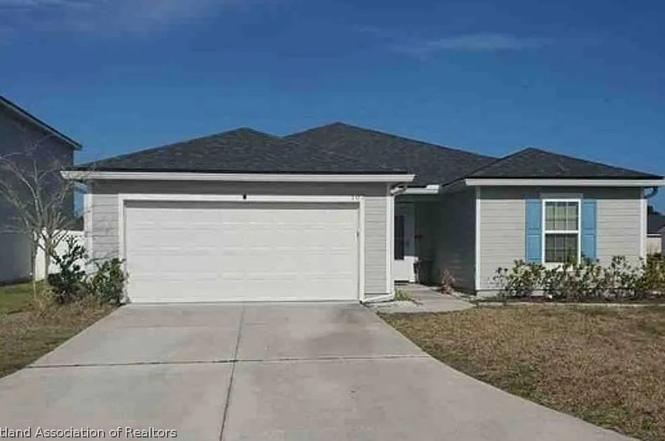
107 Birchfield Ln · World Golf Village, FL
Flood risk 1/10 · Minimal
- FEMA flood zone
- X (unshaded)
- Chance of flooding over 30 yrs
- 0.0%
- Est. flood insurance / yr
- $507 – $1,088
Fire risk 6/10 · Moderate
- Est. fire insurance / yr
- $947 – $1,759
Heat risk 9/10 · Severe
- Hot days now (above 107°F)
- 7 days/yr
- Hot days in 30 yrs
- 20 days/yr
Wind risk 9/10 · Severe
- Chance of severe wind over 30 yrs
- 99.0%
Air-quality risk 3/10 · Minor
- Unhealthy air days now
- 3 days/yr
- Unhealthy air days in 30 yrs
- 3 days/yr
Risk factors via First Street. Map © Google.
Why this score? — see what drove the F grade
The composite is a weighted blend of 9 inputs, each scored 0–100. Each bar is that input's sub-score; the figure is the points it added to the 100-point composite (weight × sub-score).
- ARV discount +7.5/15.0
- Cash flow +6.4/30.0
- Schools +6.4/10.0
- Livability +3.9/5.0
- Rent growth +2.5/5.0
- Condition / age +2.5/5.0
- 1% rule +1.6/10.0
- DSCR +0.7/10.0
- Appreciation +0.0/10.0
$5,000
🖨 Deal sheet 📄 Offer letter ✓ Due diligence
Listing remarks
Foreclosure Auction Ends June 18, 2026 at 12:00 PM EST. Explore this charming 3-bedroom, 2-bath residence set in a peaceful and well-located Saint Augustine community. The list price is the opening bid for the online auction. Sold As-is. Explore more details and submit your bid through Federa Home App.
Key facts
- 7,841 sq ft lot
- 2 garage spots
- Built 2021
Property features AI
Finance
- Other: Property type: Residential; Property subtype: Single Family Residence; Lot size: 0.18 Acres
- Financial info: No investor or income/expense details provided
- HOA & community: No HOA details provided
Exterior
- Parking: Garage with 2 spaces
- Security: No security details provided
- Utilities: Other water source; Other sewer
- Home design: Single-family residence; One level; Planned Unit Development (PUD) zoning
- Construction: Construction materials: see remarks
- Exterior features: Front porch; Other roof
Interior
- Kitchen: No appliance details provided
- Bedrooms: Total of 1 room (room breakdown not provided)
- Flooring: Other
- Bathrooms: 2 full bathrooms
- Heating & cooling: No heating; No cooling
- Interior features: Other flooring
- Laundry & utility: No laundry details provided
Neighborhood map
What this means for you Summary
Snapshot
- This is a 3-bed/2.0-bath single-family listed at $5k.
Deal economics
- At list price, monthly cash flow is $-674 ($-8k/yr) — negative.
- The deal already cash-flows at list — no discount required.
- Meets the 1% rule at list price ($3k rent vs $5k).
- Cap rate 4.2% vs local median 3.0% in World Golf Village — top-decile yield for the area; either an underpriced asset or a hidden risk that comps aren't pricing in. Stress-test before assuming the spread holds.
Location & tenants
- Location reads 78/100 on livability (#168 in FL, #2,512 nationally) — a middle-class / working-renter tenant base. Strengths: schools A+, crime A+, employment A+; Watch: amenities F, commute F.
- St. Johns (rural): math 75% / reading 73% proficiency, ranked #2 of 73 in FL (top 3%) — strong family-tenant draw, lease renewals of 3-5y typical; only 20% free/reduced lunch — higher-income household profile.
- Market conditions: Rents flat; 1323 active listings in the ZIP; 3 comparable units currently listed for rent nearby; rentals at typical pace (median 17d on market — plan ~3-4 weeks tenant-placement turnaround); high-income renter base; 5,575 units permitted in St. Johns County in 2024 (584 in 5+ unit buildings).
Forward outlook
- Local home prices are declining (-3.0%/yr); year-one equity from $3k of loan paydown is wiped out by about $12k of value loss. Plan a longer hold.
- St. Johns County population projected at +60% by 2050 — long-run rental-demand tailwind backs the buy-and-hold thesis.
Negotiation context
- Only 8 days on market — expect competitive offers; lowballing is unlikely to land.
Risks & watch-outs
- Watch-outs: property tax is 116.5% of price.
- Climate carrying-cost: severe wind risk, 99% chance of damaging wind over 30y; major wildfire risk; extreme-heat days projected 7→20/yr by 2055 (HVAC capex compounding) — expect insurance premiums to compound above CPI over the hold.
Questions for the listing agent
- What do current leases actually rent for vs. the listed asking? Can we see a recent rent roll and the last 12 months of T-12 income?
- Property tax is high relative to price — has the assessment been appealed recently, and will the sale trigger a re-assessment?
- Is there a deadline driving the sale (1031 exchange, divorce, estate, relocation)? That informs how much negotiation room exists.
- Schools are A-rated — typically a magnet for longer-tenancy family renters. What's the average tenant stay here, and is there a school-zone premium baked into asking?
- The area grade is low — what's the realistic commute time and amenity access for the typical tenant pool here? Any planned neighborhood developments (good or bad) we should know about?
- What's the average days-on-market for RENTAL listings here right now (not sales)? A rising rental-DOM trend means longer vacancies and softer asking-rent achievability than the comps imply.
- What's the recent tenant-quality profile in this submarket — average credit score on applications, eviction rate, late-payment / NSF rate, and stable-employment percentage? A property-management company in the area should have these aggregated.
- How much new for-sale + rental construction is in the pipeline within 1–3 miles? Heavy new supply typically softens prices + rents 12–24 months out; constrained supply supports both.
Investment metrics
- 1% rule
- 0.66% ✗
- Cap rate
- 4.21%
- Cash-on-cash
- -7.43%
- DSCR
- 0.67
- GRM
- 12.7
CMA / ARV
- ARV (on-the-fly)
- $388,397
- Comps found
- 11
Show comp detail 11 sales within ~0.75 mi
| Address | Dist | Beds/Ba | Sqft | Sold | Price | $/sf | Match |
|---|---|---|---|---|---|---|---|
| 64 Birdfield Ct | 0.11mi | 3/2.0 | 1,710 (-0%) | 9mo | $350,000 | $205 | 87 |
| 44 Newland Ct | 0.10mi | 3/2.0 | 1,626 (-5%) | 9mo | $355,000 | $218 | 80 |
| 339 Meadow Ridge Dr | 0.17mi | 3/2.0 | 1,710 (-0%) | 15mo | $419,000 | $245 | 80 |
| 490 Meadow Ridge Dr | 0.19mi | 3/2.0 | 1,710 (-0%) | 15mo | $426,000 | $249 | 79 |
| 120 Moorcroft Way | 0.08mi | 3/2.0 | 1,864 (+9%) | 7mo | $374,000 | $201 | 76 |
| 152 Birdfield Ct | 0.14mi | 3/2.0 | 1,711 (0%) | 24mo | $425,000 | $248 | 74 |
| 21 Newland Ct | 0.15mi | 3/2.0 | 1,626 (-5%) | 17mo | $370,000 | $228 | 71 |
| 769 Trellis Bay Dr | 0.36mi | 4/2.0 (+1) | 1,653 (-3%) | 4mo | $375,000 | $227 | 69 |
| 62 Newland Ct | 0.10mi | 3/2.0 | 1,861 (+9%) | 17mo | $411,500 | $221 | 67 |
| 701 Meadow Ridge Dr | 0.12mi | 3/2.0 | 1,864 (+9%) | 18mo | $390,000 | $209 | 65 |
| 46 Great Pond Way | 0.31mi | 3/2.0 | 1,503 (-12%) | 1mo | $365,000 | $243 | 64 |
Match score weights: distance 35% · size 25% · config 20% · recency 20%. Top-matched comps best support the ARV.
Projected returns pro-forma
-3.0% appreciation · 0.08% rent growth · sell at horizon
- IRR
- -32.5%
- Equity multiple
- -0.04×
- Total profit
- $-113,065
- Equity at exit
- $57,911
- IRR
- -59.2%
- Equity multiple
- -0.67×
- Total profit
- $-181,662
- Equity at exit
- $33,581
Cash invested: $108,751 (down + closing). Projections, not guarantees.
Landlord ↔ Tenant lean methodology
- Overall (STATE)
- 87 Strongly Landlord-Friendly
- State Florida
- 87 Strongly Landlord-Friendly · R+3
- County
- — inherits STATE
- City
- — inherits STATE
ZIP-level market 32092
- Home prices YoY
- -32.2%
- Rents YoY
- 0.1%
- Active inventory
- 1323
- Price-to-rent
- 0.2×
Monthly cashflow live
- Estimated rent
- $2,545 medium interval (Pro) →
- Mortgage (P&I)
- −$2,037
- Tax est. 1.5%
- −$485 /mo · $5,826/yr
- Insurance
- −$162
- HOA
- −$0
- Vacancy / Maint / Mgmt
- −$534
- Net cashflow
- $-674
Break-even live
UW: 25.0% down · 7.5% · 30yr · 1.5% tax · 5.0% vac · 8.0% maint · 8.0% mgmt
Financing live
Cash to close
- Down payment
- $97,099
- Closing costs
- $11,652
- Reserves months
- —
- Total cash needed
- —
Loan-product check · same deal, 3 products live
Conventional
25% down · 7.5% · 30yr
- Down + closing
- —
- Monthly P&I
- —
- Monthly cashflow
- —
- DSCR
- —
- Eligible?
- —
Personal DTI + credit; lowest rate.
DSCR
20% down · 8.5% · 30yr
- Down + closing
- —
- Monthly P&I
- —
- Monthly cashflow
- —
- DSCR
- —
- Eligible?
- —
No personal income docs; deal must DSCR.
Hard money
10% down · 12.0% · 12mo
- Down + closing
- —
- Monthly P&I
- —
- Monthly cashflow
- —
- DSCR
- —
- Eligible?
- —
Short-term bridge; refi at stabilization.
Rent comps 3 comps
| Address | Beds | Baths | Sqft | Rent | $/sqft | DOM | Units | Dist |
|---|---|---|---|---|---|---|---|---|
| 581 Meadow Ridge Dr Saint Augustine, FL | 3.0 | 2.0 | 1864 | $2,250 | $1.21 | 17d | 1 | 0.17mi |
| 319 Greenway Ln Saint Augustine, FL | 3.0 | 2.0 | 1948 | $2,850 | $1.46 | 3d | 1 | 0.87mi |
| 64 Rose Dew Dr Saint Augustine, FL | 3.0 | 2.0 | 1713 | $2,695 | $1.57 | 19d | 1 | 1.11mi |
Listing history 7 events
-
2026-06-18days on market $5,000 Active 8 DOM
-
2026-06-17days on market $5,000 Active 7 DOM
-
2026-06-16days on market $5,000 Active 6 DOM
-
2026-06-15days on market $5,000 Active 5 DOM
-
2026-06-13days on market $5,000 Active 3 DOM
-
2026-06-13remarks 303-char remark
-
2026-06-13$5,000 Active 2 DOM
ⓘ Source: listings_history table (triggers on properties + properties_extension) + one-shot
backfill from property_details.listing_events for pre-trigger history.
Climate risk First Street
- Flood 1/10 Low FEMA zone X (unshaded) · 0% chance over 30 yrs
- Wildfire 6/10 Major
- Heat 9/10 Extreme 7 d/yr ≥107°F today · 20 d/yr by 30 yrs out
- Wind 9/10 Extreme 99% chance of damaging wind over 30 yrs
- Air quality 3/10 Moderate 3 unhealthy d/yr today · 3 by 30 yrs out
Nearby sold comps map
Loading sold comps map…
Walkable amenities ~0.75 mi
Loading nearby amenities…
Taxation est. · year 1
- Rental income
- $30,540
- − Mortgage interest
- −$21,756
- − Property taxes
- −$5,826
- − Insurance
- −$1,942
- − Repairs & maintenance
- −$2,443
- − Management
- −$2,443
- − Depreciation
- −$11,299
- Taxable loss
- −$15,170
- Est. tax savings @ 24.0%
- +$3,641
- After-tax cash flow
- $-4,442/yr
For passive investors: Depreciation is non-cash, so a rental often shows a tax loss while cash-flowing — sheltering income. Rental losses are passive: they offset passive income freely, and up to $25,000/yr can offset ordinary (W-2) income if you actively participate and your MAGI is under $100k (phasing out to $0 by $150k); unused losses carry forward. On sale, claimed depreciation is recaptured at up to 25%, and gains may owe capital-gains tax (a 1031 exchange can defer both). Figures are a year-1 estimate at your 24.0% rate — not tax advice; consult a CPA.
Schools (NCES district)
- District
- St. Johns
- NCES district ID
- 1201740
- Math proficiency
- 75% ▼ -5.00%
- Reading proficiency
- 73% ▼ -2.00%
- Median HH income
- $66,842
- Composite
- 64.31/100
- National rank
- #556
- State rank
- #2 of 73 in FL
Livability — World Golf Village
- Score
- 78/100
- State rank
- #168
- US rank
- #2512
Category grades
Schools grade is shown separately in the Schools card above.
Census & demographics
- County
- Saint Johns County · 301,599 people
- City population
- 48,288
- Metro
- Jacksonville, FL
- Population (ZIP)
- 53,071
- Household income
- $131,020
- Rent vs Own
- Severe rent burden
- 706.0
Population outlook (St. Johns County) Hauer SSP2
- Today (2025)
- 303,941 people
- By 2030
- 342,590 · +12.7%
- By 2040
- 417,328 · +37.3%
- By 2050
- 487,011 · +60.2%
- By 2075
- 635,395 · +109.1%
- By 2100
- 717,469 · +136.1%
Race, ethnicity, and origin ACS 2023
- Neighborhood character
- Predominantly White (75%)
- Race & ethnicity
- White 75% Two or more races 11% Hispanic / Latino 9% Black 6% Asian 3%
- Hispanic origin (detail)
- Mexican 1% Puerto Rican 2% Cuban 2%
- Common ancestry
- Lithuanian 3% Scotch-Irish 3% Slovak 3%
- Foreign-born
- 10% · Canada, Vietnam
- Languages at home
- 87% English-only · Spanish 6% Russian/Polish/Slavic 2% Other Indo-European 2%
Political lean MEDSL · St. Johns
- 2024 margin
- Solid R (+31.4) · D 33.9% · R 65.2%
- 2008→2024 swing
- +0.2pp no change · 2008: -31.6pp · 2024: -31.4pp
- All cycles
- 2024: R+31.4 2020: R+26.7 2016: R+33.4 2012: R+37.8 2008: R+31.6
Not yet ingested
- Civics
- —
Market trends
- HPI YoY
- ▼ -123.26%
- Current HPI
- 259.732
- Rent YoY
- ▲ 0.08%
- Metro
- Jacksonville, FL
- State GDP YoY
- ▲ 3.28%
- F500 in state
- 36
Industry mix (Fortune 500 HQ in FL)
| Industry | F500 HQs | Revenue |
|---|---|---|
| Industrial Technology | 2 | $29B |
|
||
| Insurance | 2 | $17B |
|
||
| Retail | 1 | $60B |
|
||
| Technology Distribution | 1 | $58B |
|
||
| Homebuilding | 1 | $35B |
|
||
| Technology Manufacturing | 1 | $35B |
|
||
Price history
1 event — show timeline
- 2026-06-10 Listed $5,000 HAOR as distributed by MLS GRID
Property tax history
+49.8%/yrLatest (2025): $4,798 · +8.3% YoY. Source: county tax records.
Cash-flow waterfall
monthlySold comps — $/sqft
last 12 mo · ≤1 miLoading sold comps…