 Fourplex
🌊 Lakefront
Fourplex
🌊 Lakefront
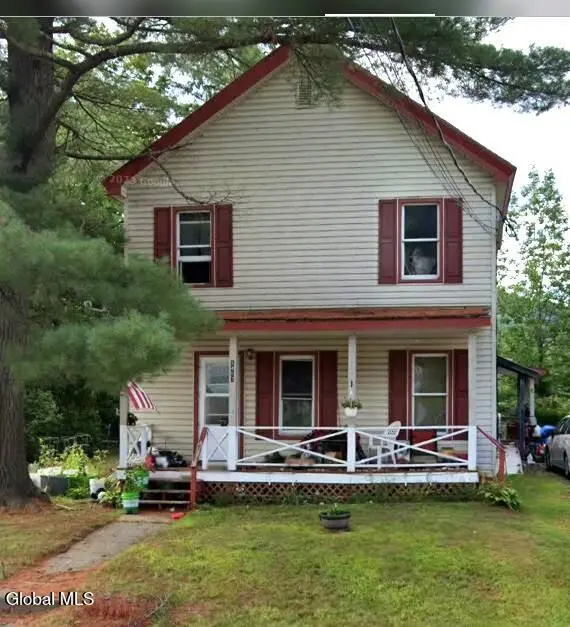
1457 New York 30 · Wells, NY
Flood risk 10/10 · Severe
- FEMA flood zone
- A
- Chance of flooding over 30 yrs
- 0.99%
- Est. flood insurance / yr
- $946 – $6,584
Fire risk 3/10 · Minor
- Est. fire insurance / yr
- $691 – $1,283
Heat risk 1/10 · Minimal
- Hot days now (above 91°F)
- 8 days/yr
- Hot days in 30 yrs
- 18 days/yr
Wind risk 2/10 · Minimal
- Chance of severe wind over 30 yrs
- 2.0%
Air-quality risk 1/10 · Minimal
- Unhealthy air days now
- 0 days/yr
- Unhealthy air days in 30 yrs
- 0 days/yr
Risk factors via First Street. Map © Google.
Why this score? — see what drove the B grade
The composite is a weighted blend of 9 inputs, each scored 0–100. Each bar is that input's sub-score; the figure is the points it added to the 100-point composite (weight × sub-score).
- Cash flow +26.0/30.0
- Appreciation +9.2/10.0
- DSCR +8.7/10.0
- ARV discount +7.5/15.0
- 1% rule +6.3/10.0
- Schools +4.9/10.0
- Livability +3.1/5.0
- Rent growth +2.5/5.0
- Condition / age +2.5/5.0
$399,900
🖨 Deal sheet (PDF) 📄 Offer letter ✓ Due diligence
Multi-family units
County records classify this as Multi-Family (5+ Unit). Listing-text estimate: 4 units. estimate disagrees with records
5+ unit building — per-unit beds/baths from public records are typically unavailable; the breakdown below (if shown) is an estimate from the listing text.
Listing remarks
Rare Adirondack Investment & Lakefront Retreat Opportunity on Algonquin Lake! Discover the perfect blend of income potential and personal enjoyment with this unique 4-unit property nestled in the heart of the Adirondacks on beautiful Algonquin Lake. Whether you're seeking a turnkey investment, a family compound, or your own waterfront escape with rental income, this property delivers endless possibilities. The property features four well-maintained units with one unit currently open and ready for a new owner to immediately enjoy lakeside living while generating income from the additional units. Enjoy stunning lake views, direct access to outdoor recreation, and the peaceful beauty
Key facts
- Lakefront retreat
- Income potential
- Stunning lake views
Tags
Property features AI
Exterior
- Parking: Six parking spaces
- Utilities: 150 Amp electrical service; Public water; Public sewer
- Home design: Quadruplex; Multiple stories (units with 1st and 2nd floor layouts)
- Construction: Vinyl siding; Stone foundation; Metal roof; Built living area recorded
- Exterior features: Front porch; Side covered porch; Lakefront with views of Lake Algonquin
Interior
- Kitchen: Unit 3 includes kitchens on both 1st and 2nd floors
- Bedrooms: Unit 1: 1 bedroom (1st floor); Unit 2: 1 bedroom (1st floor); Unit 3: 2 bedrooms (1 on 1st floor, 1 on 2nd floor); Unit 4: 2 bedrooms (1 on 2nd floor)
- Flooring: Wood flooring; Laminate flooring; Linoleum flooring
- Bathrooms: Five full bathrooms total; Units 1 and 2: each has 1 full bath (1st floor); Unit 3: 2 full baths (1 on 1st floor, 1 on 2nd floor); Unit 4: 1 full bath (1st floor)
- Heating & cooling: Baseboard heating; Electric heating; Propane heating
- Interior features: Wood, laminate and linoleum flooring; Full unfinished basement
- Laundry & utility: Washer hookup; Electric dryer hookup
Neighborhood map
What this means for you Summary
Snapshot
- This is a 4 × 6-bed/5.0-bath units multifamily listed at $400k.
Deal economics
- At list price, monthly cash flow is $681 ($8k/yr) — positive. Per door: $170/mo.
- The deal already cash-flows at list — no discount required.
- Meets the 1% rule at list price ($5k rent vs $400k).
- Recommended offer: $388k (3.0% below list) — sets the bar for market timing.
Location & tenants
- Location reads 61/100 on livability (#921 in NY) — a middle-class / working-renter tenant base. Strengths: housing A+, cost of living B+, employment B; Watch: health & safety C-, crime F, amenities F.
- Wells Central School District (rural): math 55% / reading 55% proficiency, ranked #369 of 755 in NY (top 49%) — acceptable for families but not a draw, mixed tenant base, ~2y average lease.
- Market conditions: 10 active listings in the ZIP; 55 units permitted in Hamilton County in 2024 (0 in 5+ unit buildings).
Forward outlook
- In year one you build about $36k of equity ($3k loan paydown + $33k appreciation (8.3% local appreciation)).
- Hamilton County population projected at -26% by 2050 — secular population decline; favor cash flow + early exit over multi-decade hold.
- At projected returns (8.3% appreciation + 3.0% rent growth), your $112k cash investment doubles in ~3 years — after that, you're playing with house money.
- By year 2, paydown + projected appreciation supports a ~$58k cash-out refi (75% LTV) — recoverable capital for the next deal without selling this one.
Negotiation context
- It's been on market 44 days — a 3% lower offer ($388k) is reasonable based on typical stale-listing flexibility.
- 3 sale attempts since 3y ago with the ask held roughly flat each time — persistent listings suggest the price (not the market) is what's stuck; bring a comps-based counter.
- Current owner paid $144k; list at $400k implies a 178% gain — meaningful room to come down on a strong offer.
Risks & watch-outs
- Watch-outs: flood insurance adds $314/mo; built in 1935 — expect roof / HVAC / electrical / plumbing capex.
- Climate carrying-cost: in FEMA flood zone A (mandatory federal flood insurance) — expect insurance premiums to compound above CPI over the hold.
Questions for the listing agent
- It's been on market 44 days. Have you received any prior offers? Is the seller open to a 3% concession, seller financing, or rate buy-down credit?
- Can we see the unit-by-unit rent roll, current vacancy, and any below-market leases? What's the average tenancy length?
- What capital expenditures (roof, boiler, parking lot, exteriors) have been made in the last 5 years, and what's planned in the next 2?
- Built in 1935 — when were the roof, HVAC, electrical panel, plumbing, and water heater last replaced?
- What's the actual annual flood-insurance premium (NFIP or private), and is the property in a SFHA with mandatory coverage?
- Is there a deadline driving the sale (1031 exchange, divorce, estate, relocation)? That informs how much negotiation room exists.
- Crime grade is F in this area — have there been break-ins, vandalism, or insurance claims at this property in the last 3 years? What carrier currently insures it and at what premium?
- This sits on a lake — are riparian / water-frontage rights deeded with the parcel? Any dock permits, shoreline easements, or HOA water-use restrictions?
- What's the documented flood / surge / shoreline-erosion history here (FEMA AND non-FEMA — e.g., storm surge, creek backup, septic-field saturation)?
- Any water-quality or seasonal algae-bloom issues that affect tenant satisfaction or short-term-rental demand?
- What's the average days-on-market for RENTAL listings here right now (not sales)? A rising rental-DOM trend means longer vacancies and softer asking-rent achievability than the comps imply.
- What's the recent tenant-quality profile in this submarket — average credit score on applications, eviction rate, late-payment / NSF rate, and stable-employment percentage? A property-management company in the area should have these aggregated.
- How much new apartment / multifamily construction is in the pipeline within 1–3 miles? Heavy new supply (>2% of stock underway) typically softens rents 12–24 months out; light construction supports rent growth.
Investment metrics
- 1% rule
- 1.13% ✓
- Cap rate
- 9.28%
- Cash-on-cash
- 10.66%
- DSCR
- 1.47
- GRM
- 7.4
CMA / ARV
No comps found within radius.
Projected returns pro-forma
8.32% appreciation · 3.0% rent growth · sell at horizon
- IRR
- 26.3%
- Equity multiple
- 2.93×
- Total profit
- $216,322
- Equity at exit
- $312,425
- IRR
- 23.5%
- Equity multiple
- 6.32×
- Total profit
- $596,192
- Equity at exit
- $628,557
Cash invested: $111,972 (down + closing). Projections, not guarantees.
Landlord ↔ Tenant lean methodology
- Overall (STATE)
- 15 Strongly Tenant-Friendly
- State New York
- 15 Strongly Tenant-Friendly · D+10
- County
- — inherits STATE
- City
- — inherits STATE
ZIP-level market 12190
- Home prices YoY
- 2.5%
- Active inventory
- 10
- Price-to-rent
- 29.5×
Monthly cashflow live
- Estimated rent
- $4,517 medium interval (Pro) →
- Mortgage (P&I)
- −$2,097
- Tax from tax record
- −$310 /mo · $3,724/yr
- Insurance
- −$167
- Flood insurance flood zone
- −$314 /mo · $3,765/yr
- HOA
- −$0
- Vacancy / Maint / Mgmt
- −$949
- Net cashflow
- $681
Break-even live
Sensitivity live
| Price | -10% $907 | -5% $794 | +0% $681 | +5% $567 | +10% $454 |
|---|---|---|---|---|---|
| Rent | -10% $324 | -5% $502 | +0% $681 | +5% $859 | +10% $1,037 |
| Rate | -1.0pp $882 | -0.5pp $782 | base $681 | +0.5pp $577 | +1.0pp $472 |
4-unit breakdown (identical units grouped — click to expand)
| Units | Beds | Baths | Est. rent |
|---|---|---|---|
| 4× units | 6 | 5 | $4,516 |
| #1 | 6 | 5 | $1,129 |
| #2 | 6 | 5 | $1,129 |
| #3 | 6 | 5 | $1,129 |
| #4 | 6 | 5 | $1,129 |
| Total (4 units) | $4,517 | ||
UW: 25.0% down · 7.5% · 30yr · 1.5% tax · 5.0% vac · 8.0% maint · 8.0% mgmt
Financing live
Cash to close
- Down payment
- $99,975
- Closing costs
- $11,997
- Reserves months
- —
- Total cash needed
- —
Loan-product check · same deal, 3 products live
Conventional
25% down · 7.5% · 30yr
- Down + closing
- —
- Monthly P&I
- —
- Monthly cashflow
- —
- DSCR
- —
- Eligible?
- —
Personal DTI + credit; lowest rate.
DSCR
20% down · 8.5% · 30yr
- Down + closing
- —
- Monthly P&I
- —
- Monthly cashflow
- —
- DSCR
- —
- Eligible?
- —
No personal income docs; deal must DSCR.
Hard money
10% down · 12.0% · 12mo
- Down + closing
- —
- Monthly P&I
- —
- Monthly cashflow
- —
- DSCR
- —
- Eligible?
- —
Short-term bridge; refi at stabilization.
Listing history 23 events
-
2026-06-21days on market $399,900 Active 44 DOM
-
2026-06-21days on market $399,900 Active 43 DOM
-
2026-06-18days on market $399,900 Active 41 DOM
-
2026-06-17days on market $399,900 Active 40 DOM
-
2026-06-16days on market $399,900 Active 39 DOM
-
2026-06-15days on market $399,900 Active 38 DOM
-
2026-06-13days on market $399,900 Active 36 DOM
-
2026-06-12days on market $399,900 Active 35 DOM
-
2026-06-09days on market $399,900 Active 32 DOM
-
2026-06-08days on market $399,900 Active 31 DOM
-
2026-06-07days on market $399,900 Active 30 DOM
-
2026-06-07days on market $399,900 Active 29 DOM
-
2026-06-04days on market $399,900 Active 26 DOM
-
2026-06-02days on market $399,900 Active 25 DOM
-
2026-06-01days on market $399,900 Active 24 DOM
-
2026-05-31days on market $399,900 Active 23 DOM
-
2026-05-08$399,900 Active 984-char remark
-
2023-05-25soldstatus $144,000
-
2023-03-28status Active
-
2023-03-10status Pending
-
2023-03-10historical
-
2023-02-18$254,500 Active
-
2002-01-28soldstatus $83,210
ⓘ Source: listings_history table (triggers on properties + properties_extension) + one-shot
backfill from property_details.listing_events for pre-trigger history.
Tax reassessment forecast NY · Partial reset (capped growth)
- Current annual tax
- $3,724 · $310/mo
- Projected year-2 tax
- $5,241 · $437/mo
- Expected delta
- +$1,517/yr (+$126/mo · 40.7%)
ⓘ Screening estimate from a state-policy table — verify with the county assessor before closing.
Climate risk First Street
- Flood 10/10 Extreme FEMA zone A · 99% chance over 30 yrs
- Wildfire 3/10 Moderate
- Heat 1/10 Low 8 d/yr ≥91°F today · 18 d/yr by 30 yrs out
- Wind 2/10 Low 2% chance of damaging wind over 30 yrs
- Air quality 1/10 Low 0 unhealthy d/yr today · 0 by 30 yrs out
Nearby sold comps map
Loading sold comps map…
Walkable amenities ~0.75 mi
Loading nearby amenities…
Taxation est. · year 1
- Rental income
- $54,204
- − Mortgage interest
- −$22,401
- − Property taxes
- −$3,724
- − Insurance
- −$5,764
- − Repairs & maintenance
- −$4,336
- − Management
- −$4,336
- − Depreciation
- −$11,633
- Taxable income
- $2,009
- Est. tax owed @ 24.0%
- −$482
- After-tax cash flow
- $7,685/yr
For passive investors: Depreciation is non-cash, so a rental often shows a tax loss while cash-flowing — sheltering income. Rental losses are passive: they offset passive income freely, and up to $25,000/yr can offset ordinary (W-2) income if you actively participate and your MAGI is under $100k (phasing out to $0 by $150k); unused losses carry forward. On sale, claimed depreciation is recaptured at up to 25%, and gains may owe capital-gains tax (a 1031 exchange can defer both). Figures are a year-1 estimate at your 24.0% rate — not tax advice; consult a CPA.
Schools (NCES district)
- District
- Wells Central School District
- NCES district ID
- 3630450
- Math proficiency
- 55% ▲ 10.00%
- Reading proficiency
- 55% ▲ 10.00%
- Median HH income
- $47,506
- Composite
- 48.51/100
- National rank
- #4624
- State rank
- #369 of 755 in NY
Livability — Wells
- Score
- 61/100
- State rank
- #921
- US rank
- #17996
Category grades
Schools grade is shown separately in the Schools card above.
Census & demographics
- Census place
- Wells, NY
- Population (ZIP)
- 683
Population outlook (Hamilton County) Hauer SSP2
- Today (2025)
- 4,374 people
- By 2030
- 4,157 · -5.0%
- By 2040
- 3,641 · -16.8%
- By 2050
- 3,238 · -26.0%
- By 2075
- 2,644 · -39.6%
- By 2100
- 2,017 · -53.9%
Race, ethnicity, and origin ACS 2023
- Neighborhood character
- Predominantly White (96%)
- Race & ethnicity
- White 96% Hispanic / Latino 2% Two or more races 2%
- Common ancestry
- Slovak 8% Romanian 4% Portuguese 4%
- Foreign-born
- 0%
- Languages at home
- 98% English-only · Spanish 2%
Political lean MEDSL · Hamilton
- 2024 margin
- Strong R (+29.5) · D 35.3% · R 64.7%
- 2008→2024 swing
- -2.6pp toward R · 2008: -26.9pp · 2024: -29.5pp
- All cycles
- 2024: R+29.5 2020: R+30.3 2016: R+38.8 2012: R+26.2 2008: R+26.9
Not yet ingested
- Civics
- —
Market trends
- HPI YoY
- ▲ 8.32%
- Current HPI
- 339.0154
- Rent YoY
- —
- Metro
- —
- State GDP YoY
- ▲ 2.60%
- F500 in state
- 92
Industry mix (Fortune 500 HQ in NY)
| Industry | F500 HQs | Revenue |
|---|---|---|
| Financial Services | 10 | $950B |
|
||
| Consumer Goods | 9 | $162B |
|
||
| Insurance | 4 | $225B |
|
||
| Telecommunications | 2 | $144B |
|
||
| Pharmaceuticals | 2 | $112B |
|
||
| Media / Entertainment | 2 | $69B |
|
||
Price history
+380.6% since first listed7 events — show timeline
- 2026-05-08 Listed $399,900 Global MLS
- 2023-05-25 Sold (Public Records) $144,000 Public Records
- 2023-03-28 Relisted — Global MLS
- 2023-03-10 Pending — Global MLS
- 2023-03-10 Listing Removed — Global MLS
- 2023-02-18 Listed $254,500 Global MLS
- 2002-01-28 Sold (Public Records) $83,210 Public Records
Property tax history
+2.8%/yrLatest (2025): $3,724 · +4.3% YoY. Source: county tax records.
Cash-flow waterfall
monthlySold comps — $/sqft
last 12 mo · ≤1 miLoading sold comps…