 🏷️ Likely Rental
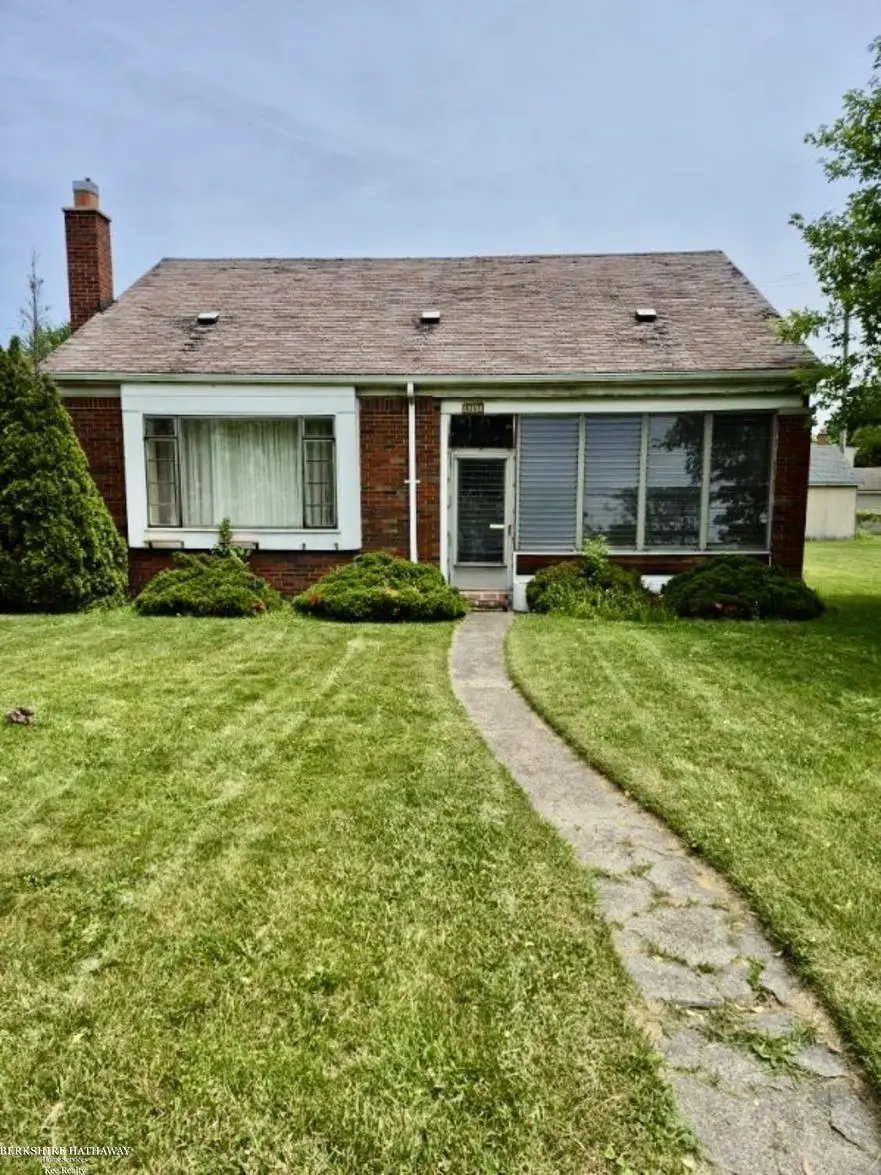
29290 Utica Rd · Roseville, MI
Flood risk 1/10 · Minimal
- FEMA flood zone
- X (unshaded)
- Chance of flooding over 30 yrs
- 0.0%
- Est. flood insurance / yr
- $473 – $860
Fire risk 1/10 · Minimal
- Est. fire insurance / yr
- $784 – $1,456
Heat risk 3/10 · Minor
- Hot days now (above 96°F)
- 7 days/yr
- Hot days in 30 yrs
- 15 days/yr
Wind risk 1/10 · Minimal
- Chance of severe wind over 30 yrs
- —
Air-quality risk 4/10 · Minor
- Unhealthy air days now
- 4 days/yr
- Unhealthy air days in 30 yrs
- 5 days/yr
Risk factors via First Street. Map © Google.
Why this score? — see what drove the C+ grade
The composite is a weighted blend of 9 inputs, each scored 0–100. Each bar is that input's sub-score; the figure is the points it added to the 100-point composite (weight × sub-score).
- Cash flow +23.9/30.0
- ARV discount +15.0/15.0
- DSCR +7.7/10.0
- 1% rule +7.4/10.0
- Livability +3.6/5.0
- Rent growth +2.6/5.0
- Condition / age +2.5/5.0
- Schools +1.5/10.0
- Appreciation +0.0/10.0
$129,900
🖨 Deal sheet 📄 Offer letter ✓ Due diligence
Listing remarks MLS
OPEN HOUSE SUNDAY 5/31/26, 3:30-5pm. Large Lot and a large 4 car garage! There is a newer furnace and electrical service panel breakers. The roof on the garage is newer, the house roof will need to be replaced by the new owner (estimates on file). Great floor plan and spacious rooms. Natural fireplace in the living room. Fenced yard. Currently tenant occupied on month to month. Home needs work but has a lot of potential!
Key facts
- 9,148 sq ft lot
- 4 garage spots
- Built 1950
Property features AI
Exterior
- Parking: Detached side-loading garage with workshop; 4 garage parking spaces
- Utilities: Public water; Public sanitary sewer; Natural gas heating/fuel
- Home design: Residential 1 1/2-story home; Built in 1950; Faces road
- Construction: Shallow basement foundation
- Exterior features: Brick exterior; Road frontage; Corner lot
Interior
- Bedrooms: Two first-floor bedrooms (approximately 12 x 12); One second-floor bedroom (approximate width 26)
- Bathrooms: One full bathroom (first floor)
- Heating & cooling: Forced air heating; Central A/C; Gas water heater
- Interior features: Living room fireplace (natural)
- Laundry & utility: Basement present
Neighborhood map
What this means for you Summary
Snapshot
- This is a 3-bed/1.0-bath single-family listed at $130k.
Deal economics
- At list price, monthly cash flow is $252 ($3k/yr) — positive.
- The deal already cash-flows at list — no discount required.
- Meets the 1% rule at list price ($2k rent vs $130k).
- Recommended offer: $128k (1.5% below list) — sets the bar for market timing.
- Cap rate 8.6% vs local median 6.0% in Roseville — top-decile yield for the area; either an underpriced asset or a hidden risk that comps aren't pricing in. Stress-test before assuming the spread holds.
Location & tenants
- Location reads 72/100 on livability (#258 in MI) — a middle-class / working-renter tenant base. Strengths: commute A+, cost of living A+, housing A+; Watch: health & safety D+, employment D, schools F.
- Roseville Community Schools (suburban): math 11% / reading 24% proficiency, ranked #483 of 540 in MI (top 89%) — low school quality limits family demand, transient renter base, plan for 1-2y turnover; 60% free/reduced lunch — lower-income household profile, screen leases tightly.
- Market conditions: Rents flat; 265 active listings in the ZIP; 10 comparable units currently listed for rent nearby; rentals at typical pace (median 19d on market — plan ~3-4 weeks tenant-placement turnaround); 1,321 units permitted in Macomb County in 2024 (86 in 5+ unit buildings).
- This rent runs 31% of the median local income ($62k/yr) — at the standard rent-burdened threshold; future hikes will face affordability resistance.
Forward outlook
- Local home prices are declining (-3.0%/yr); year-one equity from $898 of loan paydown is wiped out by about $4k of value loss. Plan a longer hold.
- Macomb County population projected at +9% by 2050 — modest demand growth; plan on rents tracking national, not racing it.
Negotiation context
- It's been on market 18 days — a 2% lower offer ($128k) is reasonable based on typical stale-listing flexibility.
- 2 sale attempts; this cycle's ask has dropped $30k (19%) from the opening price — seller is motivated, your offer sets the floor, not the list.
- Current owner paid $58k; list at $130k implies a 123% gain — meaningful room to come down on a strong offer.
Risks & watch-outs
- Watch-outs: property tax is 2.7% of price; built in 1950 — expect roof / HVAC / electrical / plumbing capex.
Questions for the listing agent
- Built in 1950 — when were the roof, HVAC, electrical panel, plumbing, and water heater last replaced?
- Property tax is high relative to price — has the assessment been appealed recently, and will the sale trigger a re-assessment?
- Is there a deadline driving the sale (1031 exchange, divorce, estate, relocation)? That informs how much negotiation room exists.
- Schools are F-rated, which usually means shorter tenancies and higher turnover. Who's the typical renter profile here, and what's been the actual vacancy rate?
- Crime grade is F in this area — have there been break-ins, vandalism, or insurance claims at this property in the last 3 years? What carrier currently insures it and at what premium?
- What's the average days-on-market for RENTAL listings here right now (not sales)? A rising rental-DOM trend means longer vacancies and softer asking-rent achievability than the comps imply.
- What's the recent tenant-quality profile in this submarket — average credit score on applications, eviction rate, late-payment / NSF rate, and stable-employment percentage? A property-management company in the area should have these aggregated.
- How much new for-sale + rental construction is in the pipeline within 1–3 miles? Heavy new supply typically softens prices + rents 12–24 months out; constrained supply supports both.
Investment metrics
- 1% rule
- 1.24% ✓
- Cap rate
- 8.62%
- Cash-on-cash
- 8.32%
- DSCR
- 1.37
- GRM
- 6.7
CMA / ARV
- ARV (on-the-fly)
- $187,416
- Comps found
- 12
Show comp detail 12 sales within ~0.75 mi
| Address | Dist | Beds/Ba | Sqft | Sold | Price | $/sf | Match |
|---|---|---|---|---|---|---|---|
| 29355 Utica Rd | 0.08mi | 3/2.0 | 1,546 (-6%) | 3mo | $165,000 | $107 | 80 |
| 28627 Maple St | 0.44mi | 3/1.0 | 1,680 (+2%) | 1mo | $169,900 | $101 | 76 |
| 17891 Birmingham St St | 0.06mi | 3/1.0 | 1,399 (-15%) | 1mo | $169,900 | $121 | 71 |
| 29820 Quinkert St | 0.36mi | 3/1.0 | 1,492 (-9%) | 2mo | $136,000 | $91 | 66 |
| 29116 Dembs St | 0.23mi | 3/1.5 | 1,849 (+12%) | 0mo | $210,000 | $114 | 66 |
| 28034 Essex St | 0.66mi | 3/1.0 | 1,600 (-3%) | 1mo | $153,000 | $96 | 64 |
| 30061 Park St | 0.51mi | 3/2.0 | 1,575 (-4%) | 3mo | $209,000 | $133 | 63 |
| 29940 John J St | 0.38mi | 3/2.0 | 1,809 (+10%) | 1mo | $192,000 | $106 | 61 |
| 28435 Victor St | 0.47mi | 4/2.0 (+1) | 1,563 (-5%) | 1mo | $232,000 | $148 | 60 |
| 29450 Ruthdale St | 0.39mi | 4/2.0 (+1) | 1,424 (-13%) | 0mo | $222,600 | $156 | 50 |
| 28637 Bohn St | 0.62mi | 3/1.0 | 1,845 (+12%) | 3mo | $187,000 | $101 | 48 |
| 28222 Bohn St | 0.72mi | 3/2.0 | 1,408 (-14%) | 4mo | $200,000 | $142 | 35 |
Match score weights: distance 35% · size 25% · config 20% · recency 20%. Top-matched comps best support the ARV.
Projected returns pro-forma
-3.0% appreciation · 0.39% rent growth · sell at horizon
- IRR
- -6.9%
- Equity multiple
- 0.75×
- Total profit
- $-9,016
- Equity at exit
- $19,369
- IRR
- -1.3%
- Equity multiple
- 0.92×
- Total profit
- $-2,843
- Equity at exit
- $11,231
Cash invested: $36,372 (down + closing). Projections, not guarantees.
Landlord ↔ Tenant lean methodology
- Overall (STATE)
- 62 Landlord-Friendly
- State Michigan
- 62 Landlord-Friendly · EVEN
- County
- — inherits STATE
- City
- — inherits STATE
ZIP-level market 48066
- Rents YoY
- 0.4%
- Active inventory
- 265
- Price-to-rent
- 6.7×
Monthly cashflow live
- Estimated rent
- $1,614 high interval (Pro) →
- Mortgage (P&I)
- −$681
- Tax from tax record
- −$287 /mo · $3,447/yr
- Insurance
- −$54
- HOA
- −$0
- Vacancy / Maint / Mgmt
- −$339
- Net cashflow
- $252
Break-even live
UW: 25.0% down · 7.5% · 30yr · 1.5% tax · 5.0% vac · 8.0% maint · 8.0% mgmt
Financing live
Cash to close
- Down payment
- $32,475
- Closing costs
- $3,897
- Reserves months
- —
- Total cash needed
- —
Loan-product check · same deal, 3 products live
Conventional
25% down · 7.5% · 30yr
- Down + closing
- —
- Monthly P&I
- —
- Monthly cashflow
- —
- DSCR
- —
- Eligible?
- —
Personal DTI + credit; lowest rate.
DSCR
20% down · 8.5% · 30yr
- Down + closing
- —
- Monthly P&I
- —
- Monthly cashflow
- —
- DSCR
- —
- Eligible?
- —
No personal income docs; deal must DSCR.
Hard money
10% down · 12.0% · 12mo
- Down + closing
- —
- Monthly P&I
- —
- Monthly cashflow
- —
- DSCR
- —
- Eligible?
- —
Short-term bridge; refi at stabilization.
Rent comps 10 comps
| Address | Beds | Baths | Sqft | Rent | $/sqft | DOM | Units | Dist |
|---|---|---|---|---|---|---|---|---|
| 28744 Maple St Roseville, MI | 3.0 | 1.0 | 1050 | $1,295 | $1.23 | 43d | 1 | 0.36mi |
| 18410 Tranquil St Roseville, MI | 3.0 | 1.0 | 1140 | $1,800 | $1.58 | 14d | 1 | 0.38mi |
| 18410 Tranquil St Roseville, MI | 3.0 | 1.0 | 1140 | $1,800 | $1.58 | 43d | 1 | 0.38mi |
| 19236 Florida St Roseville, MI | 2.0 | 1.0 | 1160 | $1,700 | $1.47 | 1d | 1 | 0.72mi |
| 16651 Twelve Mile Rd Roseville, MI | 2.0–3.0 | 1.5 | 957 | $1,720 | $1.80 | 1d | 1 | 0.77mi |
| 30583 Hidden Pines Ln Roseville, MI | 2.0 | 2.0 | 1100 | $1,250 | $1.14 | 16d | 1 | 0.81mi |
| 28232 Floral St Unit 1032343P Roseville, MI | 3.0 | 1.0 | 1496 | $6,605 | $4.42 | 12d | 1 | 0.82mi |
| 30773 Hidden Pines Ln Roseville, MI | 2.0 | 2.0 | 1142 | $1,500 | $1.31 | 43d | 1 | 0.82mi |
| 30657 Hidden Pines Ln Roseville, MI | 2.0 | 2.0 | 1174 | $1,650 | $1.41 | 19d | 1 | 0.82mi |
| 27881 O Neil Roseville, MI | 3.0 | 1.0 | 1300 | $1,300 | $1.00 | 24d | 1 | 1.04mi |
Listing history 20 events
-
2026-06-18days on market $129,900 Active 18 DOM
-
2026-06-17remarks 555-char remark
-
2026-06-17price $129,900 Active 17 DOM
-
2026-06-17remarks 548-char remark
-
2026-06-17pricedays on market $130,000 Active 17 DOM
-
2026-06-16days on market $134,900 Active 16 DOM
-
2026-06-15remarks 513-char remark
-
2026-06-15pricedays on market $134,900 Active 15 DOM
-
2026-06-13remarks 483-char remark
-
2026-06-13pricedays on market $139,000 Active 13 DOM
-
2026-06-09days on market $140,000 Active 9 DOM
-
2026-06-08days on market $140,000 Active 8 DOM
-
2026-06-07days on market $140,000 Active 7 DOM
-
2026-06-04remarks 479-char remark
-
2026-06-04pricedays on market $140,000 Active 4 DOM
-
2026-06-03days on market $160,000 Active 3 DOM
-
2026-06-02days on market $160,000 Active 2 DOM
-
2026-06-01$160,000 Active 1 DOM
-
2026-05-31remarks 424-char remark
Show marketing remark (424 chars)
OPEN HOUSE SUNDAY 5/31/26, 3:30-5pm. Large Lot and a large 4 car garage! There is a newer furnace and electrical service panel breakers. The roof on the garage is newer, the house roof will need to be replaced by the new owner (estimates on file). Great floor plan and spacious rooms. Natural fireplace in the living room. Fenced yard. Currently tenant occupied on month to month. Home needs work but has a lot of potential!
-
2026-05-31$160,000 Active 1 DOM
Show marketing remark (424 chars)
OPEN HOUSE SUNDAY 5/31/26, 3:30-5pm. Large Lot and a large 4 car garage! There is a newer furnace and electrical service panel breakers. The roof on the garage is newer, the house roof will need to be replaced by the new owner (estimates on file). Great floor plan and spacious rooms. Natural fireplace in the living room. Fenced yard. Currently tenant occupied on month to month. Home needs work but has a lot of potential!
ⓘ Source: listings_history table (triggers on properties + properties_extension) + one-shot
backfill from property_details.listing_events for pre-trigger history.
Tax reassessment forecast MI · Partial reset (capped growth)
- Current annual tax
- $3,447 · $287/mo
- Projected year-2 tax
- $3,447 · $287/mo
- Expected delta
- $0/yr ($0/mo · 0.0%)
ⓘ Screening estimate from a state-policy table — verify with the county assessor before closing.
Climate risk First Street
- Flood 1/10 Low FEMA zone X (unshaded) · 0% chance over 30 yrs
- Wildfire 1/10 Low
- Heat 3/10 Moderate 7 d/yr ≥96°F today · 15 d/yr by 30 yrs out
- Wind 1/10 Low
- Air quality 4/10 Moderate 4 unhealthy d/yr today · 5 by 30 yrs out
Nearby sold comps map
Loading sold comps map…
Walkable amenities ~0.75 mi
Loading nearby amenities…
Taxation est. · year 1
- Rental income
- $19,364
- − Mortgage interest
- −$7,276
- − Property taxes
- −$3,447
- − Insurance
- −$650
- − Repairs & maintenance
- −$1,549
- − Management
- −$1,549
- − Depreciation
- −$3,779
- Taxable income
- $1,114
- Est. tax owed @ 24.0%
- −$267
- After-tax cash flow
- $2,759/yr
For passive investors: Depreciation is non-cash, so a rental often shows a tax loss while cash-flowing — sheltering income. Rental losses are passive: they offset passive income freely, and up to $25,000/yr can offset ordinary (W-2) income if you actively participate and your MAGI is under $100k (phasing out to $0 by $150k); unused losses carry forward. On sale, claimed depreciation is recaptured at up to 25%, and gains may owe capital-gains tax (a 1031 exchange can defer both). Figures are a year-1 estimate at your 24.0% rate — not tax advice; consult a CPA.
Schools (NCES district)
- District
- Roseville Community Schools
- NCES district ID
- 2630210
- Math proficiency
- 11% ▼ -8.00%
- Reading proficiency
- 24% ▼ -7.00%
- Median HH income
- $41,590
- Composite
- 14.98/100
- National rank
- #9363
- State rank
- #483 of 540 in MI
Livability — Roseville
- Score
- 72/100
- State rank
- #258
- US rank
- #6400
Category grades
Schools grade is shown separately in the Schools card above.
Census & demographics
- Census place
- Roseville, MI
- County
- Macomb County · 638,552 people
- City population
- 47,123
- Metro
- Detroit-Warren-Dearborn, MI
- Population (ZIP)
- 47,123
- Household income
- $62,182
- Rent vs Own
- Severe rent burden
- 1712.0
Population outlook (Macomb County) Hauer SSP2
- Today (2025)
- 925,296 people
- By 2030
- 948,226 · +2.5%
- By 2040
- 983,961 · +6.3%
- By 2050
- 1,010,200 · +9.2%
- By 2075
- 1,076,222 · +16.3%
- By 2100
- 1,077,065 · +16.4%
Race, ethnicity, and origin ACS 2023
- Neighborhood character
- Predominantly White (65%)
- Race & ethnicity
- White 65% Black 23% Two or more races 7% Hispanic / Latino 4% Asian 2%
- Common ancestry
- Romanian 12% Lithuanian 4% Slovak 2%
- Foreign-born
- 5% · Canada
- Languages at home
- 93% English-only · Spanish 2% Russian/Polish/Slavic 1% Other Indo-European 1%
Political lean MEDSL · Macomb
- 2024 margin
- R (+13.7) · D 42.2% · R 55.9% · Other 1.9%
- 2008→2024 swing
- -22.3pp toward R · 2008: 8.6pp · 2024: -13.7pp
- All cycles
- 2024: R+13.7 2020: R+8.1 2016: R+11.6 2012: D+4.0 2008: D+8.6
Not yet ingested
- Civics
- —
Market trends
- HPI YoY
- ▼ -232.95%
- Current HPI
- 217.4171
- Rent YoY
- ▲ 0.39%
- Metro
- Detroit-Warren-Dearborn, MI
- State GDP YoY
- ▲ 1.37%
- F500 in state
- 28
Industry mix (Fortune 500 HQ in MI)
| Industry | F500 HQs | Revenue |
|---|---|---|
| Automotive Parts | 3 | $48B |
|
||
| Automotive | 2 | $372B |
|
||
| Chemicals | 1 | $45B |
|
||
| Automotive Retail | 1 | $29B |
|
||
| Healthcare / Medical Devices | 1 | $23B |
|
||
| Automotive Technology | 1 | $20B |
|
||
Price history
+3.9% since first listed7 events — show timeline
- 2026-05-31 Listed $160,000 REALCOMP
- 2026-05-31 Listed $160,000 MiRealSource-MiMLS
- 2026-05-30 Coming Soon $160,000 MiRealSource-MiMLS
- 2018-06-13 Sold (Public Records) $58,178 Public Records
- 2017-07-27 Sold (Public Records) $55,301 Public Records
- 2005-02-17 Sold (Public Records) $154,000 Public Records
- 2005-02-17 Sold (Public Records) $154,000 Public Records
Property tax history
+1.2%/yrLatest (2025): $3,447 · +4.5% YoY. Source: county tax records.
Cash-flow waterfall
monthlySold comps — $/sqft
last 12 mo · ≤1 miLoading sold comps…