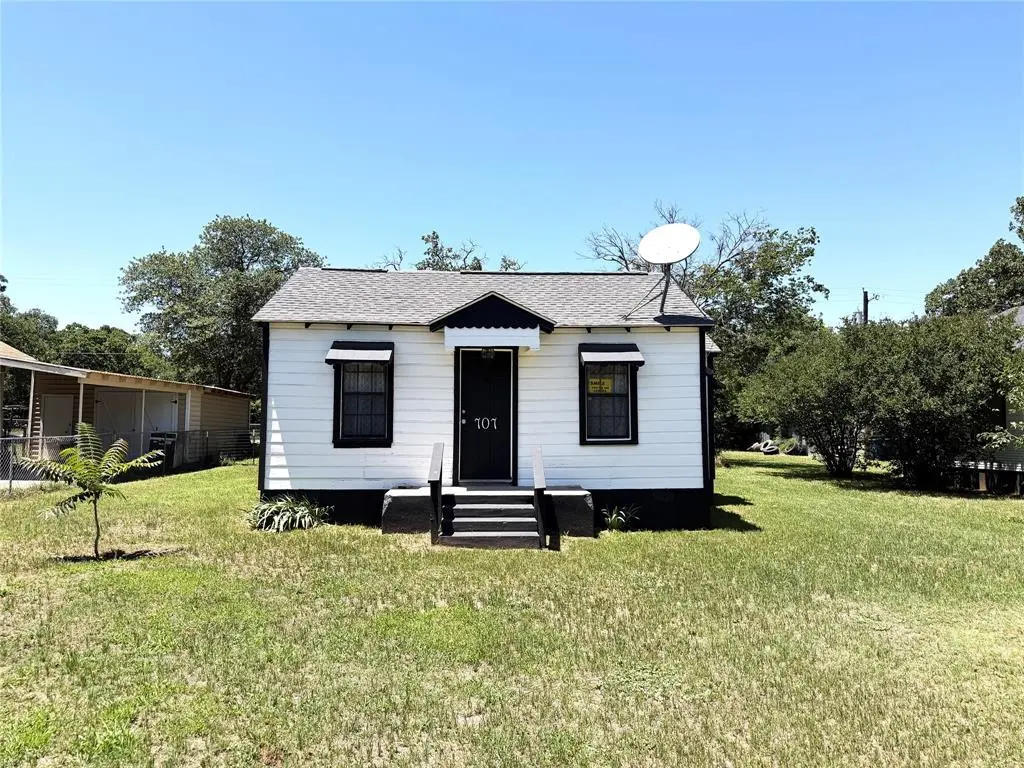
707 E 23rd St · Cisco, TX
Flood risk 1/10 · Minimal
- FEMA flood zone
- X
- Chance of flooding over 30 yrs
- 0.0%
- Est. flood insurance / yr
- $507 – $1,088
Fire risk 7/10 · Major
- Est. fire insurance / yr
- $1,222 – $2,270
Heat risk 7/10 · Major
- Hot days now (above 107°F)
- 7 days/yr
- Hot days in 30 yrs
- 22 days/yr
Wind risk 4/10 · Minor
- Chance of severe wind over 30 yrs
- 19.0%
Air-quality risk 1/10 · Minimal
- Unhealthy air days now
- 0 days/yr
- Unhealthy air days in 30 yrs
- 0 days/yr
Risk factors via First Street. Map © Google.
Why this score? — see what drove the C grade
The composite is a weighted blend of 9 inputs, each scored 0–100. Each bar is that input's sub-score; the figure is the points it added to the 100-point composite (weight × sub-score).
- Cash flow +17.7/30.0
- Appreciation +9.4/10.0
- ARV discount +7.5/15.0
- DSCR +5.5/10.0
- 1% rule +4.6/10.0
- Schools +4.6/10.0
- Livability +3.8/5.0
- Rent growth +2.5/5.0
- Condition / age +2.5/5.0
$78,500
🖨 Deal sheet 📄 Offer letter ✓ Due diligence
Listing remarks
Here's a neat, efficient, one bedroom, one bath home with very nice hardwood floors in Cisco TX with about 780 sq ft. This home has had several nice upgrades, including a new roof in 2019, new electrical, plumbing, water heater and gas line in 2025, and fresh paint inside and out. New gas stove may convey with a strong offer. This home is priced to move, and would make a nice rental or first home. The 2 bedroom house next door is also for sale by the same owner. Don't miss out on this one!
Key facts
- New plumbing
- New water heater
- New electrical
Tags
Property features AI
Finance
- Other: Standard listing conditions; Possession at closing/funding
- Financial info: Accepts cash and conventional financing; Treat as clear loan type; No second mortgage
- HOA & community: No homeowners association
Exterior
- Parking: Direct access parking; No covered or carport spaces
- Utilities: City water; City sewer; No municipal utility district
- Home design: Single family residence; One story; Residential property
- Construction: Built in 1955; Siding exterior; Composition roof; Pillar/post/pier foundation
- Exterior features: Asphalt access/driveway; City water; City sewer; Lot less than 0.5 acre (approximately 0.194 acres); Subdivision: Ot Cisco; GPS friendly location
Interior
- Kitchen: No appliances included
- Bedrooms: 1 bedroom (Primary Bedroom on level 1)
- Flooring: Hardwood; Vinyl
- Bathrooms: 1 full bathroom
- Heating & cooling: Natural gas heating; No central cooling
- Interior features: High speed internet available; 2 total rooms; 1 living area; 1 dining area
- Laundry & utility: No cooling; Natural gas heating
Neighborhood map
What this means for you Summary
Snapshot
- This is a 1-bed/1.0-bath single-family listed at $78k.
Deal economics
- At list price, monthly cash flow is $63 ($756/yr) — positive.
- The deal already cash-flows at list — no discount required.
- To meet the 1% rule (rent ≥ 1% of price), the offer needs to be $75k (4.5% below list).
- Recommended offer: $75k (4.5% below list) — sets the bar for 1% rule.
- Cap rate 7.3% vs local median 3.5% in Cisco — top-decile yield for the area; either an underpriced asset or a hidden risk that comps aren't pricing in. Stress-test before assuming the spread holds.
Location & tenants
- Location reads 75/100 on livability (#121 in TX, #3,812 nationally) — a middle-class / working-renter tenant base. Strengths: crime A+, cost of living A+, housing A+; Watch: amenities F, commute F.
- Cisco ISD (town): math 53% / reading 58% proficiency, ranked #118 of 826 in TX (top 14%) — acceptable for families but not a draw, mixed tenant base, ~2y average lease.
- Zoned schools: Cisco El (math 47% / reading 57%, grade C-, #742 of 4,322 statewide, top 19%, 415 students, 60% FRL).
- Market conditions: 82 active listings in the ZIP; 1 comparable units currently listed for rent nearby; 10 units permitted in Eastland County in 2024 (0 in 5+ unit buildings).
Forward outlook
- In year one you build about $7k of equity ($543 loan paydown + $7k appreciation (8.8% local appreciation)).
- Eastland County population projected at -14% by 2050 — secular population decline; favor cash flow + early exit over multi-decade hold.
- At projected returns (8.8% appreciation + 3.0% rent growth), your $22k cash investment doubles in ~3 years — after that, you're playing with house money.
- By year 5, paydown + projected appreciation supports a ~$34k cash-out refi (75% LTV) — recoverable capital for the next deal without selling this one.
Negotiation context
- Only 6 days on market — expect competitive offers; lowballing is unlikely to land.
- 3 sale attempts with the ask held roughly flat each time — persistent listings suggest the price (not the market) is what's stuck; bring a comps-based counter.
Risks & watch-outs
- Watch-outs: built in 1955 — expect roof / HVAC / electrical / plumbing capex.
- Climate carrying-cost: major wildfire risk; extreme-heat days projected 7→22/yr by 2055 (HVAC capex compounding) — expect insurance premiums to compound above CPI over the hold.
Questions for the listing agent
- Built in 1955 — when were the roof, HVAC, electrical panel, plumbing, and water heater last replaced?
- Is there a deadline driving the sale (1031 exchange, divorce, estate, relocation)? That informs how much negotiation room exists.
- What's the average days-on-market for RENTAL listings here right now (not sales)? A rising rental-DOM trend means longer vacancies and softer asking-rent achievability than the comps imply.
- What's the recent tenant-quality profile in this submarket — average credit score on applications, eviction rate, late-payment / NSF rate, and stable-employment percentage? A property-management company in the area should have these aggregated.
- How much new for-sale + rental construction is in the pipeline within 1–3 miles? Heavy new supply typically softens prices + rents 12–24 months out; constrained supply supports both.
Investment metrics
- 1% rule
- 0.96% ✗
- Cap rate
- 7.26%
- Cash-on-cash
- 3.44%
- DSCR
- 1.15
- GRM
- 8.7
CMA / ARV
No comps found within radius.
Projected returns pro-forma
8.82% appreciation · 3.0% rent growth · sell at horizon
- IRR
- 24.3%
- Equity multiple
- 2.84×
- Total profit
- $40,509
- Equity at exit
- $64,059
- IRR
- 21.8%
- Equity multiple
- 6.23×
- Total profit
- $114,945
- Equity at exit
- $131,621
Cash invested: $21,980 (down + closing). Projections, not guarantees.
Landlord ↔ Tenant lean methodology
- Overall (STATE)
- 87 Strongly Landlord-Friendly
- State Texas
- 87 Strongly Landlord-Friendly · R+5
- County
- — inherits STATE
- City
- — inherits STATE
ZIP-level market 76437
- Home prices YoY
- 5.6%
- Active inventory
- 82
- Price-to-rent
- 8.7×
Monthly cashflow live
- Estimated rent
- $750 medium interval (Pro) →
- Mortgage (P&I)
- −$412
- Tax from tax record
- −$85 /mo · $1,021/yr
- Insurance
- −$33
- HOA
- −$0
- Vacancy / Maint / Mgmt
- −$158
- Net cashflow
- $63
Break-even live
UW: 25.0% down · 7.5% · 30yr · 1.5% tax · 5.0% vac · 8.0% maint · 8.0% mgmt
Financing live
Cash to close
- Down payment
- $19,625
- Closing costs
- $2,355
- Reserves months
- —
- Total cash needed
- —
Loan-product check · same deal, 3 products live
Conventional
25% down · 7.5% · 30yr
- Down + closing
- —
- Monthly P&I
- —
- Monthly cashflow
- —
- DSCR
- —
- Eligible?
- —
Personal DTI + credit; lowest rate.
DSCR
20% down · 8.5% · 30yr
- Down + closing
- —
- Monthly P&I
- —
- Monthly cashflow
- —
- DSCR
- —
- Eligible?
- —
No personal income docs; deal must DSCR.
Hard money
10% down · 12.0% · 12mo
- Down + closing
- —
- Monthly P&I
- —
- Monthly cashflow
- —
- DSCR
- —
- Eligible?
- —
Short-term bridge; refi at stabilization.
Rent comps 1 comps
| Address | Beds | Baths | Sqft | Rent | $/sqft | DOM | Units | Dist |
|---|---|---|---|---|---|---|---|---|
| 400 Conrad Hilton Blvd Cisco, TX | 1.0–2.0 | 1.0 | 910 | $750 | $0.82 | 21d | 10 | 1.41mi |
Listing history 6 events
-
2026-06-18days on market $78,500 Active 6 DOM
-
2026-06-17days on market $78,500 Active 5 DOM
-
2026-06-16days on market $78,500 Active 4 DOM
-
2026-06-15days on market $78,500 Active 3 DOM
-
2026-06-12remarks 494-char remark
-
2026-06-12$78,500 Active 1 DOM
ⓘ Source: listings_history table (triggers on properties + properties_extension) + one-shot
backfill from property_details.listing_events for pre-trigger history.
Tax reassessment forecast TX · Resets to sale price
- Current annual tax
- $1,021 · $85/mo
- Projected year-2 tax
- $1,437 · $120/mo
- Expected delta
- +$415/yr (+$35/mo · 40.6%)
ⓘ Screening estimate from a state-policy table — verify with the county assessor before closing.
Climate risk First Street
- Flood 1/10 Low FEMA zone X · 0% chance over 30 yrs
- Wildfire 7/10 Severe
- Heat 7/10 Severe 7 d/yr ≥107°F today · 22 d/yr by 30 yrs out
- Wind 4/10 Moderate 19% chance of damaging wind over 30 yrs
- Air quality 1/10 Low 0 unhealthy d/yr today · 0 by 30 yrs out
Nearby sold comps map
Loading sold comps map…
Walkable amenities ~0.75 mi
Loading nearby amenities…
Taxation est. · year 1
- Rental income
- $9,000
- − Mortgage interest
- −$4,397
- − Property taxes
- −$1,021
- − Insurance
- −$392
- − Repairs & maintenance
- −$720
- − Management
- −$720
- − Depreciation
- −$2,284
- Taxable loss
- −$535
- Est. tax savings @ 24.0%
- +$128
- After-tax cash flow
- $884/yr
For passive investors: Depreciation is non-cash, so a rental often shows a tax loss while cash-flowing — sheltering income. Rental losses are passive: they offset passive income freely, and up to $25,000/yr can offset ordinary (W-2) income if you actively participate and your MAGI is under $100k (phasing out to $0 by $150k); unused losses carry forward. On sale, claimed depreciation is recaptured at up to 25%, and gains may owe capital-gains tax (a 1031 exchange can defer both). Figures are a year-1 estimate at your 24.0% rate — not tax advice; consult a CPA.
Schools (NCES district)
- District
- Cisco ISD
- NCES district ID
- 4814070
- Math proficiency
- 53% ▼ -2.00%
- Reading proficiency
- 58% ▲ 6.00%
- Median HH income
- $39,085
- Composite
- 46.29/100
- National rank
- #2478
- State rank
- #118 of 826 in TX
Livability — Cisco
- Score
- 75/100
- State rank
- #121
- US rank
- #3812
Category grades
Schools grade is shown separately in the Schools card above.
Census & demographics
- Census place
- Cisco, TX
- Population (ZIP)
- 5,895
Population outlook (Eastland County) Hauer SSP2
- Today (2025)
- 17,433 people
- By 2030
- 16,908 · -3.0%
- By 2040
- 15,855 · -9.1%
- By 2050
- 14,906 · -14.5%
- By 2075
- 12,843 · -26.3%
- By 2100
- 10,344 · -40.7%
Race, ethnicity, and origin ACS 2023
- Neighborhood character
- Predominantly White (79%)
- Race & ethnicity
- White 79% Hispanic / Latino 18% Two or more races 10% Black 1%
- Hispanic origin (detail)
- Mexican 16%
- Common ancestry
- Italian 14% Serbian 3% Slovak 2%
- Foreign-born
- 3% · Canada
- Languages at home
- 86% English-only · Spanish 12% Vietnamese 1%
Political lean MEDSL · Eastland
- 2024 margin
- Solid R (+77.5) · D 11.0% · R 88.5%
- 2008→2024 swing
- -17.6pp toward R · 2008: -59.8pp · 2024: -77.5pp
- All cycles
- 2024: R+77.5 2020: R+75.4 2016: R+75.4 2012: R+68.9 2008: R+59.8
Not yet ingested
- Civics
- —
Market trends
- HPI YoY
- ▲ 8.82%
- Current HPI
- 167.4457
- Rent YoY
- —
- Metro
- —
- State GDP YoY
- ▲ 3.95%
- F500 in state
- 110
Industry mix (Fortune 500 HQ in TX)
| Industry | F500 HQs | Revenue |
|---|---|---|
| Energy | 16 | $1,198B |
|
||
| Technology | 5 | $198B |
|
||
| Engineering / Construction | 4 | $72B |
|
||
| Energy Services | 3 | $60B |
|
||
| Utilities | 3 | $41B |
|
||
| Healthcare | 2 | $330B |
|
||
Price history
-0.6% since first listed5 events — show timeline
- 2026-06-12 Listed $78,500 NTREIS
- 2026-03-16 Listing Removed — NTREIS
- 2025-09-30 Listed $84,500 NTREIS
- 2025-08-19 Listing Removed — NTREIS
- 2025-08-04 Listed $79,000 NTREIS
Property tax history
+4.6%/yrLatest (2025): $1,021 · -7.6% YoY. Source: county tax records.
Cash-flow waterfall
monthlySold comps — $/sqft
last 12 mo · ≤1 miLoading sold comps…