9100 Misty Ct · Oklahoma City, OK
Flood risk 1/10 · Minimal
- FEMA flood zone
- X (unshaded)
- Chance of flooding over 30 yrs
- 0.0%
- Est. flood insurance / yr
- $507 – $1,088
Fire risk 5/10 · Moderate
- Est. fire insurance / yr
- $2,463 – $4,575
Heat risk 5/10 · Moderate
- Hot days now (above 108°F)
- 7 days/yr
- Hot days in 30 yrs
- 18 days/yr
Wind risk 3/10 · Minor
- Chance of severe wind over 30 yrs
- 6.0%
Air-quality risk 2/10 · Minimal
- Unhealthy air days now
- 0 days/yr
- Unhealthy air days in 30 yrs
- 1 days/yr
Risk factors via First Street. Map © Google.
Why this score? — see what drove the B- grade
The composite is a weighted blend of 9 inputs, each scored 0–100. Each bar is that input's sub-score; the figure is the points it added to the 100-point composite (weight × sub-score).
- Cash flow +30.0/30.0
- 1% rule +10.0/10.0
- DSCR +10.0/10.0
- ARV discount +7.5/15.0
- Livability +4.0/5.0
- Rent growth +2.5/5.0
- Condition / age +2.5/5.0
- Schools +1.5/10.0
- Appreciation +0.0/10.0
$62,000
🖨 Deal sheet 📄 Offer letter ✓ Due diligence
Listing remarks
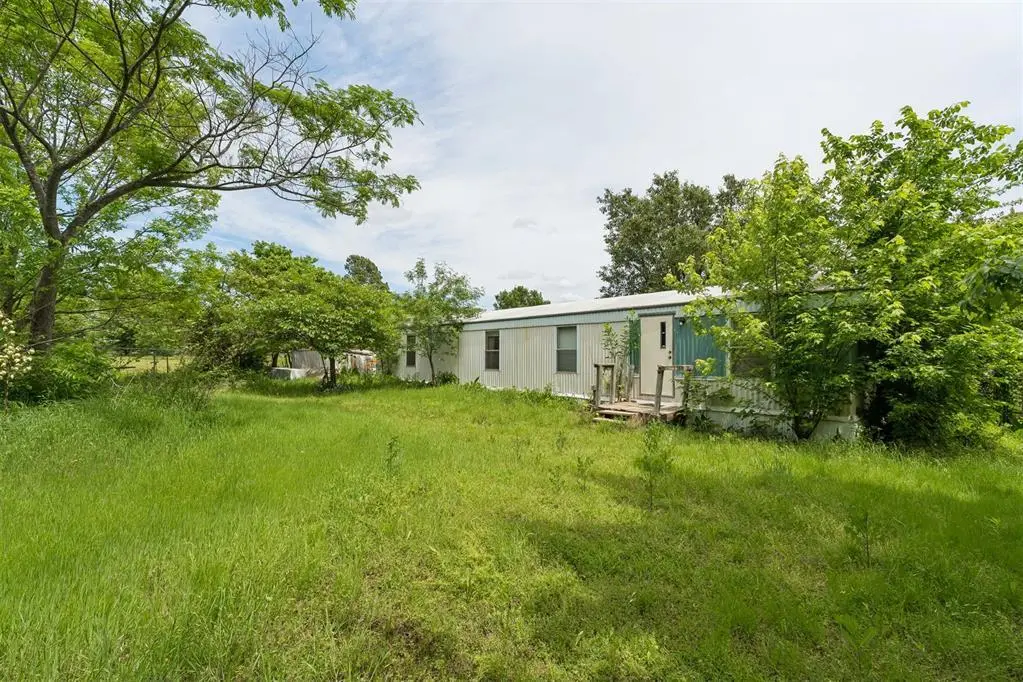
Tucked away on a quiet cul-de-sac in Oklahoma City, 9100 Misty Court offers a solid opportunity for buyers looking to make a home their own or add to their investment portfolio. With a functional layout and good bones, this property is ready for updates and personal touches to unlock its full potential. Whether you’re an investor looking for your next project or a homeowner willing to put in some work and build equity, this is the kind of deal that doesn’t come around often in today’s market. Conveniently located with easy access to major highways, shopping, and dining, the location adds long-term value to the opportunity. If you’ve been waiting for a property you ca
Key facts
- Quiet cul-de-sac
- Functional layout
- Shopping and dining
Tags
Property features AI
Finance
- Other: Property listed as active; Living area reported as 960 (assessor)
- Financial info: Loan financing available; Not assumable
- HOA & community: No mandatory association dues
Exterior
- Home design: Single family residence; One-story property; Existing property
- Construction: Frame construction; Composition roof; Slab foundation; Built on an existing lot in the Sleepyhollow Hills addition
- Exterior features: Interior lot; No exterior special features listed
Interior
- Bedrooms: 2 bedrooms
- Bathrooms: 2 full bathrooms
- Interior features: One living area; No fireplace
Neighborhood map
What this means for you Summary
Snapshot
- This is a 2-bed/2.0-bath manufactured listed at $62k.
Deal economics
- At list price, monthly cash flow is $910 ($11k/yr) — positive.
- The deal already cash-flows at list — no discount required.
- Meets the 1% rule at list price ($2k rent vs $62k).
- Recommended offer: $61k (1.5% below list) — sets the bar for market timing.
- Cap rate 23.9% vs local median 3.7% in Oklahoma City — top-decile yield for the area; either an underpriced asset or a hidden risk that comps aren't pricing in. Stress-test before assuming the spread holds.
Location & tenants
- Location reads 80/100 on livability (#3 in OK, #1,635 nationally) — a professional / high-income tenant draw. Strengths: amenities A+, commute A+, cost of living A+; Watch: crime F.
- Mcloud (rural): math 13% / reading 19% proficiency, ranked #201 of 270 in OK (top 74%) — low school quality limits family demand, transient renter base, plan for 1-2y turnover.
- Zoned schools: Mcloud Es (math 27% / reading 22%, grade F, #354 of 845 statewide, top 47%, 214 students, 0% FRL); Mcloud Hs (math 12% / reading 27%, grade F, #296 of 447 statewide, top 67%, 509 students, 0% FRL) — zoned schools average 0% FRL vs 53% district-wide (53 pts lower); this property's tenant base skews higher-income than the district average.
- Market conditions: 96 active listings in the ZIP; 592 units permitted in Cleveland County in 2024 (12 in 5+ unit buildings).
Forward outlook
- Local home prices are declining (-3.0%/yr); year-one equity from $429 of loan paydown is wiped out by about $2k of value loss. Plan a longer hold.
- Cleveland County population projected at +40% by 2050 — long-run rental-demand tailwind backs the buy-and-hold thesis.
- At projected returns (-3.0% appreciation + 3.0% rent growth), your $17k cash investment doubles in ~2 years — after that, you're playing with house money.
Negotiation context
- It's been on market 28 days — a 2% lower offer ($61k) is reasonable based on typical stale-listing flexibility.
- 2 sale attempts with the ask held roughly flat each time — persistent listings suggest the price (not the market) is what's stuck; bring a comps-based counter.
- Current owner paid $8k; list at $62k implies a 675% gain — meaningful room to come down on a strong offer.
Risks & watch-outs
- Climate carrying-cost: moderate wildfire risk; extreme-heat days projected 7→18/yr by 2055 (HVAC capex compounding) — expect insurance premiums to compound above CPI over the hold.
Questions for the listing agent
- Is there a deadline driving the sale (1031 exchange, divorce, estate, relocation)? That informs how much negotiation room exists.
- Schools are F-rated, which usually means shorter tenancies and higher turnover. Who's the typical renter profile here, and what's been the actual vacancy rate?
- Crime grade is F in this area — have there been break-ins, vandalism, or insurance claims at this property in the last 3 years? What carrier currently insures it and at what premium?
- What's the average days-on-market for RENTAL listings here right now (not sales)? A rising rental-DOM trend means longer vacancies and softer asking-rent achievability than the comps imply.
- What's the recent tenant-quality profile in this submarket — average credit score on applications, eviction rate, late-payment / NSF rate, and stable-employment percentage? A property-management company in the area should have these aggregated.
- How much new for-sale + rental construction is in the pipeline within 1–3 miles? Heavy new supply typically softens prices + rents 12–24 months out; constrained supply supports both.
Investment metrics
- 1% rule
- 2.62% ✓
- Cap rate
- 23.92%
- Cash-on-cash
- 62.94%
- DSCR
- 3.80
- GRM
- 3.2
CMA / ARV
No comps found within radius.
Projected returns pro-forma
-3.0% appreciation · 3.0% rent growth · sell at horizon
- IRR
- 61.9%
- Equity multiple
- 3.76×
- Total profit
- $47,933
- Equity at exit
- $9,244
- IRR
- 66.5%
- Equity multiple
- 7.70×
- Total profit
- $116,372
- Equity at exit
- $5,361
Cash invested: $17,360 (down + closing). Projections, not guarantees.
Landlord ↔ Tenant lean methodology
- Overall (STATE)
- 83 Strongly Landlord-Friendly
- State Oklahoma
- 83 Strongly Landlord-Friendly · R+20
- County
- — inherits STATE
- City
- — inherits STATE
ZIP-level market 74857
- Home prices YoY
- -10.6%
- Active inventory
- 96
- Price-to-rent
- 3.2×
Monthly cashflow live
- Estimated rent
- $1,625 medium interval (Pro) →
- Mortgage (P&I)
- −$325
- Tax from tax record
- −$23 /mo · $272/yr
- Insurance
- −$26
- HOA
- −$0
- Vacancy / Maint / Mgmt
- −$341
- Net cashflow
- $910
Break-even live
UW: 25.0% down · 7.5% · 30yr · 1.5% tax · 5.0% vac · 8.0% maint · 8.0% mgmt
Financing live
Cash to close
- Down payment
- $15,500
- Closing costs
- $1,860
- Reserves months
- —
- Total cash needed
- —
Loan-product check · same deal, 3 products live
Conventional
25% down · 7.5% · 30yr
- Down + closing
- —
- Monthly P&I
- —
- Monthly cashflow
- —
- DSCR
- —
- Eligible?
- —
Personal DTI + credit; lowest rate.
DSCR
20% down · 8.5% · 30yr
- Down + closing
- —
- Monthly P&I
- —
- Monthly cashflow
- —
- DSCR
- —
- Eligible?
- —
No personal income docs; deal must DSCR.
Hard money
10% down · 12.0% · 12mo
- Down + closing
- —
- Monthly P&I
- —
- Monthly cashflow
- —
- DSCR
- —
- Eligible?
- —
Short-term bridge; refi at stabilization.
Listing history 19 events
-
2026-06-17days on market $62,000 Active 28 DOM
-
2026-06-16days on market $62,000 Active 27 DOM
-
2026-06-15days on market $62,000 Active 26 DOM
-
2026-06-14days on market $62,000 Active 24 DOM
-
2026-06-12days on market $62,000 Active 23 DOM
-
2026-06-09days on market $62,000 Active 20 DOM
-
2026-06-08days on market $62,000 Active 19 DOM
-
2026-06-07days on market $62,000 Active 18 DOM
-
2026-06-05days on market $62,000 Active 15 DOM
-
2026-06-02days on market $62,000 Active 13 DOM
-
2026-06-01days on market $62,000 Active 12 DOM
-
2026-05-31days on market $62,000 Active 11 DOM
-
2026-05-30days on market $62,000 Active 10 DOM
-
2026-05-20$62,000 Active
-
2026-05-14historical
-
2026-05-13price $62,000
-
2026-05-01$75,000 Active
-
2000-04-23soldstatus $8,000
-
1989-06-02soldstatus $16,000
ⓘ Source: listings_history table (triggers on properties + properties_extension) + one-shot
backfill from property_details.listing_events for pre-trigger history.
Tax reassessment forecast OK · Resets to sale price
- Current annual tax
- $272 · $23/mo
- Projected year-2 tax
- $558 · $46/mo
- Expected delta
- +$286/yr (+$24/mo · 105.1%)
ⓘ Screening estimate from a state-policy table — verify with the county assessor before closing.
Climate risk First Street
- Flood 1/10 Low FEMA zone X (unshaded) · 0% chance over 30 yrs
- Wildfire 5/10 Major
- Heat 5/10 Major 7 d/yr ≥108°F today · 18 d/yr by 30 yrs out
- Wind 3/10 Moderate 6% chance of damaging wind over 30 yrs
- Air quality 2/10 Low 0 unhealthy d/yr today · 1 by 30 yrs out
Nearby sold comps map
Loading sold comps map…
Walkable amenities ~0.75 mi
Loading nearby amenities…
Taxation est. · year 1
- Rental income
- $19,506
- − Mortgage interest
- −$3,473
- − Property taxes
- −$272
- − Insurance
- −$310
- − Repairs & maintenance
- −$1,560
- − Management
- −$1,560
- − Depreciation
- −$1,804
- Taxable income
- $10,526
- Est. tax owed @ 24.0%
- −$2,526
- After-tax cash flow
- $8,399/yr
For passive investors: Depreciation is non-cash, so a rental often shows a tax loss while cash-flowing — sheltering income. Rental losses are passive: they offset passive income freely, and up to $25,000/yr can offset ordinary (W-2) income if you actively participate and your MAGI is under $100k (phasing out to $0 by $150k); unused losses carry forward. On sale, claimed depreciation is recaptured at up to 25%, and gains may owe capital-gains tax (a 1031 exchange can defer both). Figures are a year-1 estimate at your 24.0% rate — not tax advice; consult a CPA.
Schools (NCES district)
- District
- Mcloud
- NCES district ID
- 4019560
- Math proficiency
- 13% ▼ -12.00%
- Reading proficiency
- 19% ▼ -13.00%
- Median HH income
- $51,519
- Composite
- 14.72/100
- National rank
- #9398
- State rank
- #201 of 270 in OK
Livability — Oklahoma City
- Score
- 80/100
- State rank
- #3
- US rank
- #1635
Category grades
Schools grade is shown separately in the Schools card above.
Census & demographics
- Census place
- Oklahoma City, OK
- City population
- 498,656
- Population (ZIP)
- 9,902
Population outlook (Cleveland County) Hauer SSP2
- Today (2025)
- 323,621 people
- By 2030
- 349,070 · +7.9%
- By 2040
- 400,168 · +23.7%
- By 2050
- 454,101 · +40.3%
- By 2075
- 602,926 · +86.3%
- By 2100
- 734,485 · +127.0%
Race, ethnicity, and origin ACS 2023
- Neighborhood character
- Predominantly White (79%)
- Race & ethnicity
- White 79% Two or more races 9% Native American 8% Hispanic / Latino 4% Black 2%
- Common ancestry
- Slovak 2% Iranian 2% Romanian 1%
- Foreign-born
- 1% · Canada
- Languages at home
- 96% English-only · Spanish 3%
Political lean MEDSL · Cleveland
- 2024 margin
- R (+14.9) · D 41.4% · R 56.4% · Other 2.2%
- 2008→2024 swing
- +9.1pp toward D · 2008: -24.0pp · 2024: -14.9pp
- All cycles
- 2024: R+14.9 2020: R+14.1 2016: R+21.7 2012: R+25.9 2008: R+24.0
Not yet ingested
- Civics
- —
Market trends
- HPI YoY
- ▼ -33.83%
- Current HPI
- 284.6727
- Rent YoY
- —
- Metro
- —
- State GDP YoY
- ▲ 1.55%
- F500 in state
- 6
Industry mix (Fortune 500 HQ in OK)
| Industry | F500 HQs | Revenue |
|---|---|---|
| Energy | 3 | $48B |
|
||
Price history
+287.5% since first listed6 events — show timeline
- 2026-05-20 Listed $62,000 MLSOK
- 2026-05-14 Listing Removed — MLSOK
- 2026-05-13 Price Changed $62,000 MLSOK
- 2026-05-01 Listed $75,000 MLSOK
- 2000-04-23 Sold (Public Records) $8,000 Public Records
- 1989-06-02 Sold (Public Records) $16,000 Public Records
Property tax history
+0.1%/yrLatest (2024): $272 · +4.2% YoY. Source: county tax records.
Cash-flow waterfall
monthlySold comps — $/sqft
last 12 mo · ≤1 miLoading sold comps…