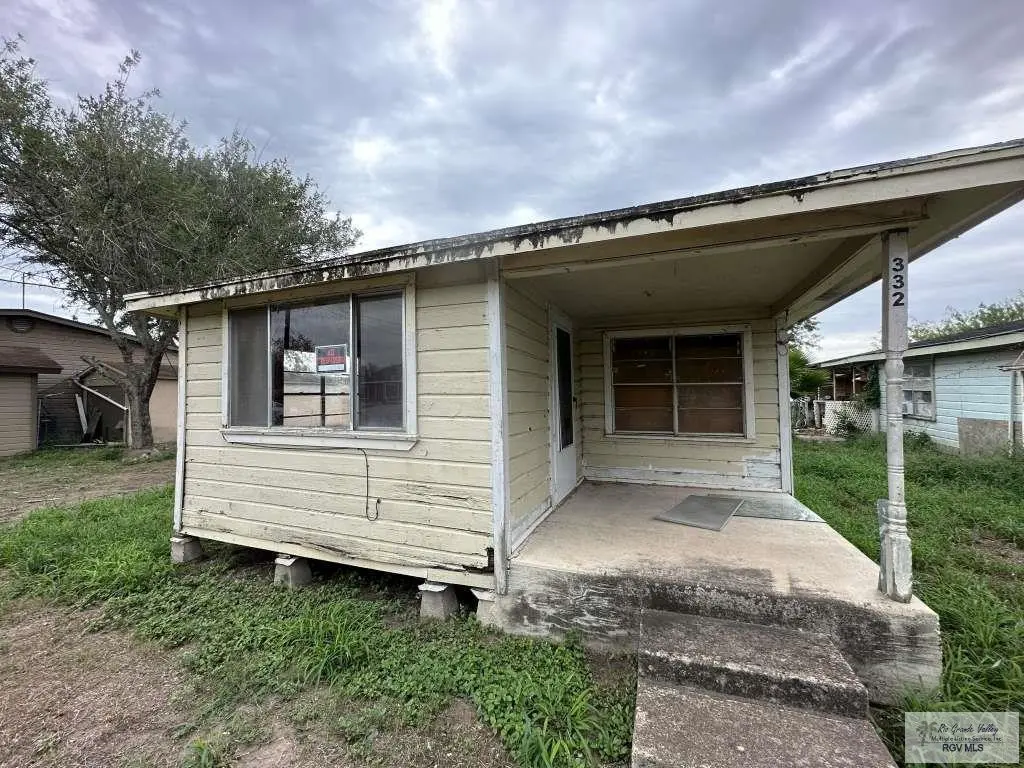
332 E 6th St · La Villa, TX
Flood risk 1/10 · Minimal
- FEMA flood zone
- X
- Chance of flooding over 30 yrs
- 0.0%
- Est. flood insurance / yr
- $507 – $1,088
Fire risk 1/10 · Minimal
- Est. fire insurance / yr
- $1,222 – $2,270
Heat risk 9/10 · Severe
- Hot days now (above 111°F)
- 7 days/yr
- Hot days in 30 yrs
- 23 days/yr
Wind risk 8/10 · Major
- Chance of severe wind over 30 yrs
- 99.0%
Air-quality risk 1/10 · Minimal
- Unhealthy air days now
- 0 days/yr
- Unhealthy air days in 30 yrs
- 0 days/yr
Risk factors via First Street. Map © Google.
Why this score? — see what drove the C grade
The composite is a weighted blend of 9 inputs, each scored 0–100. Each bar is that input's sub-score; the figure is the points it added to the 100-point composite (weight × sub-score).
- Cash flow +17.7/30.0
- ARV discount +13.9/15.0
- Appreciation +6.7/10.0
- DSCR +5.5/10.0
- 1% rule +4.8/10.0
- Livability +3.3/5.0
- Rent growth +2.5/5.0
- Schools +1.2/10.0
- Condition / age +1.0/5.0
$73,719
🖨 Deal sheet (PDF) 📄 Offer letter ✓ Due diligence
Listing remarks
Handy-Man Special with 2 bedrooms and 1 bath. Quiet community! This home offers you convenience. It's just minutes away from schools, shops, restaurants, parks and more! As Is.
Key facts
- 6,250 sq ft lot
- Built 1965
- Listed 1383 days
Property features AI
Finance
- Other: Listing broker: SWE Homes, LP; Listing agent: Dan L Cook
Exterior
- Utilities: Public water; Public sewer
- Home design: Single-family residence; One-story house
- Construction: Wood siding construction
- Exterior features: Composition roof; Lot approximately 0.14 acres; Subdivision: LOS EBANOS; Directions: From Hwy. 107 west make a right turn on Mike Chapa Rd., and make a right on 6th St.
Interior
- Bathrooms: 1 full bathroom
- Interior features: Unbranded virtual tour available
Neighborhood map
What this means for you Summary
Snapshot
- This is a 2-bed/1.0-bath single-family listed at $74k. Condition is rated poor.
Deal economics
- At list price, monthly cash flow is $59 ($712/yr) — positive.
- The deal already cash-flows at list — no discount required.
- To meet the 1% rule (rent ≥ 1% of price), the offer needs to be $72k (2.3% below list).
- Recommended offer: $65k (12.0% below list) — sets the bar for market timing.
Location & tenants
- Location reads 66/100 on livability (#591 in TX) — a middle-class / working-renter tenant base. Strengths: cost of living A+, housing A+, crime A-; Watch: amenities F, commute F, health & safety F.
- La Villa ISD (suburban): math 11% / reading 20% proficiency, ranked #815 of 826 in TX (top 99%) — low school quality limits family demand, transient renter base, plan for 1-2y turnover; 81% free/reduced lunch — lower-income household profile, screen leases tightly.
- Zoned schools: Jose Bernabe Munoz El (math 17% / reading 22%, grade F, #3,583 of 4,322 statewide, top 86%, 243 students, 96% FRL); La Villa Middle (math 8% / reading 12%, grade F, #1,646 of 1,662 statewide, top 99%, 141 students, 93% FRL); La Villa Early College H S (math 5% / reading 34%, grade F, #1,415 of 1,632 statewide, top 87%, 182 students, 92% FRL).
- Market conditions: 6 active listings in the ZIP; 1 comparable units currently listed for rent nearby; 7,378 units permitted in Hidalgo County in 2024 (641 in 5+ unit buildings).
Forward outlook
- In year one you build about $3k of equity ($509 loan paydown + $3k appreciation (3.4% local appreciation)).
- Hidalgo County population projected at +28% by 2050 — long-run rental-demand tailwind backs the buy-and-hold thesis.
- At projected returns (3.4% appreciation + 3.0% rent growth), your $21k cash investment doubles in ~5 years — after that, you're playing with house money.
Negotiation context
- It's been on market 1383 days — a 12% lower offer ($65k) is reasonable based on typical stale-listing flexibility.
- 2 sale attempts since 4y ago with the ask held roughly flat each time — persistent listings suggest the price (not the market) is what's stuck; bring a comps-based counter.
Risks & watch-outs
- Climate carrying-cost: severe wind risk, 99% chance of damaging wind over 30y; extreme-heat days projected 7→23/yr by 2055 (HVAC capex compounding) — expect insurance premiums to compound above CPI over the hold.
Questions for the listing agent
- It's been on market 1383 days. Have you received any prior offers? Is the seller open to a 12% concession, seller financing, or rate buy-down credit?
- Have any recent inspections been done? Can we get a copy of the seller's disclosures and any deferred-maintenance estimates?
- Built in 1965 — when were the roof, HVAC, electrical panel, plumbing, and water heater last replaced?
- Why hasn't it sold? Are there any deal-killer items the seller is aware of (foundation, flood, title, zoning, code violations)?
- Is there a deadline driving the sale (1031 exchange, divorce, estate, relocation)? That informs how much negotiation room exists.
- Schools are F-rated, which usually means shorter tenancies and higher turnover. Who's the typical renter profile here, and what's been the actual vacancy rate?
- What's the average days-on-market for RENTAL listings here right now (not sales)? A rising rental-DOM trend means longer vacancies and softer asking-rent achievability than the comps imply.
- What's the recent tenant-quality profile in this submarket — average credit score on applications, eviction rate, late-payment / NSF rate, and stable-employment percentage? A property-management company in the area should have these aggregated.
- How much new for-sale + rental construction is in the pipeline within 1–3 miles? Heavy new supply typically softens prices + rents 12–24 months out; constrained supply supports both.
Investment metrics
- 1% rule
- 0.98% ✗
- Cap rate
- 7.26%
- Cash-on-cash
- 3.45%
- DSCR
- 1.15
- GRM
- 8.5
CMA / ARV
- ARV (median comp)
- $86,049
- List price
- $73,719
- Delta
- -14.33%
- Verdict
- UNDERPRICED
- Comps
- 4 within 1.0 mi
Show comp detail 1 sale within ~0.75 mi
| Address | Dist | Beds/Ba | Sqft | Sold | Price | $/sf | Match |
|---|---|---|---|---|---|---|---|
| 320 Magnolia St | 0.21mi | 2/1.0 | 868 (-0%) | 15mo | $38,000 | $44 | 76 |
Match score weights: distance 35% · size 25% · config 20% · recency 20%. Top-matched comps best support the ARV.
Projected returns pro-forma
3.41% appreciation · 3.0% rent growth · sell at horizon
- IRR
- 11.8%
- Equity multiple
- 1.69×
- Total profit
- $14,269
- Equity at exit
- $34,847
- IRR
- 13.7%
- Equity multiple
- 3.11×
- Total profit
- $43,579
- Equity at exit
- $55,064
Cash invested: $20,641 (down + closing). Projections, not guarantees.
Landlord ↔ Tenant lean methodology
- Overall (STATE)
- 87 Strongly Landlord-Friendly
- State Texas
- 87 Strongly Landlord-Friendly · R+5
- County
- — inherits STATE
- City
- — inherits STATE
ZIP-level market 78562
- Home prices YoY
- 1.6%
- Active inventory
- 6
- Price-to-rent
- 8.5×
Monthly cashflow live
- Estimated rent
- $720 medium interval (Pro) →
- Mortgage (P&I)
- −$387
- Tax est. 1.5%
- −$92 /mo · $1,106/yr
- Insurance
- −$31
- HOA
- −$0
- Vacancy / Maint / Mgmt
- −$151
- Net cashflow
- $59
Break-even live
Sensitivity live
| Price | -10% $110 | -5% $85 | +0% $59 | +5% $34 | +10% $8 |
|---|---|---|---|---|---|
| Rent | -10% $2 | -5% $31 | +0% $59 | +5% $88 | +10% $116 |
| Rate | -1.0pp $96 | -0.5pp $78 | base $59 | +0.5pp $40 | +1.0pp $21 |
UW: 25.0% down · 7.5% · 30yr · 1.5% tax · 5.0% vac · 8.0% maint · 8.0% mgmt
Financing live
Cash to close
- Down payment
- $18,430
- Closing costs
- $2,212
- Reserves months
- —
- Total cash needed
- —
Loan-product check · same deal, 3 products live
Conventional
25% down · 7.5% · 30yr
- Down + closing
- —
- Monthly P&I
- —
- Monthly cashflow
- —
- DSCR
- —
- Eligible?
- —
Personal DTI + credit; lowest rate.
DSCR
20% down · 8.5% · 30yr
- Down + closing
- —
- Monthly P&I
- —
- Monthly cashflow
- —
- DSCR
- —
- Eligible?
- —
No personal income docs; deal must DSCR.
Hard money
10% down · 12.0% · 12mo
- Down + closing
- —
- Monthly P&I
- —
- Monthly cashflow
- —
- DSCR
- —
- Eligible?
- —
Short-term bridge; refi at stabilization.
Rent comps 1 comps
| Address | Beds | Baths | Sqft | Rent | $/sqft | DOM | Units | Dist |
|---|---|---|---|---|---|---|---|---|
| 201 W Mile 2 unit 2 W Edcouch, TX | 1.0 | 1.0 | 700 | $720 | $1.03 | 45d | 1 | 1.25mi |
Listing history 20 events
-
2026-06-21days on market $73,719 Active 1383 DOM
-
2026-06-21days on market $73,719 Active 1382 DOM
-
2026-06-18days on market $73,719 Active 1380 DOM
-
2026-06-17days on market $73,719 Active 1379 DOM
-
2026-06-16days on market $73,719 Active 1378 DOM
-
2026-06-15days on market $73,719 Active 1377 DOM
-
2026-06-13days on market $73,719 Active 1375 DOM
-
2026-06-12days on market $73,719 Active 1374 DOM
-
2026-06-10days on market $73,719 Active 1371 DOM
-
2026-06-08days on market $73,719 Active 1370 DOM
-
2026-06-08days on market $73,719 Active 1369 DOM
-
2026-06-05days on market $73,719 Active 1367 DOM
-
2026-06-03days on market $73,719 Active 1365 DOM
-
2026-06-02days on market $73,719 Active 1364 DOM
-
2026-06-01days on market $73,719 Active 1363 DOM
-
2026-05-31days on market $73,719 Active 1362 DOM
-
2024-09-11price $73,719
-
2023-09-02status Active
-
2023-08-11historical
-
2022-08-15$75,999 Active
ⓘ Source: listings_history table (triggers on properties + properties_extension) + one-shot
backfill from property_details.listing_events for pre-trigger history.
Climate risk First Street
- Flood 1/10 Low FEMA zone X · 0% chance over 30 yrs
- Wildfire 1/10 Low
- Heat 9/10 Extreme 7 d/yr ≥111°F today · 23 d/yr by 30 yrs out
- Wind 8/10 Severe 99% chance of damaging wind over 30 yrs
- Air quality 1/10 Low 0 unhealthy d/yr today · 0 by 30 yrs out
Nearby sold comps map
Loading sold comps map…
Walkable amenities ~0.75 mi
Loading nearby amenities…
Taxation est. · year 1
- Rental income
- $8,640
- − Mortgage interest
- −$4,129
- − Property taxes
- −$1,106
- − Insurance
- −$369
- − Repairs & maintenance
- −$691
- − Management
- −$691
- − Depreciation
- −$2,145
- Taxable loss
- −$491
- Est. tax savings @ 24.0%
- +$118
- After-tax cash flow
- $830/yr
For passive investors: Depreciation is non-cash, so a rental often shows a tax loss while cash-flowing — sheltering income. Rental losses are passive: they offset passive income freely, and up to $25,000/yr can offset ordinary (W-2) income if you actively participate and your MAGI is under $100k (phasing out to $0 by $150k); unused losses carry forward. On sale, claimed depreciation is recaptured at up to 25%, and gains may owe capital-gains tax (a 1031 exchange can defer both). Figures are a year-1 estimate at your 24.0% rate — not tax advice; consult a CPA.
Condition & rehab AI · 12 photos
This property requires extensive repairs and updates to bring it up to a livable condition. Immediate repairs are needed to prevent further damage and improve the home's safety and functionality.
Repairs flagged
- Major Exposed plumbing in kitchen — Needs immediate repair to prevent water damage
- Major Exposed plumbing in bathrooms — Needs immediate repair to prevent water damage
- Major Damaged siding — Needs repair to prevent further deterioration
- Major Damaged flooring in kitchen and bathrooms — Needs replacement to ensure safety and functionality
- Major Peeling paint on interior walls — Needs repainting to improve appearance
- Major Exposed drywall — Needs repair to prevent further damage
- Major Damaged roof — Needs repair to prevent water infiltration
- Major Damaged window frames — Needs repair to prevent further deterioration
- Major Structural issues — Needs assessment and repair to ensure safety
- Major Exposed ductwork — Needs repair to prevent further damage
Value-add opportunities
- Resale New flooring in kitchen and bathrooms — New flooring will improve the appearance and functionality of the spaces
- Resale New paint job — New paint will improve the appearance and make the home more appealing to potential buyers
- Resale New roof — A new roof will improve the appearance and functionality of the home
- Resale New window frames — New window frames will improve the appearance and functionality of the home
- Resale Structural repairs — Structural repairs will ensure the home is safe and functional
- Both New HVAC system — A new HVAC system will improve the comfort and functionality of the home, and will be a selling point for potential buyers
- Both Landscaping and curb appeal — A well-maintained yard and curb appeal will make the home more attractive and increase its value
Renovation cost estimate screening
| Repair item | Severity | Est. cost |
|---|---|---|
| Exposed plumbing in kitchen · Needs immediate repair to prevent water damage | Major | $15,000–50,000 |
| Exposed plumbing in bathrooms · Needs immediate repair to prevent water damage | Major | $15,000–50,000 |
| Damaged siding · Needs repair to prevent further deterioration | Major | $15,000–50,000 |
| Damaged flooring in kitchen and bathrooms · Needs replacement to ensure safety and functionality | Major | $15,000–50,000 |
| Peeling paint on interior walls · Needs repainting to improve appearance | Major | $15,000–50,000 |
| Exposed drywall · Needs repair to prevent further damage | Major | $15,000–50,000 |
| Damaged roof · Needs repair to prevent water infiltration | Major | $15,000–50,000 |
| Damaged window frames · Needs repair to prevent further deterioration | Major | $15,000–50,000 |
| Structural issues · Needs assessment and repair to ensure safety | Major | $15,000–50,000 |
| Exposed ductwork · Needs repair to prevent further damage | Major | $15,000–50,000 |
| Total estimated repair cost · 10 items | $150,000–500,000 |
Value-add ROI direction
- Resale New flooring in kitchen and bathrooms — New flooring will improve the appearance and functionality of the spaces ↑
- Resale New paint job — New paint will improve the appearance and make the home more appealing to potential buyers ↑
- Resale New roof — A new roof will improve the appearance and functionality of the home ↑
- Resale New window frames — New window frames will improve the appearance and functionality of the home ↑
- Resale Structural repairs — Structural repairs will ensure the home is safe and functional ↑
- Both New HVAC system — A new HVAC system will improve the comfort and functionality of the home, and will be a selling point for potential buyers ↑
- Both Landscaping and curb appeal — A well-maintained yard and curb appeal will make the home more attractive and increase its value ↑
ⓘ Cost ranges are severity-bucket heuristics (US national rule-of-thumb). Get contractor quotes + a written scope before underwriting a rehab budget.
Schools (NCES district)
- District
- La Villa ISD
- NCES district ID
- 4826340
- Math proficiency
- 11% ▼ -22.00%
- Reading proficiency
- 20% ▼ -15.00%
- Median HH income
- $30,876
- Composite
- 12.32/100
- National rank
- #9641
- State rank
- #815 of 826 in TX
Livability — La Villa
- Score
- 66/100
- State rank
- #591
- US rank
- #11264
Category grades
Schools grade is shown separately in the Schools card above.
Census & demographics
- Census place
- La Villa, TX
- Population (ZIP)
- 3,146
Population outlook (Hidalgo County) Hauer SSP2
- Today (2025)
- 955,232 people
- By 2030
- 1,009,774 · +5.7%
- By 2040
- 1,120,332 · +17.3%
- By 2050
- 1,225,036 · +28.2%
- By 2075
- 1,439,189 · +50.7%
- By 2100
- 1,533,429 · +60.5%
Race, ethnicity, and origin ACS 2023
- Neighborhood character
- Predominantly Hispanic (99%)
- Race & ethnicity
- Hispanic / Latino 99% Two or more races 35%
- Hispanic origin (detail)
- Mexican 86%
- Foreign-born
- 32% · Canada
- Languages at home
- 11% English-only · Spanish 88%
Political lean MEDSL · Hidalgo
- 2024 margin
- Toss-up / Even · D 48.1% · R 51.0%
- 2008→2024 swing
- -41.6pp toward R · 2008: 38.7pp · 2024: -2.9pp
- All cycles
- 2024: R+2.9 2020: D+17.1 2016: D+40.5 2012: D+41.8 2008: D+38.7
Not yet ingested
- Civics
- —
Market trends
- HPI YoY
- ▲ 3.41%
- Current HPI
- 218.8138
- Rent YoY
- —
- Metro
- —
- State GDP YoY
- ▲ 3.95%
- F500 in state
- 110
Industry mix (Fortune 500 HQ in TX)
| Industry | F500 HQs | Revenue |
|---|---|---|
| Energy | 16 | $1,198B |
|
||
| Technology | 5 | $198B |
|
||
| Engineering / Construction | 4 | $72B |
|
||
| Energy Services | 3 | $60B |
|
||
| Utilities | 3 | $41B |
|
||
| Healthcare | 2 | $330B |
|
||
Price history
-3.0% since first listed4 events — show timeline
- 2024-09-11 Price Changed $73,719 RGVMLS
- 2023-09-02 Relisted — RGVMLS
- 2023-08-11 Delisted — RGVMLS
- 2022-08-15 Listed $75,999 RGVMLS
Cash-flow waterfall
monthlySold comps — $/sqft
last 12 mo · ≤1 miLoading sold comps…