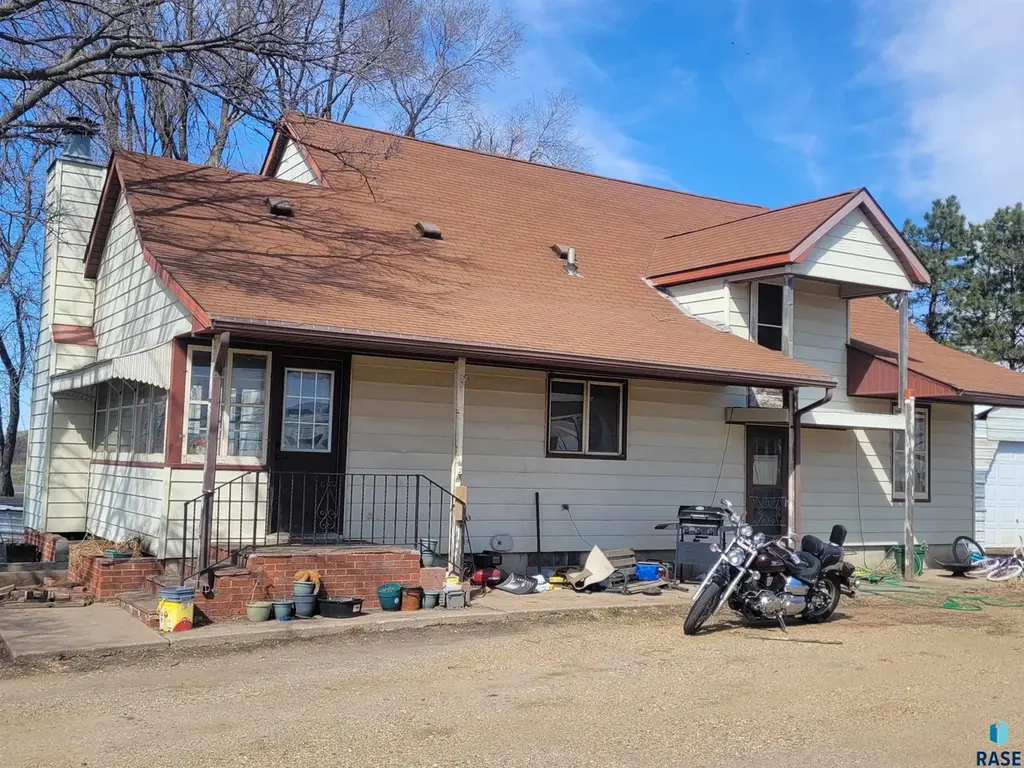
8101 W 12th St St · Sioux Falls, SD
Flood risk 1/10 · Minimal
- FEMA flood zone
- X (unshaded)
- Chance of flooding over 30 yrs
- 0.0%
- Est. flood insurance / yr
- $473 – $860
Fire risk 4/10 · Minor
- Est. fire insurance / yr
- $1,342 – $2,492
Heat risk 2/10 · Minimal
- Hot days now (above 99°F)
- 7 days/yr
- Hot days in 30 yrs
- 14 days/yr
Wind risk 2/10 · Minimal
- Chance of severe wind over 30 yrs
- —
Air-quality risk 2/10 · Minimal
- Unhealthy air days now
- 1 days/yr
- Unhealthy air days in 30 yrs
- 1 days/yr
Risk factors via First Street. Map © Google.
Why this score? — see what drove the B+ grade
The composite is a weighted blend of 9 inputs, each scored 0–100. Each bar is that input's sub-score; the figure is the points it added to the 100-point composite (weight × sub-score).
- Cash flow +30.0/30.0
- 1% rule +10.0/10.0
- DSCR +10.0/10.0
- ARV discount +7.5/15.0
- Appreciation +5.0/10.0
- Livability +4.2/5.0
- Schools +3.7/10.0
- Rent growth +2.5/5.0
- Condition / age +2.5/5.0
$50,000
🖨 Deal sheet 📄 Offer letter ✓ Due diligence
Key facts
- Built 1940
- Listed 48 days
Property features AI
Finance
- Financial info: Annual tax noted (amount withheld per instructions)
Exterior
- Utilities: Water source: Other; Sewer: Other; Electric service: (not specified)
- Home design: Two-story single family residence; Above-grade finished living area approximately 2,019
- Construction: Composition roof; Other foundation; Construction materials: Other; Built with other/unspecified materials
- Exterior features: Owned land
Interior
- Kitchen: Dishwasher; Electric range; Refrigerator
- Bedrooms: Total of 9 rooms (includes bedrooms and living spaces)
- Flooring: Laminate flooring; Wood flooring
- Bathrooms: 3 full bathrooms
- Heating & cooling: Natural gas heating; Window air conditioning units
- Interior features: Living room with a wood-burning fireplace
- Laundry & utility: No whole-house water softener indicated; Natural gas water heater
Neighborhood map
What this means for you Summary
Snapshot
- This is a 4-bed/4.0-bath single-family listed at $50k.
Deal economics
- At list price, monthly cash flow is $1k ($15k/yr) — positive.
- The deal already cash-flows at list — no discount required.
- Meets the 1% rule at list price ($2k rent vs $50k).
- Recommended offer: $48k (3.0% below list) — sets the bar for market timing.
- Cap rate 36.6% vs local median 2.6% in Sioux Falls — top-decile yield for the area; either an underpriced asset or a hidden risk that comps aren't pricing in. Stress-test before assuming the spread holds.
Location & tenants
- Location reads 85/100 on livability (#3 in SD, #610 nationally) — a professional / high-income tenant draw. Strengths: amenities A+, commute A+, cost of living A+; Watch: crime F.
- Sioux Falls School District 49-5 (urban): math 39% / reading 48% proficiency, ranked #45 of 59 in SD (top 76%) — families likely to look elsewhere, expect single-tenant / working-renter base with shorter leases.
- Zoned schools: Discovery Elementary - 26 (math 55% / reading 53%, grade C, #97 of 253 statewide, top 38%, 877 students, 18% FRL); Jefferson High School - 67 (1,749 students, 34% FRL).
- Market conditions: 1 active listings in the ZIP; 2 comparable units currently listed for rent nearby; 2,425 units permitted in Minnehaha County in 2024 (1,367 in 5+ unit buildings).
Forward outlook
- In year one you build about $2k of equity ($346 loan paydown + $2k appreciation (3.0% local appreciation)).
- Minnehaha County population projected at +46% by 2050 — long-run rental-demand tailwind backs the buy-and-hold thesis.
- At projected returns (3.0% appreciation + 3.0% rent growth), your $14k cash investment doubles in ~1 year — after that, you're playing with house money.
Negotiation context
- It's been on market 48 days — a 3% lower offer ($48k) is reasonable based on typical stale-listing flexibility.
Risks & watch-outs
- Watch-outs: built in 1940 — expect roof / HVAC / electrical / plumbing capex.
Questions for the listing agent
- It's been on market 48 days. Have you received any prior offers? Is the seller open to a 3% concession, seller financing, or rate buy-down credit?
- Built in 1940 — when were the roof, HVAC, electrical panel, plumbing, and water heater last replaced?
- Is there a deadline driving the sale (1031 exchange, divorce, estate, relocation)? That informs how much negotiation room exists.
- Schools are B-rated — typically a magnet for longer-tenancy family renters. What's the average tenant stay here, and is there a school-zone premium baked into asking?
- Crime grade is F in this area — have there been break-ins, vandalism, or insurance claims at this property in the last 3 years? What carrier currently insures it and at what premium?
- What's the average days-on-market for RENTAL listings here right now (not sales)? A rising rental-DOM trend means longer vacancies and softer asking-rent achievability than the comps imply.
- What's the recent tenant-quality profile in this submarket — average credit score on applications, eviction rate, late-payment / NSF rate, and stable-employment percentage? A property-management company in the area should have these aggregated.
- How much new for-sale + rental construction is in the pipeline within 1–3 miles? Heavy new supply typically softens prices + rents 12–24 months out; constrained supply supports both.
Investment metrics
- 1% rule
- 4.07% ✓
- Cap rate
- 36.59%
- Cash-on-cash
- 108.20%
- DSCR
- 5.81
- GRM
- 2.0
CMA / ARV
- ARV (median comp)
- $318,549
- List price
- $50,000
- Delta
- -84.30%
- Verdict
- UNDERPRICED
- Comps
- 20 within 1.0 mi
Show comp detail 12 sales within ~0.75 mi
| Address | Dist | Beds/Ba | Sqft | Sold | Price | $/sf | Match |
|---|---|---|---|---|---|---|---|
| 604 S Clearbrook Ave Ave | 0.22mi | 4/2.0 | 1,952 (-3%) | 3mo | $353,500 | $181 | 74 |
| 7616 W Loganberry St | 0.39mi | 4/3.0 | 2,094 (+4%) | 9mo | $385,000 | $184 | 64 |
| 813 S Clearbrook Ave Ave | 0.37mi | 4/3.0 | 1,845 (-9%) | 4mo | $352,000 | $191 | 61 |
| 7809 Stoney Creek St St | 0.44mi | 4/3.0 | 1,862 (-8%) | 8mo | $345,000 | $185 | 56 |
| 8804 W Nikita Dr | 0.57mi | 4/3.0 | 2,088 (+3%) | 13mo | $365,000 | $175 | 53 |
| 7525 W Stoney Creek St St | 0.51mi | 4/3.0 | 2,230 (+10%) | 3mo | $395,000 | $177 | 52 |
| 824 S Tanglewood Ave Ave | 0.43mi | 4/2.0 | 1,755 (-13%) | 2mo | $316,500 | $180 | 48 |
| 812 S Clearbrook Ave | 0.38mi | 4/3.0 | 2,306 (+14%) | 9mo | $430,000 | $186 | 47 |
| 1312 S Keva Ave | 0.66mi | 4/3.0 | 2,134 (+6%) | 11mo | $413,000 | $194 | 46 |
| 8908 W 18th St | 0.70mi | 4/2.0 | 1,844 (-9%) | 12mo | $365,000 | $198 | 35 |
| 7517 W Stoney Creek St | 0.52mi | 4/2.0 | 1,717 (-15%) | 12mo | $350,000 | $204 | 33 |
| 1201 S Keva Ave | 0.65mi | 4/3.0 | 2,304 (+14%) | 13mo | $438,000 | $190 | 31 |
Match score weights: distance 35% · size 25% · config 20% · recency 20%. Top-matched comps best support the ARV.
Projected returns pro-forma
3.0% appreciation · 3.0% rent growth · sell at horizon
- IRR
- —
- Equity multiple
- 7.18×
- Total profit
- $86,451
- Equity at exit
- $22,482
- IRR
- —
- Equity multiple
- 14.94×
- Total profit
- $195,134
- Equity at exit
- $34,648
Cash invested: $14,000 (down + closing). Projections, not guarantees.
Landlord ↔ Tenant lean methodology
- Overall (STATE)
- 83 Strongly Landlord-Friendly
- State South Dakota
- 83 Strongly Landlord-Friendly · R+16
- County
- — inherits STATE
- City
- — inherits STATE
ZIP-level market 57106-5839
- Active inventory
- 1
- Price-to-rent
- 2.0×
Monthly cashflow live
- Estimated rent
- $2,035 medium interval (Pro) →
- Mortgage (P&I)
- −$262
- Tax est. 1.5%
- −$62 /mo · $750/yr
- Insurance
- −$21
- HOA
- −$0
- Vacancy / Maint / Mgmt
- −$427
- Net cashflow
- $1,262
Break-even live
UW: 25.0% down · 7.5% · 30yr · 1.5% tax · 5.0% vac · 8.0% maint · 8.0% mgmt
Financing live
Cash to close
- Down payment
- $12,500
- Closing costs
- $1,500
- Reserves months
- —
- Total cash needed
- —
Loan-product check · same deal, 3 products live
Conventional
25% down · 7.5% · 30yr
- Down + closing
- —
- Monthly P&I
- —
- Monthly cashflow
- —
- DSCR
- —
- Eligible?
- —
Personal DTI + credit; lowest rate.
DSCR
20% down · 8.5% · 30yr
- Down + closing
- —
- Monthly P&I
- —
- Monthly cashflow
- —
- DSCR
- —
- Eligible?
- —
No personal income docs; deal must DSCR.
Hard money
10% down · 12.0% · 12mo
- Down + closing
- —
- Monthly P&I
- —
- Monthly cashflow
- —
- DSCR
- —
- Eligible?
- —
Short-term bridge; refi at stabilization.
Rent comps 2 comps
| Address | Beds | Baths | Sqft | Rent | $/sqft | DOM | Units | Dist |
|---|---|---|---|---|---|---|---|---|
| 6516 W 6th Pl Sioux Falls, SD | 4.0 | 2.5 | 1800 | $2,200 | $1.22 | 43d | 1 | 1.27mi |
| 2114 S Ronsiek Ave Sioux Falls, SD | 3.0 | 2.0 | 1420 | $1,799 | $1.27 | 13d | 1 | 1.43mi |
Listing history 18 events
-
2026-06-18days on market $50,000 Active 48 DOM
-
2026-06-17days on market $50,000 Active 47 DOM
-
2026-06-16days on market $50,000 Active 46 DOM
-
2026-06-15days on market $50,000 Active 45 DOM
-
2026-06-14days on market $50,000 Active 43 DOM
-
2026-06-13days on market $50,000 Active 42 DOM
-
2026-06-10days on market $50,000 Active 40 DOM
-
2026-06-09days on market $50,000 Active 39 DOM
-
2026-06-08days on market $50,000 Active 38 DOM
-
2026-06-07days on market $50,000 Active 37 DOM
-
2026-06-05days on market $50,000 Active 34 DOM
-
2026-06-03days on market $50,000 Active 33 DOM
-
2026-06-02days on market $50,000 Active 32 DOM
-
2026-06-01days on market $50,000 Active 31 DOM
-
2026-05-31days on market $50,000 Active 30 DOM
-
2026-05-30days on market $50,000 Active 29 DOM
-
2026-04-15$100,000 Active 168-char remark
-
2012-12-19soldstatus $348,993
ⓘ Source: listings_history table (triggers on properties + properties_extension) + one-shot
backfill from property_details.listing_events for pre-trigger history.
Climate risk First Street
- Flood 1/10 Low FEMA zone X (unshaded) · 0% chance over 30 yrs
- Wildfire 4/10 Moderate
- Heat 2/10 Low 7 d/yr ≥99°F today · 14 d/yr by 30 yrs out
- Wind 2/10 Low
- Air quality 2/10 Low 1 unhealthy d/yr today · 1 by 30 yrs out
Nearby sold comps map
Loading sold comps map…
Walkable amenities ~0.75 mi
Loading nearby amenities…
Taxation est. · year 1
- Rental income
- $24,423
- − Mortgage interest
- −$2,801
- − Property taxes
- −$750
- − Insurance
- −$250
- − Repairs & maintenance
- −$1,954
- − Management
- −$1,954
- − Depreciation
- −$1,455
- Taxable income
- $15,260
- Est. tax owed @ 24.0%
- −$3,662
- After-tax cash flow
- $11,485/yr
For passive investors: Depreciation is non-cash, so a rental often shows a tax loss while cash-flowing — sheltering income. Rental losses are passive: they offset passive income freely, and up to $25,000/yr can offset ordinary (W-2) income if you actively participate and your MAGI is under $100k (phasing out to $0 by $150k); unused losses carry forward. On sale, claimed depreciation is recaptured at up to 25%, and gains may owe capital-gains tax (a 1031 exchange can defer both). Figures are a year-1 estimate at your 24.0% rate — not tax advice; consult a CPA.
Schools (NCES district)
- District
- Sioux Falls School District 49-5
- NCES district ID
- 4666270
- Math proficiency
- 39% ▼ -4.00%
- Reading proficiency
- 48% ▼ -2.00%
- Median HH income
- $51,093
- Composite
- 37.47/100
- National rank
- #4407
- State rank
- #45 of 59 in SD
Livability — Sioux Falls
- Score
- 85/100
- State rank
- #3
- US rank
- #610
Category grades
Schools grade is shown separately in the Schools card above.
Census & demographics
No demographic data for this ZIP.
Market trends
- HPI YoY
- —
- Current HPI
- —
- Rent YoY
- —
- Metro
- —
- State GDP YoY
- ▲ 0.70%
- F500 in state
- 2
Industry mix (Fortune 500 HQ in SD)
| Industry | F500 HQs | Revenue |
|---|---|---|
| Utilities | 1 | $1B |
|
||
Price history
-85.7% since first listed3 events — show timeline
- 2026-05-22 Price Changed $50,000 REALTOR® Association of the Sioux Empire
- 2026-04-15 Listed $100,000 REALTOR® Association of the Sioux Empire
- 2012-12-19 Sold (Public Records) $348,993 Public Records
Property tax history
+4.7%/yrLatest (2024): $3,685 · +23.8% YoY. Source: county tax records.
Cash-flow waterfall
monthlySold comps — $/sqft
last 12 mo · ≤1 miLoading sold comps…