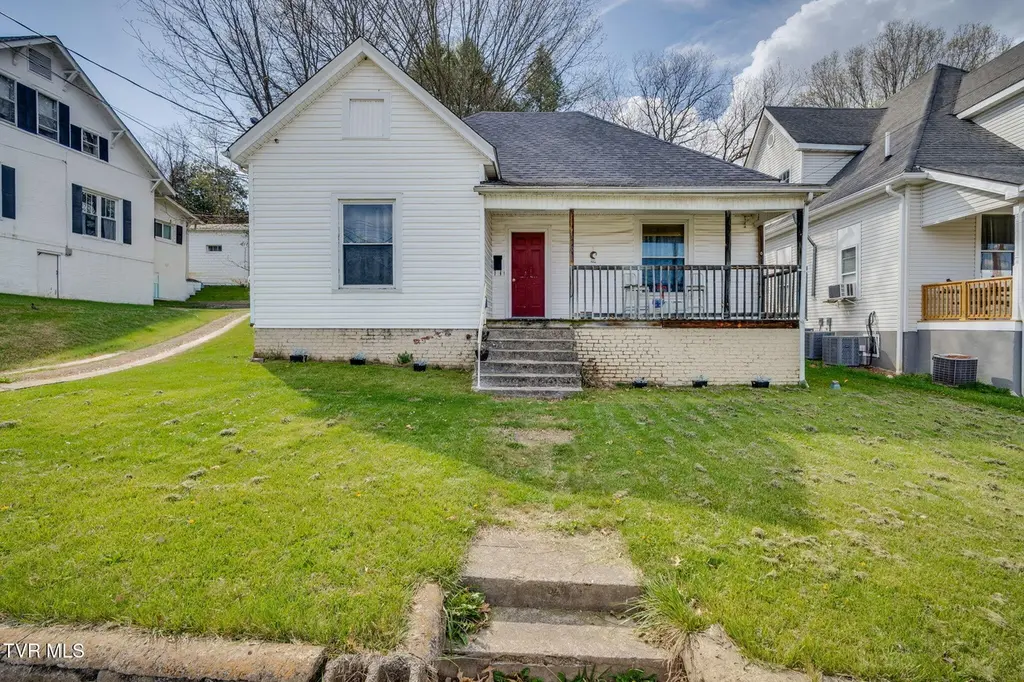
610 Holston Ave · Bristol, TN
Flood risk 1/10 · Minimal
- FEMA flood zone
- X (unshaded)
- Chance of flooding over 30 yrs
- 0.0%
- Est. flood insurance / yr
- $507 – $1,088
Fire risk 3/10 · Minor
- Est. fire insurance / yr
- $949 – $1,763
Heat risk 4/10 · Minor
- Hot days now (above 98°F)
- 7 days/yr
- Hot days in 30 yrs
- 22 days/yr
Wind risk 2/10 · Minimal
- Chance of severe wind over 30 yrs
- —
Air-quality risk 2/10 · Minimal
- Unhealthy air days now
- 1 days/yr
- Unhealthy air days in 30 yrs
- 2 days/yr
Risk factors via First Street. Map © Google.
Why this score? — see what drove the C grade
The composite is a weighted blend of 9 inputs, each scored 0–100. Each bar is that input's sub-score; the figure is the points it added to the 100-point composite (weight × sub-score).
- Cash flow +20.8/30.0
- ARV discount +13.3/15.0
- DSCR +6.6/10.0
- 1% rule +4.6/10.0
- Livability +3.7/5.0
- Schools +3.0/10.0
- Rent growth +2.5/5.0
- Condition / age +2.5/5.0
- Appreciation +0.0/10.0
$200,000
🖨 Deal sheet 📄 Offer letter ✓ Due diligence
Listing remarks
* RENTAL PROPERTY FOR SALE * Step into this turn of the century 3 bed/2 bath home which has been lovingly cared for by the renter for over 15 years. The high ceilings, hard wood floors, original wood trim and built-ins and a touch of character to home. While the 1/2 bath with added laundry space lends to the convenience of one-level living. The renter would love the opportunity to continue to lease from the new owner. Property is being sold AS IS WHERE IS. Information from CRS. Buyer & buyer's agent are solely responsible for verifying all information that is material to the decision to purchase. Including but not limited to: property condition, dimensions, systems functionality,
Key facts
- Hard wood floors
- Original wood trim
- One-level living
Tags
Property features AI
Exterior
- Parking: Gravel parking
- Utilities: Public water; Public sewer; Electricity connected; Water connected; Sewer connected
- Home design: Single-family house; One story
- Construction: Vinyl siding; Composition/shingle roof; Other foundation; Built as a residential single-family home
- Exterior features: Porch; Sloped lot; Lot dimensions approx. 63 x 120
Interior
- Kitchen: Refrigerator included
- Flooring: Hardwood; Vinyl
- Bathrooms: 1 full bathroom; 1 half bathroom
- Heating & cooling: No central heating listed; Window unit cooling
- Interior features: Laminate counters; Hardwood and vinyl floors; 7 total rooms; Dirt-floored basement
- Laundry & utility: Washer hookup; Electric dryer hookup
Neighborhood map
What this means for you Summary
Snapshot
- This is a 3-bed/1.0-bath single-family listed at $200k.
Deal economics
- At list price, monthly cash flow is $273 ($3k/yr) — positive.
- The deal already cash-flows at list — no discount required.
- To meet the 1% rule (rent ≥ 1% of price), the offer needs to be $191k (4.3% below list).
- Recommended offer: $188k (6.0% below list) — sets the bar for market timing.
- Cap rate 7.9% vs local median 3.8% in Bristol — top-decile yield for the area; either an underpriced asset or a hidden risk that comps aren't pricing in. Stress-test before assuming the spread holds.
Location & tenants
- Location reads 73/100 on livability (#24 in TN) — a middle-class / working-renter tenant base. Strengths: cost of living A+, housing A+, health & safety A+; Watch: crime D+, commute F, employment F.
- Bristol (urban): math 37% / reading 35% proficiency, ranked #29 of 139 in TN (top 21%) — families likely to look elsewhere, expect single-tenant / working-renter base with shorter leases.
- Zoned schools: Anderson Elementary (math 22% / reading 27%, grade F, #546 of 952 statewide, top 61%, 308 students, 0% FRL); Tennessee High School (math 20% / reading 41%, grade F, #75 of 332 statewide, top 24%, 1,154 students, 0% FRL) — zoned schools average 0% FRL vs 46% district-wide (46 pts lower); this property's tenant base skews higher-income than the district average.
- Market conditions: 253 active listings in the ZIP; 8 comparable units currently listed for rent nearby; rentals leasing fast (median 13d on market — plan ~1-2 weeks tenant-placement turnaround); 453 units permitted in Sullivan County in 2024 (6 in 5+ unit buildings).
- This rent runs 41% of the median local income ($56k/yr) — at the standard rent-burdened threshold; future hikes will face affordability resistance.
Forward outlook
- Local home prices are declining (-3.0%/yr); year-one equity from $1k of loan paydown is wiped out by about $6k of value loss. Plan a longer hold.
- Sullivan County population projected to shrink 5% by 2050 — rents likely to lag national; underwrite the cash flow, not the appreciation.
Negotiation context
- It's been on market 78 days — a 6% lower offer ($188k) is reasonable based on typical stale-listing flexibility.
Risks & watch-outs
- Watch-outs: built in 1901 — expect roof / HVAC / electrical / plumbing capex.
Questions for the listing agent
- It's been on market 78 days. Have you received any prior offers? Is the seller open to a 6% concession, seller financing, or rate buy-down credit?
- Built in 1901 — when were the roof, HVAC, electrical panel, plumbing, and water heater last replaced?
- Why hasn't it sold? Are there any deal-killer items the seller is aware of (foundation, flood, title, zoning, code violations)?
- Is there a deadline driving the sale (1031 exchange, divorce, estate, relocation)? That informs how much negotiation room exists.
- Schools are D-rated, which usually means shorter tenancies and higher turnover. Who's the typical renter profile here, and what's been the actual vacancy rate?
- Crime grade is D in this area — have there been break-ins, vandalism, or insurance claims at this property in the last 3 years? What carrier currently insures it and at what premium?
- What's the average days-on-market for RENTAL listings here right now (not sales)? A rising rental-DOM trend means longer vacancies and softer asking-rent achievability than the comps imply.
- What's the recent tenant-quality profile in this submarket — average credit score on applications, eviction rate, late-payment / NSF rate, and stable-employment percentage? A property-management company in the area should have these aggregated.
- How much new for-sale + rental construction is in the pipeline within 1–3 miles? Heavy new supply typically softens prices + rents 12–24 months out; constrained supply supports both.
Investment metrics
- 1% rule
- 0.96% ✗
- Cap rate
- 7.93%
- Cash-on-cash
- 5.85%
- DSCR
- 1.26
- GRM
- 8.7
CMA / ARV
- ARV (on-the-fly)
- $229,806
- Comps found
- 12
Show comp detail 12 sales within ~0.75 mi
| Address | Dist | Beds/Ba | Sqft | Sold | Price | $/sf | Match |
|---|---|---|---|---|---|---|---|
| 855 Marion Ave | 0.40mi | 3/2.0 | 1,513 (+1%) | 2mo | $280,000 | $185 | 74 |
| 1107 Holston Ave | 0.33mi | 2/2.0 (-1) | 1,525 (+2%) | 2mo | $285,000 | $187 | 71 |
| 616 6th St | 0.21mi | 4/1.0 (+1) | 1,620 (+8%) | 10mo | $269,000 | $166 | 64 |
| 909 Wilson Ave | 0.15mi | 2/1.0 (-1) | 1,328 (-12%) | 7mo | $90,000 | $68 | 63 |
| 1116 Shelby St | 0.54mi | 3/1.5 | 1,490 (-1%) | 10mo | $70,000 | $47 | 63 |
| 1112 Cedar St | 0.60mi | 3/1.0 | 1,440 (-4%) | 9mo | $140,000 | $97 | 58 |
| 1133 Hill St | 0.44mi | 4/2.0 (+1) | 1,582 (+5%) | 10mo | $191,500 | $121 | 53 |
| 1324 Holly Ct | 0.63mi | 2/2.0 (-1) | 1,472 (-2%) | 9mo | $225,000 | $153 | 51 |
| 1309 Indian Hills Dr | 0.59mi | 3/2.0 | 1,624 (+8%) | 6mo | $280,000 | $172 | 50 |
| 1401 Holston Dr | 0.71mi | 3/1.0 | 1,300 (-13%) | 2mo | $160,000 | $123 | 43 |
| 908 Columbia Rd | 0.60mi | 3/1.0 | 1,308 (-13%) | 10mo | $198,900 | $152 | 42 |
| 1412 Anderson St | 0.72mi | 2/2.0 (-1) | 1,382 (-8%) | 2mo | $235,000 | $170 | 42 |
Match score weights: distance 35% · size 25% · config 20% · recency 20%. Top-matched comps best support the ARV.
Projected returns pro-forma
-3.0% appreciation · 3.0% rent growth · sell at horizon
- IRR
- -7.3%
- Equity multiple
- 0.73×
- Total profit
- $-15,082
- Equity at exit
- $29,821
- IRR
- 2.3%
- Equity multiple
- 1.16×
- Total profit
- $9,014
- Equity at exit
- $17,292
Cash invested: $56,000 (down + closing). Projections, not guarantees.
Landlord ↔ Tenant lean methodology
- Overall (STATE)
- 87 Strongly Landlord-Friendly
- State Tennessee
- 87 Strongly Landlord-Friendly · R+13
- County
- — inherits STATE
- City
- — inherits STATE
ZIP-level market 37620
- Active inventory
- 253
- Price-to-rent
- 8.7×
Monthly cashflow live
- Estimated rent
- $1,914 high interval (Pro) →
- Mortgage (P&I)
- −$1,049
- Tax from tax record
- −$107 /mo · $1,286/yr
- Insurance
- −$83
- HOA
- −$0
- Vacancy / Maint / Mgmt
- −$402
- Net cashflow
- $273
Break-even live
UW: 25.0% down · 7.5% · 30yr · 1.5% tax · 5.0% vac · 8.0% maint · 8.0% mgmt
Financing live
Cash to close
- Down payment
- $50,000
- Closing costs
- $6,000
- Reserves months
- —
- Total cash needed
- —
Loan-product check · same deal, 3 products live
Conventional
25% down · 7.5% · 30yr
- Down + closing
- —
- Monthly P&I
- —
- Monthly cashflow
- —
- DSCR
- —
- Eligible?
- —
Personal DTI + credit; lowest rate.
DSCR
20% down · 8.5% · 30yr
- Down + closing
- —
- Monthly P&I
- —
- Monthly cashflow
- —
- DSCR
- —
- Eligible?
- —
No personal income docs; deal must DSCR.
Hard money
10% down · 12.0% · 12mo
- Down + closing
- —
- Monthly P&I
- —
- Monthly cashflow
- —
- DSCR
- —
- Eligible?
- —
Short-term bridge; refi at stabilization.
Rent comps 8 comps
| Address | Beds | Baths | Sqft | Rent | $/sqft | DOM | Units | Dist |
|---|---|---|---|---|---|---|---|---|
| 712 Haynes St Bristol, TN | 3.0 | 2.0 | 2228 | $2,100 | $0.94 | 13d | 1 | 0.13mi |
| 1718 Clifton Rd Bristol, TN | 3.0 | 1.5 | 1672 | $1,900 | $1.14 | 43d | 1 | 0.76mi |
| 1216 Norway St Unit 102 Bristol, VA | 2.0 | 1.0 | 1215 | $1,600 | $1.32 | 13d | 1 | 0.77mi |
| 1216 Norway St Unit 101 Bristol, VA | 4.0 | 2.0 | 1615 | $2,100 | $1.30 | 13d | 1 | 0.77mi |
| 1405 Newton St Bristol, VA | 3.0 | 1.0 | 1200 | $1,600 | $1.33 | 13d | 1 | 0.83mi |
| 924 Maryland Ave Unit F Bristol, TN | 2.0 | 2.0 | 1780 | $2,000 | $1.12 | 13d | 1 | 1.10mi |
| 1308 Columbia Rd Bristol, TN | 3.0 | 1.0 | 1198 | $1,375 | $1.15 | 21d | 1 | 1.14mi |
| 279 Reservoir St Bristol, VA | 3.0 | 1.5 | 1300 | $1,600 | $1.23 | 13d | 1 | 1.34mi |
Listing history 17 events
-
2026-06-19days on market $200,000 Active 78 DOM
-
2026-06-18days on market $200,000 Active 77 DOM
-
2026-06-17days on market $200,000 Active 76 DOM
-
2026-06-16days on market $200,000 Active 75 DOM
-
2026-06-15days on market $200,000 Active 74 DOM
-
2026-06-14days on market $200,000 Active 72 DOM
-
2026-06-13days on market $200,000 Active 71 DOM
-
2026-06-10days on market $200,000 Active 69 DOM
-
2026-06-09days on market $200,000 Active 68 DOM
-
2026-06-08days on market $200,000 Active 67 DOM
-
2026-06-07days on market $200,000 Active 66 DOM
-
2026-06-03days on market $200,000 Active 62 DOM
-
2026-06-02days on market $200,000 Active 61 DOM
-
2026-06-01days on market $200,000 Active 60 DOM
-
2026-05-31days on market $200,000 Active 59 DOM
-
2026-05-30days on market $200,000 Active 58 DOM
-
2026-04-02$200,000 Active
ⓘ Source: listings_history table (triggers on properties + properties_extension) + one-shot
backfill from property_details.listing_events for pre-trigger history.
Tax reassessment forecast TN · Resets to sale price
- Current annual tax
- $1,286 · $107/mo
- Projected year-2 tax
- $1,420 · $118/mo
- Expected delta
- +$134/yr (+$11/mo · 10.4%)
ⓘ Screening estimate from a state-policy table — verify with the county assessor before closing.
Climate risk First Street
- Flood 1/10 Low FEMA zone X (unshaded) · 0% chance over 30 yrs
- Wildfire 3/10 Moderate
- Heat 4/10 Moderate 7 d/yr ≥98°F today · 22 d/yr by 30 yrs out
- Wind 2/10 Low
- Air quality 2/10 Low 1 unhealthy d/yr today · 2 by 30 yrs out
Nearby sold comps map
Loading sold comps map…
Walkable amenities ~0.75 mi
Loading nearby amenities…
Taxation est. · year 1
- Rental income
- $22,971
- − Mortgage interest
- −$11,203
- − Property taxes
- −$1,286
- − Insurance
- −$1,000
- − Repairs & maintenance
- −$1,838
- − Management
- −$1,838
- − Depreciation
- −$5,818
- Taxable loss
- −$11
- Est. tax savings @ 24.0%
- +$3
- After-tax cash flow
- $3,278/yr
For passive investors: Depreciation is non-cash, so a rental often shows a tax loss while cash-flowing — sheltering income. Rental losses are passive: they offset passive income freely, and up to $25,000/yr can offset ordinary (W-2) income if you actively participate and your MAGI is under $100k (phasing out to $0 by $150k); unused losses carry forward. On sale, claimed depreciation is recaptured at up to 25%, and gains may owe capital-gains tax (a 1031 exchange can defer both). Figures are a year-1 estimate at your 24.0% rate — not tax advice; consult a CPA.
Schools (NCES district)
- District
- Bristol
- NCES district ID
- 4700360
- Math proficiency
- 37% ▼ -7.00%
- Reading proficiency
- 35% ▼ -8.00%
- Median HH income
- $37,018
- Composite
- 29.95/100
- National rank
- #6376
- State rank
- #29 of 139 in TN
Livability — Bristol
- Score
- 73/100
- State rank
- #24
- US rank
- #5413
Category grades
Schools grade is shown separately in the Schools card above.
Census & demographics
- Census place
- Bristol, TN
- County
- Sullivan County · 121,987 people
- City population
- 38,494
- Metro
- Kingsport-Bristol, TN-VA
- Population (ZIP)
- 38,494
- Household income
- $56,128
- Rent vs Own
- Severe rent burden
- 724.0
Population outlook (Sullivan County) Hauer SSP2
- Today (2025)
- 157,030 people
- By 2030
- 156,415 · -0.4%
- By 2040
- 153,778 · -2.1%
- By 2050
- 149,018 · -5.1%
- By 2075
- 138,068 · -12.1%
- By 2100
- 119,927 · -23.6%
Race, ethnicity, and origin ACS 2023
- Neighborhood character
- Predominantly White (91%)
- Race & ethnicity
- White 91% Two or more races 5% Hispanic / Latino 3% Black 2%
- Common ancestry
- Serbian 3% Slovak 3% Italian 1%
- Foreign-born
- 2% · Canada
- Languages at home
- 97% English-only · Spanish 2%
Political lean MEDSL · Sullivan
- 2024 margin
- Solid R (+55.0) · D 22.0% · R 77.0% · Other 1.0%
- 2008→2024 swing
- -13.6pp toward R · 2008: -41.3pp · 2024: -55.0pp
- All cycles
- 2024: R+55.0 2020: R+51.9 2016: R+56.2 2012: R+47.2 2008: R+41.3
Not yet ingested
- Civics
- —
Market trends
- HPI YoY
- ▼ -294.12%
- Current HPI
- 263.38
- Rent YoY
- —
- Metro
- Kingsport-Bristol, TN-VA
- State GDP YoY
- ▲ 2.78%
- F500 in state
- 22
Industry mix (Fortune 500 HQ in TN)
| Industry | F500 HQs | Revenue |
|---|---|---|
| Healthcare | 3 | $91B |
|
||
| Retail | 3 | $72B |
|
||
| Transportation / Logistics | 1 | $88B |
|
||
| Paper / Packaging | 1 | $19B |
|
||
| Insurance | 1 | $13B |
|
||
| Energy | 1 | $12B |
|
||
Price history
1 event — show timeline
- 2026-04-02 Listed $200,000 TVRMLS
Property tax history
+7.7%/yrLatest (2025): $1,286 · +37.8% YoY. Source: county tax records.
Cash-flow waterfall
monthlySold comps — $/sqft
last 12 mo · ≤1 miLoading sold comps…