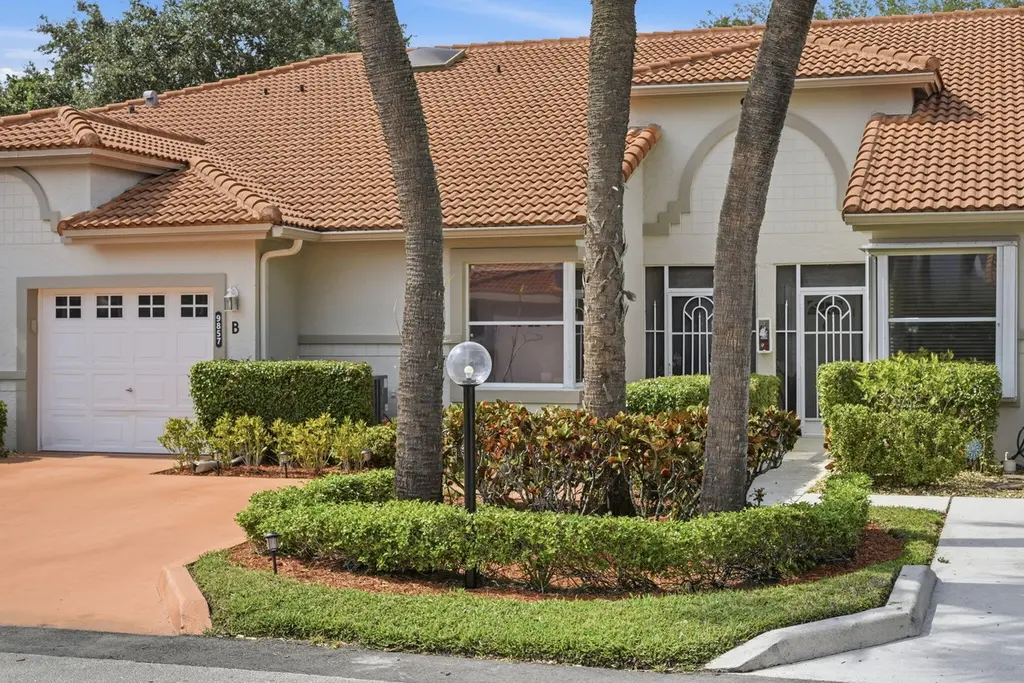
9857 Summerbrook Ter Unit B · Golf, FL
Flood risk 1/10 · Minimal
- FEMA flood zone
- X (unshaded)
- Chance of flooding over 30 yrs
- 0.0%
- Est. flood insurance / yr
- $507 – $1,088
Fire risk 1/10 · Minimal
- Est. fire insurance / yr
- $947 – $1,759
Heat risk 9/10 · Severe
- Hot days now (above 106°F)
- 7 days/yr
- Hot days in 30 yrs
- 24 days/yr
Wind risk 10/10 · Severe
- Chance of severe wind over 30 yrs
- 99.0%
Air-quality risk 2/10 · Minimal
- Unhealthy air days now
- 0 days/yr
- Unhealthy air days in 30 yrs
- 2 days/yr
Risk factors via First Street. Map © Google.
Why this score? — see what drove the D grade
The composite is a weighted blend of 9 inputs, each scored 0–100. Each bar is that input's sub-score; the figure is the points it added to the 100-point composite (weight × sub-score).
- ARV discount +7.5/15.0
- Cash flow +7.4/30.0
- 1% rule +5.9/10.0
- Appreciation +4.9/10.0
- Schools +4.3/10.0
- Livability +3.2/5.0
- Rent growth +2.8/5.0
- Condition / age +2.5/5.0
- DSCR +1.6/10.0
$299,999
🖨 Deal sheet (PDF) 📄 Offer letter ✓ Due diligence
Listing remarks MLS
Come see this lovely 2 bedroom 2 bathroom villa located in in the vibrant 55+ community of Palm Isles - just a very short walk to the satellite pool! This well maintained home features an open floorplan with living areas flowing all the way through the home to the quaint outdoor patio. The kitchen features newer stainless steel appliances and there's an abundance of natural light provided by the skylights. The master bathroom features dual sinks, a standup shower and large roman tub. The laundry room is off the kitchen leading into the garage. Water heater replaced this year and AC replaced in 2014. This home is not to be missed. Palm Isles boasts multiple tennis courts, pickleball courts, pools, an onsite cafe, a 54k sqft clubhouse, theatre. With plenty of clubs and activities to enjoy!
Key facts
- Garage
- Community pool
- Built 1993
Property features AI
Finance
- Financial info: Pets allowed with possible limits and restrictions
- HOA & community: Homeowners association: Palm Isles 1; Monthly HOA fee of $932; HOA covers cable TV, insurance, grounds maintenance, security, sewer, trash, water, common areas, and common real estate tax; Community amenities include clubhouse, fitness center, indoor pool, pool, spa/hot tub, sauna, tennis courts, pickleball and shuffleboard courts, bocce ball, billiard room, library, cafe/restaurant, jogging path, sidewalks, and internet included; Senior community
Exterior
- Parking: Detached garage; Attached garage; Driveway; 1 covered parking space (1 garage space total)
- Security: Gated community with guard; Security system; Smoke detectors
- Utilities: Public water; Public sewer; Three-phase electric; Cable available
- Home design: Villa; One story; Resale condition; North-facing
- Construction: Stucco and CBS construction; Tile roof; Slab foundation; Built as a villa
- Exterior features: Open patio; Patio; Landscaped lot; Not waterfront
Interior
- Kitchen: Dishwasher; Electric range; Microwave; Refrigerator; Garbage disposal; Electric water heater
- Bedrooms: 2 bedrooms on the main level
- Flooring: Ceramic tile; Laminate; Tile; Wood
- Bathrooms: 2 full bathrooms on the main level
- Heating & cooling: Central electric heating; Central air conditioning; Ceiling fans
- Interior features: High ceilings; Walk-in closets; Split bedroom layout; Roman tub; Blinds and plantation shutters; Skylights
- Laundry & utility: Laundry inside
Neighborhood map
What this means for you Summary
Snapshot
- This is a 2-bed/2.0-bath condo listed at $300k.
Deal economics
- At list price, monthly cash flow is $-381 ($-5k/yr) — negative.
- To cash-flow at today's rent, offer at most $233k (22.4% below list).
- Meets the 1% rule at list price ($3k rent vs $300k).
- Recommended offer: $233k (22.4% below list) — sets the bar for cash-flow.
Location & tenants
- Location reads 63/100 on livability (#703 in FL) — a middle-class / working-renter tenant base. Strengths: crime A+, employment A+, housing A+; Watch: amenities F, commute F, cost of living F.
- Palm Beach (suburban): math 46% / reading 53% proficiency, ranked #34 of 73 in FL (top 47%) — families likely to look elsewhere, expect single-tenant / working-renter base with shorter leases.
- Zoned schools: Crystal Lakes Elementary School (math 55% / reading 64%, grade B-, #690 of 2,144 statewide, top 34%, 788 students, 37% FRL); Park Vista Community High School (math 43% / reading 64%, grade C-, #146 of 667 statewide, top 22%, 3,191 students, 28% FRL) — zoned schools average 33% FRL vs 52% district-wide (19 pts lower); this property's tenant base skews higher-income than the district average.
- Market conditions: Rents rising (+1.3%/yr); 489 active listings in the ZIP; 34 comparable units currently listed for rent nearby; rentals at typical pace (median 24d on market — plan ~3-4 weeks tenant-placement turnaround); solid renter incomes; 3,974 units permitted in Palm Beach County in 2024 (1,012 in 5+ unit buildings).
- At $3,264/mo this rent would consume 49% of the median local household income ($81k/yr) (locally 902% of renters already pay >50% of income on rent) — very limited rent-growth headroom before tenants either downsize or default.
Forward outlook
- In year one you build about $1k of equity ($2k loan paydown + $-725 appreciation (-0.2% local appreciation)).
- Palm Beach County population projected at +30% by 2050 — long-run rental-demand tailwind backs the buy-and-hold thesis.
Negotiation context
- It's been on market 23 days — a 2% lower offer ($295k) is reasonable based on typical stale-listing flexibility.
- 3 sale attempts since 9y ago with the ask held roughly flat each time — persistent listings suggest the price (not the market) is what's stuck; bring a comps-based counter.
Risks & watch-outs
- Watch-outs: HOA is 29% of rent.
- Climate carrying-cost: severe wind risk, 99% chance of damaging wind over 30y; extreme-heat days projected 7→24/yr by 2055 (HVAC capex compounding) — expect insurance premiums to compound above CPI over the hold.
Questions for the listing agent
- What do current leases actually rent for vs. the listed asking? Can we see a recent rent roll and the last 12 months of T-12 income?
- What does the HOA fee cover, when was the last increase, and are there any pending special assessments or reserve-fund shortfalls?
- Any open or pending special assessments — roof, HVAC, plumbing, elevator, façade? What's the per-unit balance and payoff schedule, and is the seller paying it off at close or rolling it to the buyer?
- Is there a deadline driving the sale (1031 exchange, divorce, estate, relocation)? That informs how much negotiation room exists.
- The area grade is low — what's the realistic commute time and amenity access for the typical tenant pool here? Any planned neighborhood developments (good or bad) we should know about?
- What's the average days-on-market for RENTAL listings here right now (not sales)? A rising rental-DOM trend means longer vacancies and softer asking-rent achievability than the comps imply.
- What's the recent tenant-quality profile in this submarket — average credit score on applications, eviction rate, late-payment / NSF rate, and stable-employment percentage? A property-management company in the area should have these aggregated.
- How much new apartment / multifamily construction is in the pipeline within 1–3 miles? Heavy new supply (>2% of stock underway) typically softens rents 12–24 months out; light construction supports rent growth.
Investment metrics
- 1% rule
- 1.09% ✓
- Cap rate
- 4.77%
- Cash-on-cash
- -5.44%
- DSCR
- 0.76
- GRM
- 7.7
CMA / ARV
No comps found within radius.
Projected returns pro-forma
-0.24% appreciation · 1.28% rent growth · sell at horizon
- IRR
- -10.9%
- Equity multiple
- 0.51×
- Total profit
- $-41,385
- Equity at exit
- $83,502
- IRR
- -6.3%
- Equity multiple
- 0.39×
- Total profit
- $-51,308
- Equity at exit
- $97,538
Cash invested: $84,000 (down + closing). Projections, not guarantees.
Landlord ↔ Tenant lean methodology
- Overall (STATE)
- 87 Strongly Landlord-Friendly
- State Florida
- 87 Strongly Landlord-Friendly · R+3
- County
- — inherits STATE
- City
- — inherits STATE
ZIP-level market 33437
- Home prices YoY
- -0.1%
- Rents YoY
- 1.3%
- Active inventory
- 489
- Price-to-rent
- 7.7×
Monthly cashflow live
- Estimated rent
- $3,264 high interval (Pro) →
- Mortgage (P&I)
- −$1,573
- Tax from tax record
- −$329 /mo · $3,949/yr
- Insurance
- −$125
- HOA
- −$932
- Vacancy / Maint / Mgmt
- −$685
- Net cashflow
- $-381
Break-even live
Sensitivity live
| Price | -10% $-211 | -5% $-296 | +0% $-381 | +5% $-466 | +10% $-551 |
|---|---|---|---|---|---|
| Rent | -10% $-639 | -5% $-510 | +0% $-381 | +5% $-252 | +10% $-123 |
| Rate | -1.0pp $-230 | -0.5pp $-305 | base $-381 | +0.5pp $-459 | +1.0pp $-538 |
UW: 25.0% down · 7.5% · 30yr · 1.5% tax · 5.0% vac · 8.0% maint · 8.0% mgmt
Financing live
Cash to close
- Down payment
- $75,000
- Closing costs
- $9,000
- Reserves months
- —
- Total cash needed
- —
Loan-product check · same deal, 3 products live
Conventional
25% down · 7.5% · 30yr
- Down + closing
- —
- Monthly P&I
- —
- Monthly cashflow
- —
- DSCR
- —
- Eligible?
- —
Personal DTI + credit; lowest rate.
DSCR
20% down · 8.5% · 30yr
- Down + closing
- —
- Monthly P&I
- —
- Monthly cashflow
- —
- DSCR
- —
- Eligible?
- —
No personal income docs; deal must DSCR.
Hard money
10% down · 12.0% · 12mo
- Down + closing
- —
- Monthly P&I
- —
- Monthly cashflow
- —
- DSCR
- —
- Eligible?
- —
Short-term bridge; refi at stabilization.
Rent comps 34 comps
| Address | Beds | Baths | Sqft | Rent | $/sqft | DOM | Units | Dist |
|---|---|---|---|---|---|---|---|---|
| 9650 Harbour Lake Cir Boynton Beach, FL | 3.0 | 2.0 | 1937 | $2,975 | $1.54 | 26d | 1 | 0.29mi |
| 7891 Sailing Shores Ter Boynton Beach, FL | 3.0 | 2.0 | 2011 | $3,400 | $1.69 | 18d | 1 | 0.38mi |
| 7891 Sailing Shores Ter Unit 7891 Boynton Beach, FL | 3.0 | 2.0 | 2011 | $3,000 | $1.49 | 9d | 1 | 0.38mi |
| 10206 Stonehenge Cir Boynton Beach, FL | 1.0–3.0 | 1.0–2.0 | 1054 | $2,280 | $2.16 | 1d | 12 | 0.45mi |
| 7192 Summer Tree Dr Boynton Beach, FL | 2.0 | 2.0 | 1722 | $3,000 | $1.74 | 26d | 1 | 0.63mi |
| 7275 Summer Tree Dr Boynton Beach, FL | 2.0 | 2.0 | 1722 | $4,300 | $2.50 | 26d | 1 | 0.69mi |
| 9926 Watermill Cir Unit F Boynton Beach, FL | 3.0 | 2.0 | 1471 | $2,400 | $1.63 | 26d | 1 | 0.84mi |
| 10390 Utopia Cir E Unit 10390 Boynton Beach, FL | 3.0 | 2.0 | 1845 | $4,200 | $2.28 | 26d | 1 | 0.86mi |
| 10390 Utopia Cir E Unit E Boynton Beach, FL | 3.0 | 2.0 | 1845 | $4,200 | $2.28 | 4d | 1 | 0.86mi |
| 9336 Water Course Way Boynton Beach, FL | 3.0 | 2.0 | 1779 | $3,600 | $2.02 | 23d | 1 | 0.87mi |
| 9336 Water Course Way Boynton Beach, FL | 3.0 | 2.0 | 1779 | $3,600 | $2.02 | 26d | 1 | 0.87mi |
| 7577 Caprio Dr Boynton Beach, FL | 3.0 | 2.0 | 1884 | $3,200 | $1.70 | 15d | 1 | 0.92mi |
| 7577 Caprio Dr Boynton Beach, FL | 3.0 | 2.0 | 1884 | $3,200 | $1.70 | 4d | 1 | 0.92mi |
| 6396 Park Lake Cir Boynton Beach, FL | 3.0 | 2.5 | 1422 | $2,950 | $2.07 | 16d | 1 | 0.93mi |
| 7933 Venture Center Way Boynton Beach, FL | 1.0–3.0 | 1.0–2.0 | 1120 | $2,474 | $2.21 | 1d | 17 | 0.95mi |
| 6165 Country Fair Cir Boynton Beach, FL | 3.0 | 2.5 | 1656 | $3,200 | $1.93 | 26d | 1 | 1.02mi |
| 8884 Shoal Creek Ln Boynton Beach, FL | 3.0 | 2.0 | 1936 | $4,750 | $2.45 | 1d | 1 | 1.07mi |
| 8884 Shoal Creek Ln Boynton Beach, FL | 3.0 | 2.0 | 1936 | $5,000 | $2.58 | 12d | 1 | 1.07mi |
| 8884 Shoal Creek Ln Boynton Beach, FL | 3.0 | 2.0 | 1936 | $4,900 | $2.53 | 26d | 1 | 1.07mi |
| 6037 Rossmoor Lakes Ct Boynton Beach, FL | 3.0 | 2.0 | 1617 | $4,700 | $2.91 | 26d | 1 | 1.12mi |
| 5895 Autumn Lake Ln Unit A Boynton Beach, FL | 3.0 | 2.0 | 1469 | $2,600 | $1.77 | 26d | 1 | 1.19mi |
| 7832 Rockford Rd Boynton Beach, FL | 3.0 | 2.0 | 1598 | $3,800 | $2.38 | 23d | 1 | 1.22mi |
| 7725 Rockford Rd Boynton Beach, FL | 3.0 | 2.5 | 2249 | $10,000 | $4.45 | 4d | 1 | 1.29mi |
| 6365 Lansdowne Cir Boynton Beach, FL | 3.0 | 2.0 | 1769 | $3,200 | $1.81 | 4d | 1 | 1.31mi |
| 6731 Southport Dr Boynton Beach, FL | 3.0 | 2.0 | 1727 | $3,600 | $2.08 | 26d | 1 | 1.39mi |
| 9565 El Clair Ranch Rd Boynton Beach, FL | 3.0 | 2.0 | 1867 | $3,500 | $1.87 | 22d | 1 | 1.41mi |
| 9565 El Clair Ranch Rd Boynton Beach, FL | 3.0 | 2.0 | 1867 | $3,500 | $1.87 | 9d | 1 | 1.41mi |
| 7936 Rockford Rd Boynton Beach, FL | 3.0 | 2.0 | 1871 | $9,000 | $4.81 | 23d | 1 | 1.42mi |
| 6446 Aspen Glen Cir Boynton Beach, FL | 3.0 | 2.0 | 1800 | $3,800 | $2.11 | 22d | 1 | 1.45mi |
| 11177 Aspen Glen Dr Boynton Beach, FL | 3.0 | 2.0 | 1884 | $3,000 | $1.59 | 26d | 1 | 1.45mi |
| 6446 Aspen Glen Cir Unit 6446 Boynton Beach, FL | 3.0 | 2.0 | 1800 | $4,000 | $2.22 | 26d | 1 | 1.45mi |
| 10492 Boynton Place Cir Boynton Beach, FL | 1.0–3.0 | 1.0–2.0 | 1017 | $2,311 | $2.27 | 1d | 19 | 1.45mi |
| 7975 Rockford Rd Boynton Beach, FL | 2.0 | 2.0 | 1720 | $3,700 | $2.15 | 26d | 1 | 1.47mi |
| 10596 Sunset Isles Ct Boynton Beach, FL | 3.0 | 2.0 | 1769 | $4,500 | $2.54 | 26d | 1 | 1.48mi |
HOA detail condo
- Monthly dues
- $932 · $11,184/yr
- Likely covers
- waterpool
- Assessments
- None detected in remarks — confirm with the listing agent.
Listing history 14 events
-
2026-06-21days on market $299,999 Active 23 DOM
-
2026-06-18days on market $299,999 Active 20 DOM
-
2026-06-17days on market $299,999 Active 19 DOM
-
2026-06-16days on market $299,999 Active 18 DOM
-
2026-06-15days on market $299,999 Active 17 DOM
-
2026-06-13days on market $299,999 Active 15 DOM
-
2026-06-09days on market $299,999 Active 11 DOM
-
2026-06-08days on market $299,999 Active 10 DOM
-
2026-06-07days on market $299,999 Active 9 DOM
-
2026-06-04days on market $299,999 Active 6 DOM
-
2026-06-03days on market $299,999 Active 5 DOM
-
2026-06-02days on market $299,999 Active 4 DOM
-
2026-06-01days on market $299,999 Active 3 DOM
-
2026-05-31days on market $299,999 Active 2 DOM
ⓘ Source: listings_history table (triggers on properties + properties_extension) + one-shot
backfill from property_details.listing_events for pre-trigger history.
Tax reassessment forecast FL · Resets to sale price
- Current annual tax
- $3,949 · $329/mo
- Projected year-2 tax
- $3,949 · $329/mo
- Expected delta
- $0/yr ($0/mo · 0.0%)
ⓘ Screening estimate from a state-policy table — verify with the county assessor before closing.
Climate risk First Street
- Flood 1/10 Low FEMA zone X (unshaded) · 0% chance over 30 yrs
- Wildfire 1/10 Low
- Heat 9/10 Extreme 7 d/yr ≥106°F today · 24 d/yr by 30 yrs out
- Wind 10/10 Extreme 99% chance of damaging wind over 30 yrs
- Air quality 2/10 Low 0 unhealthy d/yr today · 2 by 30 yrs out
Nearby sold comps map
Loading sold comps map…
Walkable amenities ~0.75 mi
Loading nearby amenities…
Taxation est. · year 1
- Rental income
- $39,166
- − Mortgage interest
- −$16,805
- − Property taxes
- −$3,949
- − Insurance
- −$1,500
- − Repairs & maintenance
- −$3,133
- − Management
- −$3,133
- − HOA
- −$11,184
- − Depreciation
- −$8,727
- Taxable loss
- −$9,265
- Est. tax savings @ 24.0%
- +$2,224
- After-tax cash flow
- $-2,347/yr
For passive investors: Depreciation is non-cash, so a rental often shows a tax loss while cash-flowing — sheltering income. Rental losses are passive: they offset passive income freely, and up to $25,000/yr can offset ordinary (W-2) income if you actively participate and your MAGI is under $100k (phasing out to $0 by $150k); unused losses carry forward. On sale, claimed depreciation is recaptured at up to 25%, and gains may owe capital-gains tax (a 1031 exchange can defer both). Figures are a year-1 estimate at your 24.0% rate — not tax advice; consult a CPA.
Schools (NCES district)
- District
- Palm Beach
- NCES district ID
- 1201500
- Math proficiency
- 46% ▼ -16.00%
- Reading proficiency
- 53% ▼ -4.00%
- Median HH income
- $53,943
- Composite
- 42.72/100
- National rank
- #3160
- State rank
- #34 of 73 in FL
Livability — Golf
- Score
- 63/100
- State rank
- #703
- US rank
- #14941
Category grades
Schools grade is shown separately in the Schools card above.
Census & demographics
- County
- Palm Beach County · 1,438,312 people
- City population
- 148,060
- Metro
- Miami-Fort Lauderdale-Pompano Beach, FL
- Population (ZIP)
- 37,229
- Household income
- $80,710
- Rent vs Own
- Severe rent burden
- 902.0
Population outlook (Palm Beach County) Hauer SSP2
- Today (2025)
- 1,637,487 people
- By 2030
- 1,743,255 · +6.5%
- By 2040
- 1,948,712 · +19.0%
- By 2050
- 2,132,979 · +30.3%
- By 2075
- 2,530,027 · +54.5%
- By 2100
- 2,706,979 · +65.3%
Race, ethnicity, and origin ACS 2023
- Neighborhood character
- Predominantly White (68%)
- Race & ethnicity
- White 68% Two or more races 13% Hispanic / Latino 12% Black 10% Asian 3%
- Hispanic origin (detail)
- Mexican 1% Puerto Rican 2% Cuban 1% Dominican 1%
- Common ancestry
- Scotch-Irish 8% Romanian 8% Hispanic 6%
- Foreign-born
- 18% · Canada, Jamaica, Vietnam
- Languages at home
- 78% English-only · Spanish 10% French/Haitian/Cajun 6% Other Indo-European 2%
Political lean MEDSL · Palm Beach
- 2024 margin
- Toss-up / Even · D 50.0% · R 49.2%
- 2008→2024 swing
- -22.1pp toward R · 2008: 22.9pp · 2024: 0.8pp
- All cycles
- 2024: D+0.8 2020: D+12.8 2016: D+15.3 2012: D+17.0 2008: D+22.9
Not yet ingested
- Civics
- —
Market trends
- HPI YoY
- ▼ -0.24%
- Current HPI
- 257.5891
- Rent YoY
- ▲ 1.28%
- Metro
- Miami-Fort Lauderdale-Pompano Beach, FL
- State GDP YoY
- ▲ 3.28%
- F500 in state
- 36
Industry mix (Fortune 500 HQ in FL)
| Industry | F500 HQs | Revenue |
|---|---|---|
| Industrial Technology | 2 | $29B |
|
||
| Insurance | 2 | $17B |
|
||
| Retail | 1 | $60B |
|
||
| Technology Distribution | 1 | $58B |
|
||
| Homebuilding | 1 | $35B |
|
||
| Technology Manufacturing | 1 | $35B |
|
||
Price history
+161.8% since first listed11 events — show timeline
- 2026-05-29 Listed $299,999 Beaches MLS
- 2024-02-05 Sold (Public Records) $280,000 Public Records
- 2024-01-25 Sold (MLS) $280,000 Beaches MLS
- 2023-12-13 Contingent — Beaches MLS
- 2023-10-27 Listed $295,000 Beaches MLS
- 2017-06-15 Sold (Public Records) $195,000 Public Records
- 2017-06-07 Sold (MLS) $195,000 Beaches MLS
- 2017-04-26 Contingent — Beaches MLS
- 2017-04-03 Listed $205,000 Beaches MLS
- 1998-03-06 Sold (Public Records) $120,000 Public Records
- 1993-12-21 Sold (Public Records) $114,600 Public Records
Property tax history
+6.6%/yrLatest (2025): $3,949 · +43.5% YoY. Source: county tax records.
Cash-flow waterfall
monthlySold comps — $/sqft
last 12 mo · ≤1 miLoading sold comps…