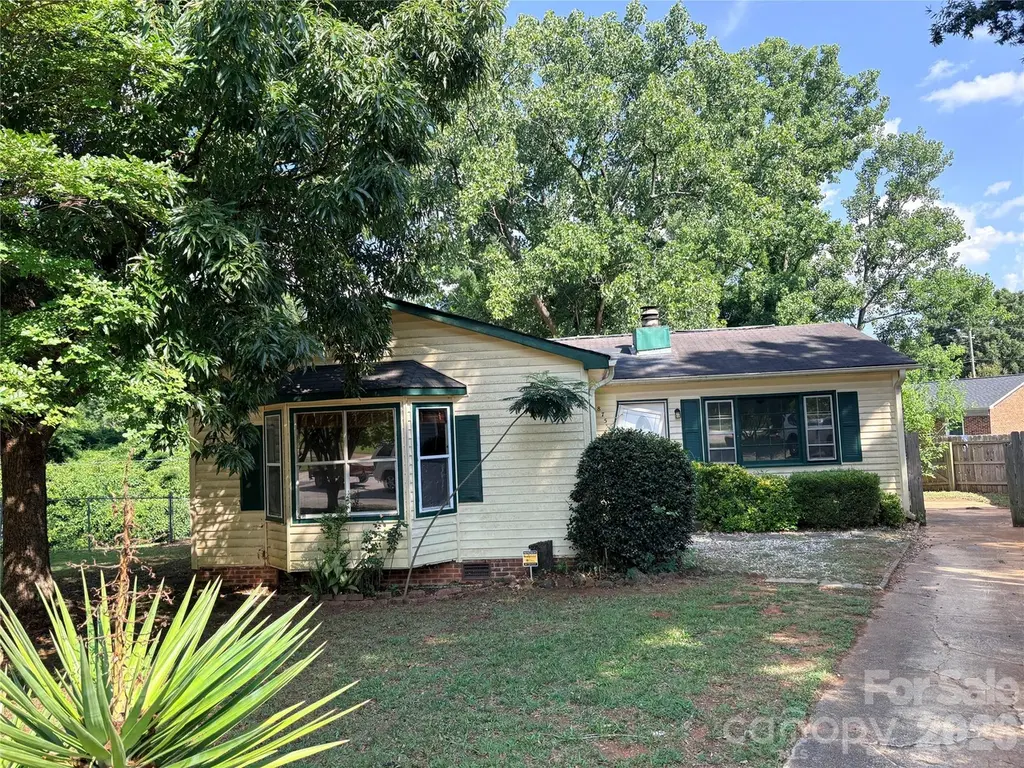
875 Rolling Green Dr · Rock Hill, SC
Flood risk 1/10 · Minimal
- FEMA flood zone
- X (unshaded)
- Chance of flooding over 30 yrs
- 0.0%
- Est. flood insurance / yr
- $507 – $1,088
Fire risk 3/10 · Minor
- Est. fire insurance / yr
- $783 – $1,453
Heat risk 6/10 · Moderate
- Hot days now (above 105°F)
- 7 days/yr
- Hot days in 30 yrs
- 16 days/yr
Wind risk 6/10 · Moderate
- Chance of severe wind over 30 yrs
- 27.0%
Air-quality risk 3/10 · Minor
- Unhealthy air days now
- 2 days/yr
- Unhealthy air days in 30 yrs
- 3 days/yr
Risk factors via First Street. Map © Google.
Why this score? — see what drove the C+ grade
The composite is a weighted blend of 9 inputs, each scored 0–100. Each bar is that input's sub-score; the figure is the points it added to the 100-point composite (weight × sub-score).
- Cash flow +22.1/30.0
- ARV discount +15.0/15.0
- DSCR +7.1/10.0
- 1% rule +5.2/10.0
- Rent growth +3.9/5.0
- Schools +3.5/10.0
- Livability +3.5/5.0
- Condition / age +2.5/5.0
- Appreciation +0.0/10.0
$171,000
🖨 Deal sheet 📄 Offer letter ✓ Due diligence
Listing remarks MLS
You will love this cute home located in a cul-de-sac! Beautiful bamboo flooring in the living room, kitchen, and dining area, plus brand new carpet in all bedrooms and the office area. Cozy up near the adorable fireplace when it's chilly outside, or enjoy the large patio when the weather is nice. This home offers 3 bedrooms and an additional space that you can use as a home office, playroom, craft space, nursery.... the choice is yours! Brand new gutters were installed this month. 875 Rolling Green is ready for you to call it home!
Key facts
- Storage building
- Flex room
- Bamboo flooring
Tags
Property features AI
Finance
- HOA & community: No HOA
Exterior
- Parking: Driveway (no main-level garage)
- Utilities: City water; Public sewer
- Home design: Single family residence (residential); One-story; Site-built construction; Facing direction not specified
- Construction: Partial brick and vinyl exterior; Crawl space foundation; Site-built
- Exterior features: Patio; Porch; Concrete and paved road access (publicly maintained)
Interior
- Kitchen: Electric range; Microwave; Refrigerator
- Bedrooms: 3 bedrooms on the main level
- Bathrooms: 1 full bathroom; 1 half bathroom
- Heating & cooling: Forced air heating (natural gas); Central air conditioning
- Interior features: 9 total rooms; Fireplace in the family room
- Laundry & utility: Electric dryer hookup; Crawl space foundation (utility access)
Neighborhood map
What this means for you Summary
Snapshot
- This is a 3-bed/1.5-bath single-family listed at $171k.
Deal economics
- At list price, monthly cash flow is $274 ($3k/yr) — positive.
- The deal already cash-flows at list — no discount required.
- Meets the 1% rule at list price ($2k rent vs $171k).
- Cap rate 8.2% vs local median 3.4% in Rock Hill — top-decile yield for the area; either an underpriced asset or a hidden risk that comps aren't pricing in. Stress-test before assuming the spread holds.
Location & tenants
- Location reads 70/100 on livability (#62 in SC) — a middle-class / working-renter tenant base. Strengths: cost of living A+, housing A+, health & safety A+; Watch: employment D+, crime D-, amenities D-.
- York 03 (urban): math 36% / reading 47% proficiency, ranked #32 of 80 in SC (top 40%) — families likely to look elsewhere, expect single-tenant / working-renter base with shorter leases.
- Zoned schools: Mount Gallant Elementary (math 46% / reading 49%, grade D, #199 of 597 statewide, top 35%, 516 students, 23% FRL); Northwestern High (math 35% / reading 84%, grade C+, #110 of 196 statewide, top 58%, 1,774 students, 52% FRL).
- Zoned-school proficiency averages 54% at this address vs 42% district-wide (+12 pts) — the actual schools serving this property are materially stronger than the York 03 average implies; a family-tenant draw the district grade alone would hide.
- Market conditions: Rents rising fast (+5.5%/yr); 348 active listings in the ZIP; 22 comparable units currently listed for rent nearby; rentals at typical pace (median 22d on market — plan ~3-4 weeks tenant-placement turnaround); 2,550 units permitted in York County in 2024 (350 in 5+ unit buildings).
- This rent runs 31% of the median local income ($69k/yr) — at the standard rent-burdened threshold; future hikes will face affordability resistance.
Forward outlook
- Local home prices are declining (-3.0%/yr); year-one equity from $1k of loan paydown is wiped out by about $5k of value loss. Plan a longer hold.
- York County population projected at +44% by 2050 — long-run rental-demand tailwind backs the buy-and-hold thesis.
- At projected returns (-3.0% appreciation + 5.5% rent growth), your $48k cash investment doubles in ~10 years — after that, you're playing with house money.
Negotiation context
- Only 6 days on market — expect competitive offers; lowballing is unlikely to land.
- 3 sale attempts since 7y ago with the ask held roughly flat each time — persistent listings suggest the price (not the market) is what's stuck; bring a comps-based counter.
Risks & watch-outs
- Climate carrying-cost: major wind risk, 27% chance of damaging wind over 30y; extreme-heat days projected 7→16/yr by 2055 (HVAC capex compounding) — expect insurance premiums to compound above CPI over the hold.
Questions for the listing agent
- Is there a deadline driving the sale (1031 exchange, divorce, estate, relocation)? That informs how much negotiation room exists.
- Schools are D-rated, which usually means shorter tenancies and higher turnover. Who's the typical renter profile here, and what's been the actual vacancy rate?
- Crime grade is D in this area — have there been break-ins, vandalism, or insurance claims at this property in the last 3 years? What carrier currently insures it and at what premium?
- What's the average days-on-market for RENTAL listings here right now (not sales)? A rising rental-DOM trend means longer vacancies and softer asking-rent achievability than the comps imply.
- What's the recent tenant-quality profile in this submarket — average credit score on applications, eviction rate, late-payment / NSF rate, and stable-employment percentage? A property-management company in the area should have these aggregated.
- How much new for-sale + rental construction is in the pipeline within 1–3 miles? Heavy new supply typically softens prices + rents 12–24 months out; constrained supply supports both.
Investment metrics
- 1% rule
- 1.02% ✓
- Cap rate
- 8.22%
- Cash-on-cash
- 6.86%
- DSCR
- 1.31
- GRM
- 8.1
CMA / ARV
- ARV (on-the-fly)
- $300,390
- Comps found
- 12
Show comp detail 12 sales within ~0.75 mi
| Address | Dist | Beds/Ba | Sqft | Sold | Price | $/sf | Match |
|---|---|---|---|---|---|---|---|
| 838 Carey Dr | 0.46mi | 3/1.5 | 1,528 (-3%) | 8mo | $304,000 | $199 | 66 |
| 915 Finley Rd | 0.14mi | 3/1.0 | 1,385 (-12%) | 6mo | $249,000 | $180 | 66 |
| 846 Gist Rd | 0.52mi | 3/2.0 | 1,623 (+3%) | 10mo | $308,000 | $190 | 61 |
| 341 Bynum Ave | 0.42mi | 4/2.5 (+1) | 1,634 (+3%) | 8mo | $290,000 | $177 | 59 |
| 1131 Calhoun St | 0.36mi | 4/2.0 (+1) | 1,410 (-11%) | 1mo | $275,000 | $195 | 57 |
| 1139 Calhoun St | 0.37mi | 4/2.0 (+1) | 1,410 (-11%) | 1mo | $275,000 | $195 | 57 |
| 1367 Springview Ct | 0.68mi | 3/2.0 | 1,528 (-3%) | 9mo | $290,000 | $190 | 53 |
| 412 Allen St | 0.49mi | 3/2.0 | 1,424 (-10%) | 7mo | $315,000 | $221 | 53 |
| 115 Allen St | 0.64mi | 3/2.5 | 1,500 (-5%) | 6mo | $255,000 | $170 | 52 |
| 316 Scoggins St | 0.70mi | 3/2.0 | 1,473 (-7%) | 3mo | $294,900 | $200 | 52 |
| 420 Baker Street Ext | 0.70mi | 3/1.0 | 1,350 (-15%) | 8mo | $229,900 | $170 | 34 |
| 450 Gettys St | 0.65mi | 4/2.0 (+1) | 1,352 (-14%) | 8mo | $235,000 | $174 | 32 |
Match score weights: distance 35% · size 25% · config 20% · recency 20%. Top-matched comps best support the ARV.
Projected returns pro-forma
-3.0% appreciation · 5.53% rent growth · sell at horizon
- IRR
- -3.1%
- Equity multiple
- 0.88×
- Total profit
- $-5,710
- Equity at exit
- $25,497
- IRR
- 9.1%
- Equity multiple
- 1.78×
- Total profit
- $37,179
- Equity at exit
- $14,785
Cash invested: $47,880 (down + closing). Projections, not guarantees.
Landlord ↔ Tenant lean methodology
- Overall (STATE)
- 90 Strongly Landlord-Friendly
- State South Carolina
- 90 Strongly Landlord-Friendly · R+6
- County
- — inherits STATE
- City
- — inherits STATE
ZIP-level market 29730
- Rents YoY
- 5.5%
- Active inventory
- 348
- Price-to-rent
- 8.1×
Monthly cashflow live
- Estimated rent
- $1,752 high interval (Pro) →
- Mortgage (P&I)
- −$897
- Tax from tax record
- −$142 /mo · $1,704/yr
- Insurance
- −$71
- HOA
- −$0
- Vacancy / Maint / Mgmt
- −$368
- Net cashflow
- $274
Break-even live
UW: 25.0% down · 7.5% · 30yr · 1.5% tax · 5.0% vac · 8.0% maint · 8.0% mgmt
Financing live
Cash to close
- Down payment
- $42,750
- Closing costs
- $5,130
- Reserves months
- —
- Total cash needed
- —
Loan-product check · same deal, 3 products live
Conventional
25% down · 7.5% · 30yr
- Down + closing
- —
- Monthly P&I
- —
- Monthly cashflow
- —
- DSCR
- —
- Eligible?
- —
Personal DTI + credit; lowest rate.
DSCR
20% down · 8.5% · 30yr
- Down + closing
- —
- Monthly P&I
- —
- Monthly cashflow
- —
- DSCR
- —
- Eligible?
- —
No personal income docs; deal must DSCR.
Hard money
10% down · 12.0% · 12mo
- Down + closing
- —
- Monthly P&I
- —
- Monthly cashflow
- —
- DSCR
- —
- Eligible?
- —
Short-term bridge; refi at stabilization.
Rent comps 22 comps
| Address | Beds | Baths | Sqft | Rent | $/sqft | DOM | Units | Dist |
|---|---|---|---|---|---|---|---|---|
| 333 Friendship Dr Rock Hill, SC | 3.0 | 2.0 | 1158 | $1,460 | $1.26 | 21d | 1 | 0.36mi |
| 242 Cherry Rd S Rock Hill, SC | 3.0 | 1.0 | 1599 | $1,650 | $1.03 | 23d | 1 | 0.49mi |
| 1128 Westover Cir Rock Hill, SC | 3.0 | 1.0 | 1119 | $1,495 | $1.34 | 23d | 1 | 0.50mi |
| 244 Rhea St Rock Hill, SC | 2.0 | 1.0 | 1200 | $1,225 | $1.02 | 20d | 1 | 0.69mi |
| 371 Technology Center Way Rock Hill, SC | 1.0–2.0 | 1.0–2.0 | 832 | $2,155 | $2.59 | 3d | 37 | 0.75mi |
| 175 W Black St Rock Hill, SC | 1.0–2.0 | 1.0–2.0 | 1021 | $1,685 | $1.65 | 20d | 11 | 0.83mi |
| 175 W Black St Unit 304 Rock Hill, SC | 2.0 | 2.0 | 1248 | $1,685 | $1.35 | 23d | 1 | 0.83mi |
| 1247 Spring View Ct Rock Hill, SC | 3.0 | 2.0 | 1248 | $1,210 | $0.97 | 20d | 1 | 0.84mi |
| 1292 Liberty Bell Ct Rock Hill, SC | 2.0 | 2.5 | 1280 | $2,200 | $1.72 | 23d | 1 | 0.84mi |
| 1264 Liberty Bell Ct Rock Hill, SC | 3.0 | 2.5 | 1120 | $1,795 | $1.60 | 17d | 1 | 0.85mi |
| 325 Hancock Union Ln Rock Hill, SC | 3.0 | 2.5 | 1506 | $2,400 | $1.59 | 21d | 1 | 0.89mi |
| 1084 Constitution Park Blvd Rock Hill, SC | 2.0 | 2.5 | 1338 | $1,750 | $1.31 | 21d | 1 | 0.90mi |
| 1037 Constitution Park Blvd Rock Hill, SC | 2.0 | 2.5 | 1118 | $1,570 | $1.40 | 4d | 1 | 0.91mi |
| 608 Crawford Rd Rock Hill, SC | 3.0 | 2.0 | 1400 | $2,150 | $1.54 | 21d | 1 | 1.02mi |
| 1711 Wallick Ln Rock Hill, SC | 1.0–3.0 | 1.0–2.0 | 940 | $1,725 | $1.84 | 1d | 1 | 1.15mi |
| 618 Union Ave Rock Hill, SC | 2.0 | 2.0 | 1050 | $1,475 | $1.40 | 16d | 1 | 1.19mi |
| 241 Marion St Rock Hill, SC | 2.0 | 1.0 | 1580 | $1,500 | $0.95 | 4d | 1 | 1.20mi |
| 304 Oak Dr Rock Hill, SC | 2.0 | 1.0 | 1349 | $1,650 | $1.22 | 23d | 1 | 1.26mi |
| 760 Goudlock Rd Rock Hill, SC | 3.0 | 2.0 | 1740 | $2,245 | $1.29 | 23d | 1 | 1.40mi |
| 325 Walnut St Rock Hill, SC | 3.0 | 1.0 | 1602 | $1,495 | $0.93 | 21d | 1 | 1.41mi |
| 180 Glenwood Dr Unit 1612 Rock Hill, SC | 2.0 | 2.0 | 1275 | $1,450 | $1.14 | 23d | 1 | 1.46mi |
| 418 Pickens Ct Rock Hill, SC | 2.0 | 2.0 | 1060 | $1,800 | $1.70 | 23d | 1 | 1.48mi |
Listing history 6 events
-
2026-06-18days on market $171,000 Active 6 DOM
-
2026-06-17days on market $171,000 Active 5 DOM
-
2026-06-16days on market $171,000 Active 4 DOM
-
2026-06-15days on market $171,000 Active 3 DOM
-
2026-06-13remarks 350-char remark
-
2026-06-13$171,000 Active 1 DOM
ⓘ Source: listings_history table (triggers on properties + properties_extension) + one-shot
backfill from property_details.listing_events for pre-trigger history.
Tax reassessment forecast SC · Resets to sale price
- Current annual tax
- $1,704 · $142/mo
- Projected year-2 tax
- $1,704 · $142/mo
- Expected delta
- $0/yr ($0/mo · 0.0%)
ⓘ Screening estimate from a state-policy table — verify with the county assessor before closing.
Climate risk First Street
- Flood 1/10 Low FEMA zone X (unshaded) · 0% chance over 30 yrs
- Wildfire 3/10 Moderate
- Heat 6/10 Major 7 d/yr ≥105°F today · 16 d/yr by 30 yrs out
- Wind 6/10 Major 27% chance of damaging wind over 30 yrs
- Air quality 3/10 Moderate 2 unhealthy d/yr today · 3 by 30 yrs out
Nearby sold comps map
Loading sold comps map…
Walkable amenities ~0.75 mi
Loading nearby amenities…
Taxation est. · year 1
- Rental income
- $21,022
- − Mortgage interest
- −$9,579
- − Property taxes
- −$1,704
- − Insurance
- −$855
- − Repairs & maintenance
- −$1,682
- − Management
- −$1,682
- − Depreciation
- −$4,975
- Taxable income
- $546
- Est. tax owed @ 24.0%
- −$131
- After-tax cash flow
- $3,156/yr
For passive investors: Depreciation is non-cash, so a rental often shows a tax loss while cash-flowing — sheltering income. Rental losses are passive: they offset passive income freely, and up to $25,000/yr can offset ordinary (W-2) income if you actively participate and your MAGI is under $100k (phasing out to $0 by $150k); unused losses carry forward. On sale, claimed depreciation is recaptured at up to 25%, and gains may owe capital-gains tax (a 1031 exchange can defer both). Figures are a year-1 estimate at your 24.0% rate — not tax advice; consult a CPA.
Schools (NCES district)
- District
- York 03
- NCES district ID
- 4503870
- Math proficiency
- 36% ▼ -8.00%
- Reading proficiency
- 47% ▲ 3.00%
- Median HH income
- $47,570
- Composite
- 35.46/100
- National rank
- #4928
- State rank
- #32 of 80 in SC
Livability — Rock Hill
- Score
- 70/100
- State rank
- #62
- US rank
- #7573
Category grades
Schools grade is shown separately in the Schools card above.
Census & demographics
- Census place
- Rock Hill, SC
- County
- York County · 281,758 people
- City population
- 115,874
- Metro
- Charlotte-Concord-Gastonia, NC-SC
- Population (ZIP)
- 58,199
- Household income
- $68,543
- Rent vs Own
- Severe rent burden
- 1869.0
Population outlook (York County) Hauer SSP2
- Today (2025)
- 307,757 people
- By 2030
- 335,979 · +9.2%
- By 2040
- 391,378 · +27.2%
- By 2050
- 443,234 · +44.0%
- By 2075
- 557,102 · +81.0%
- By 2100
- 625,837 · +103.4%
Race, ethnicity, and origin ACS 2023
- Neighborhood character
- Diverse neighborhood (Simpson 0.59)
- Race & ethnicity
- White 51% Black 39% Hispanic / Latino 4% Two or more races 4% Native American 2% Asian 1%
- Common ancestry
- Serbian 2% Slovak 2% Lithuanian 1%
- Foreign-born
- 4% · Canada, Vietnam, China
- Languages at home
- 95% English-only · Spanish 3%
Political lean MEDSL · York
- 2024 margin
- R (+19.1) · D 39.7% · R 58.8% · Other 1.5%
- 2008→2024 swing
- -1.4pp toward R · 2008: -17.7pp · 2024: -19.1pp
- All cycles
- 2024: R+19.1 2020: R+16.5 2016: R+22.1 2012: R+20.5 2008: R+17.7
Not yet ingested
- Civics
- —
Market trends
- HPI YoY
- ▼ -285.91%
- Current HPI
- 268.2609
- Rent YoY
- ▲ 5.53%
- Metro
- Charlotte-Concord-Gastonia, NC-SC
- State GDP YoY
- ▲ 4.51%
- F500 in state
- 2
Industry mix (Fortune 500 HQ in SC)
| Industry | F500 HQs | Revenue |
|---|---|---|
| Packaging | 1 | $7B |
|
||
Price history
+42.6% since first listed8 events — show timeline
- 2026-06-11 Listed $171,000 CANOPYMLS as Distributed by MLS Grid
- 2021-10-08 Sold (Public Records) $205,000 Public Records
- 2021-10-07 Sold (MLS) $205,000 CANOPYMLS as Distributed by MLS Grid
- 2021-08-23 Pending — CANOPYMLS as Distributed by MLS Grid
- 2021-08-19 Listed $212,000 CANOPYMLS as Distributed by MLS Grid
- 2019-04-22 Sold (MLS) $128,400 CANOPYMLS as Distributed by MLS Grid
- 2019-03-10 Pending — CANOPYMLS as Distributed by MLS Grid
- 2019-03-04 Listed $119,900 CANOPYMLS as Distributed by MLS Grid
Property tax history
+6.6%/yrLatest (2025): $1,704 · +14.8% YoY. Source: county tax records.
Cash-flow waterfall
monthlySold comps — $/sqft
last 12 mo · ≤1 miLoading sold comps…