10 Jason St · Castle Rock, CO
Flood risk 1/10 · Minimal
- FEMA flood zone
- X (unshaded)
- Chance of flooding over 30 yrs
- 0.0%
- Est. flood insurance / yr
- $507 – $1,088
Fire risk 7/10 · Major
- Est. fire insurance / yr
- $939 – $1,743
Heat risk 3/10 · Minor
- Hot days now (above 89°F)
- 9 days/yr
- Hot days in 30 yrs
- 24 days/yr
Wind risk 2/10 · Minimal
- Chance of severe wind over 30 yrs
- —
Air-quality risk 1/10 · Minimal
- Unhealthy air days now
- 0 days/yr
- Unhealthy air days in 30 yrs
- 0 days/yr
Risk factors via First Street. Map © Google.
Why this score? — see what drove the B- grade
The composite is a weighted blend of 9 inputs, each scored 0–100. Each bar is that input's sub-score; the figure is the points it added to the 100-point composite (weight × sub-score).
- Cash flow +30.0/30.0
- 1% rule +10.0/10.0
- DSCR +10.0/10.0
- ARV discount +5.5/15.0
- Schools +5.1/10.0
- Livability +3.9/5.0
- Rent growth +2.6/5.0
- Condition / age +2.5/5.0
- Appreciation +0.0/10.0
$115,000
🖨 Deal sheet (PDF) 📄 Offer letter ✓ Due diligence
Listing remarks MLS
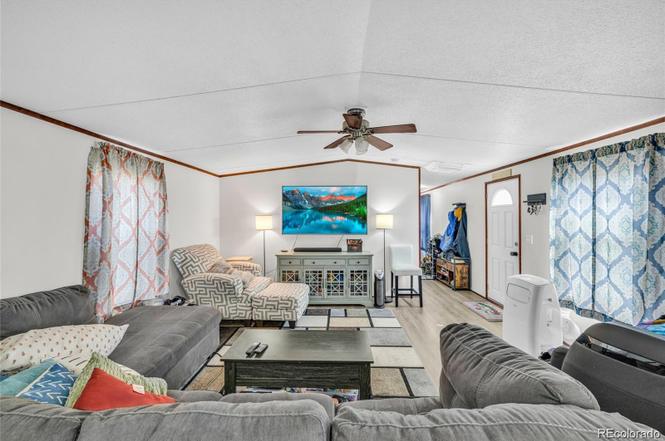
Tough to find a spacious four bedroom, two bath, manufactured home centrally located in the heart of Castle Rock. This home has new floors throughout, fresh paint in the updated kitchen, newer stainless steel dishwasher, gas range, and a new front door. A spacious primary bedroom with an en-suite full bathroom is located off the kitchen. Three additional bedrooms and a bathroom are located down the hall from the living room. Enjoy 2 off street parking spaces. Castle Park Mobile Home Park is located in the heart of Castle Rock with easy access to I-25, shopping at the Castle Rock Outlets, and ample dining options close by.
Key facts
- Plum creek trailhead
- Walkable access
- 3,000 sq ft lot
Tags
Neighborhood map
What this means for you Summary
Snapshot
- This is a 4-bed/2.0-bath manufactured listed at $115k.
Deal economics
- At list price, monthly cash flow is $2k ($22k/yr) — positive.
- The deal already cash-flows at list — no discount required.
- Meets the 1% rule at list price ($3k rent vs $115k).
- Recommended offer: $101k (12.0% below list) — sets the bar for market timing.
- Cap rate 25.6% vs local median 3.0% in Castle Rock — top-decile yield for the area; either an underpriced asset or a hidden risk that comps aren't pricing in. Stress-test before assuming the spread holds.
Location & tenants
- Location reads 78/100 on livability (#15 in CO, #2,469 nationally) — a middle-class / working-renter tenant base. Strengths: crime A+, amenities A+, employment A+; Watch: health & safety D+, commute D-, cost of living F.
- Douglas County School District No. RE-1 (suburban): math 45% / reading 62% proficiency, ranked #7 of 86 in CO (top 8%) — acceptable for families but not a draw, mixed tenant base, ~2y average lease; only 8% free/reduced lunch — higher-income household profile.
- Zoned schools: Clear Sky Elementary (math 47% / reading 52%, grade D, #207 of 966 statewide, top 24%, 675 students, 14% FRL); Castle Rock Middle School (math 30% / reading 49%, grade F, #84 of 270 statewide, top 32%, 748 students, 14% FRL); Castle View High School (math 38% / reading 67%, grade C-, #89 of 381 statewide, top 23%, 1,990 students, 0% FRL) — zoned schools at 9% FRL track the district average.
- Market conditions: Rents flat; 182 active listings in the ZIP; 8 comparable units currently listed for rent nearby; rentals at typical pace (median 14d on market — plan ~3-4 weeks tenant-placement turnaround); high-income renter base; 3,131 units permitted in Douglas County in 2024 (950 in 5+ unit buildings).
Forward outlook
- Local home prices are declining (-3.0%/yr); year-one equity from $795 of loan paydown is wiped out by about $3k of value loss. Plan a longer hold.
- Douglas County population projected at +43% by 2050 — long-run rental-demand tailwind backs the buy-and-hold thesis.
- At projected returns (-3.0% appreciation + 0.4% rent growth), your $32k cash investment doubles in ~2 years — after that, you're playing with house money.
Negotiation context
- It's been on market 161 days — a 12% lower offer ($101k) is reasonable based on typical stale-listing flexibility.
- 3 sale attempts since 5y ago; this cycle's ask has dropped $15k (12%) from the opening price — seller is motivated, your offer sets the floor, not the list.
Risks & watch-outs
- Climate carrying-cost: major wildfire risk — expect insurance premiums to compound above CPI over the hold.
Questions for the listing agent
- It's been on market 161 days. Have you received any prior offers? Is the seller open to a 12% concession, seller financing, or rate buy-down credit?
- Why hasn't it sold? Are there any deal-killer items the seller is aware of (foundation, flood, title, zoning, code violations)?
- Is there a deadline driving the sale (1031 exchange, divorce, estate, relocation)? That informs how much negotiation room exists.
- Schools are A-rated — typically a magnet for longer-tenancy family renters. What's the average tenant stay here, and is there a school-zone premium baked into asking?
- What's the average days-on-market for RENTAL listings here right now (not sales)? A rising rental-DOM trend means longer vacancies and softer asking-rent achievability than the comps imply.
- What's the recent tenant-quality profile in this submarket — average credit score on applications, eviction rate, late-payment / NSF rate, and stable-employment percentage? A property-management company in the area should have these aggregated.
- How much new for-sale + rental construction is in the pipeline within 1–3 miles? Heavy new supply typically softens prices + rents 12–24 months out; constrained supply supports both.
Investment metrics
- 1% rule
- 2.81% ✓
- Cap rate
- 25.64%
- Cash-on-cash
- 69.10%
- DSCR
- 4.07
- GRM
- 3.0
CMA / ARV
- ARV (on-the-fly)
- $110,080
- Comps found
- 8
Show comp detail 8 sales within ~0.75 mi
| Address | Dist | Beds/Ba | Sqft | Sold | Price | $/sf | Match |
|---|---|---|---|---|---|---|---|
| 10 Jason St | 0.00mi | 4/2.0 | 1,280 (0%) | 1mo | $110,000 | $86 | 99 |
| 12 Darren St | 0.05mi | 3/2.0 (-1) | 1,280 (0%) | 6mo | $105,000 | $82 | 88 |
| 8 Jason St | 0.01mi | 3/2.0 (-1) | 1,280 (0%) | 10mo | $95,000 | $74 | 86 |
| 2 Danny St | 0.10mi | 3/2.0 (-1) | 1,248 (-2%) | 10mo | $165,000 | $132 | 78 |
| 18 Jason St | 0.03mi | 3/1.0 (-1) | 1,239 (-3%) | 10mo | $94,000 | $76 | 76 |
| 14 Jason St | 0.02mi | 3/2.0 (-1) | 1,216 (-5%) | 14mo | $92,999 | $76 | 74 |
| 19 Jason St | 0.05mi | 3/2.0 (-1) | 1,200 (-6%) | 18mo | $105,000 | $88 | 68 |
| 17 Darren St | 0.07mi | 3/2.0 (-1) | 1,120 (-12%) | 10mo | $100,000 | $89 | 63 |
Match score weights: distance 35% · size 25% · config 20% · recency 20%. Top-matched comps best support the ARV.
Projected returns pro-forma
-3.0% appreciation · 0.38% rent growth · sell at horizon
- IRR
- 65.7%
- Equity multiple
- 3.83×
- Total profit
- $91,160
- Equity at exit
- $17,147
- IRR
- 69.2%
- Equity multiple
- 7.18×
- Total profit
- $199,119
- Equity at exit
- $9,943
Cash invested: $32,200 (down + closing). Projections, not guarantees.
Landlord ↔ Tenant lean methodology
- Overall (STATE)
- 38 Tenant-Leaning
- State Colorado
- 38 Tenant-Leaning · D+4
- County
- — inherits STATE
- City
- — inherits STATE
ZIP-level market 80109
- Home prices YoY
- -24.0%
- Rents YoY
- 0.4%
- Active inventory
- 182
- Price-to-rent
- 3.0×
Monthly cashflow live
- Estimated rent
- $3,227 high interval (Pro) →
- Mortgage (P&I)
- −$603
- Tax from tax record
- −$44 /mo · $530/yr
- Insurance
- −$48
- HOA
- −$0
- Vacancy / Maint / Mgmt
- −$678
- Net cashflow
- $1,854
Break-even live
Sensitivity live
| Price | -10% $1,919 | -5% $1,887 | +0% $1,854 | +5% $1,822 | +10% $1,789 |
|---|---|---|---|---|---|
| Rent | -10% $1,599 | -5% $1,727 | +0% $1,854 | +5% $1,982 | +10% $2,109 |
| Rate | -1.0pp $1,912 | -0.5pp $1,883 | base $1,854 | +0.5pp $1,824 | +1.0pp $1,794 |
UW: 25.0% down · 7.5% · 30yr · 1.5% tax · 5.0% vac · 8.0% maint · 8.0% mgmt
Financing live
Cash to close
- Down payment
- $28,750
- Closing costs
- $3,450
- Reserves months
- —
- Total cash needed
- —
Loan-product check · same deal, 3 products live
Conventional
25% down · 7.5% · 30yr
- Down + closing
- —
- Monthly P&I
- —
- Monthly cashflow
- —
- DSCR
- —
- Eligible?
- —
Personal DTI + credit; lowest rate.
DSCR
20% down · 8.5% · 30yr
- Down + closing
- —
- Monthly P&I
- —
- Monthly cashflow
- —
- DSCR
- —
- Eligible?
- —
No personal income docs; deal must DSCR.
Hard money
10% down · 12.0% · 12mo
- Down + closing
- —
- Monthly P&I
- —
- Monthly cashflow
- —
- DSCR
- —
- Eligible?
- —
Short-term bridge; refi at stabilization.
Rent comps 8 comps
| Address | Beds | Baths | Sqft | Rent | $/sqft | DOM | Units | Dist |
|---|---|---|---|---|---|---|---|---|
| 610 Jerry St Castle Rock, CO | 3.0 | 1.0–3.0 | 937 | $3,029 | $3.23 | 0d | 142 | 0.19mi |
| 20 Wilcox St Castle Rock, CO | 1.0–3.0 | 1.0–2.0 | 1180 | $4,200 | $3.56 | 25d | 2 | 0.54mi |
| 7 Cantril St Castle Rock, CO | 2.0–3.0 | 1.0–2.0 | 978 | $2,295 | $2.35 | 0d | 4 | 0.65mi |
| 1465 Red Hawk Dr Castle Rock, CO | 1.0–3.0 | 1.0–2.0 | 1130 | $2,671 | $2.36 | 0d | 3 | 0.65mi |
| 1457 Red Hawk Dr Castle Rock, CO | 3.0 | 2.5 | 1537 | $3,085 | $2.01 | 14d | 2 | 0.68mi |
| 960 Bishop Ct Castle Rock, CO | 3.0 | 1.0 | 892 | $1,609 | $1.80 | 25d | 1 | 1.13mi |
| 920 Bishop Ct Castle Rock, CO | 3.0 | 1.0 | 892 | $1,518 | $1.70 | 17d | 1 | 1.16mi |
| 1100 E Plum Creek Pkwy Castle Rock, CO | 1.0–3.0 | 1.0–2.0 | 984 | $2,596 | $2.64 | 4d | 33 | 1.31mi |
Listing history 11 events
-
2026-03-20status Pending
-
2026-01-28price $115,000
-
2025-10-24price $125,000
-
2025-10-10$130,000 Active
-
2025-10-06historical
-
2025-09-11price $130,000
-
2025-08-21$135,000 Active
-
2025-08-19historical
-
2022-01-21soldstatus $115,000 Closed 632-char remark
Show marketing remark (632 chars)
Tough to find a spacious four bedroom, two bath, manufactured home centrally located in the heart of Castle Rock. This home has new floors throughout, fresh paint in the updated kitchen, newer stainless steel dishwasher, gas range, and a new front door. A spacious primary bedroom with an en-suite full bathroom is located off the kitchen. Three additional bedrooms and a bathroom are located down the hall from the living room. Enjoy 2 off street parking spaces. Castle Park Mobile Home Park is located in the heart of Castle Rock with easy access to I-25, shopping at the Castle Rock Outlets, and ample dining options close by.
-
2021-12-05status Pending Accepting Backup Offers 632-char remark
Show marketing remark (632 chars)
Tough to find a spacious four bedroom, two bath, manufactured home centrally located in the heart of Castle Rock. This home has new floors throughout, fresh paint in the updated kitchen, newer stainless steel dishwasher, gas range, and a new front door. A spacious primary bedroom with an en-suite full bathroom is located off the kitchen. Three additional bedrooms and a bathroom are located down the hall from the living room. Enjoy 2 off street parking spaces. Castle Park Mobile Home Park is located in the heart of Castle Rock with easy access to I-25, shopping at the Castle Rock Outlets, and ample dining options close by.
-
2021-10-28$119,900 Active 632-char remark
Show marketing remark (632 chars)
Tough to find a spacious four bedroom, two bath, manufactured home centrally located in the heart of Castle Rock. This home has new floors throughout, fresh paint in the updated kitchen, newer stainless steel dishwasher, gas range, and a new front door. A spacious primary bedroom with an en-suite full bathroom is located off the kitchen. Three additional bedrooms and a bathroom are located down the hall from the living room. Enjoy 2 off street parking spaces. Castle Park Mobile Home Park is located in the heart of Castle Rock with easy access to I-25, shopping at the Castle Rock Outlets, and ample dining options close by.
ⓘ Source: listings_history table (triggers on properties + properties_extension) + one-shot
backfill from property_details.listing_events for pre-trigger history.
Tax reassessment forecast CO · Resets to sale price
- Current annual tax
- $530 · $44/mo
- Projected year-2 tax
- $632 · $53/mo
- Expected delta
- +$103/yr (+$9/mo · 19.4%)
ⓘ Screening estimate from a state-policy table — verify with the county assessor before closing.
Climate risk First Street
- Flood 1/10 Low FEMA zone X (unshaded) · 0% chance over 30 yrs
- Wildfire 7/10 Severe
- Heat 3/10 Moderate 9 d/yr ≥89°F today · 24 d/yr by 30 yrs out
- Wind 2/10 Low
- Air quality 1/10 Low 0 unhealthy d/yr today · 0 by 30 yrs out
Nearby sold comps map
Loading sold comps map…
Walkable amenities ~0.75 mi
Loading nearby amenities…
Taxation est. · year 1
- Rental income
- $38,725
- − Mortgage interest
- −$6,442
- − Property taxes
- −$530
- − Insurance
- −$575
- − Repairs & maintenance
- −$3,098
- − Management
- −$3,098
- − Depreciation
- −$3,345
- Taxable income
- $21,637
- Est. tax owed @ 24.0%
- −$5,193
- After-tax cash flow
- $17,058/yr
For passive investors: Depreciation is non-cash, so a rental often shows a tax loss while cash-flowing — sheltering income. Rental losses are passive: they offset passive income freely, and up to $25,000/yr can offset ordinary (W-2) income if you actively participate and your MAGI is under $100k (phasing out to $0 by $150k); unused losses carry forward. On sale, claimed depreciation is recaptured at up to 25%, and gains may owe capital-gains tax (a 1031 exchange can defer both). Figures are a year-1 estimate at your 24.0% rate — not tax advice; consult a CPA.
Schools (NCES district)
- District
- Douglas County School District No. RE-1
- NCES district ID
- 0803450
- Math proficiency
- 45% ▼ -3.00%
- Reading proficiency
- 62% ▲ 3.00%
- Median HH income
- $103,175
- Composite
- 50.71/100
- National rank
- #1818
- State rank
- #7 of 86 in CO
Livability — Castle Rock
- Score
- 78/100
- State rank
- #15
- US rank
- #2469
Category grades
Schools grade is shown separately in the Schools card above.
Census & demographics
- Census place
- Castle Rock, CO
- County
- Douglas County · 358,815 people
- City population
- 66,879
- Metro
- Denver-Aurora-Lakewood, CO
- Population (ZIP)
- 28,400
- Household income
- $155,025
- Rent vs Own
- Severe rent burden
- 472.0
Population outlook (Douglas County) Hauer SSP2
- Today (2025)
- 400,644 people
- By 2030
- 438,441 · +9.4%
- By 2040
- 509,940 · +27.3%
- By 2050
- 571,695 · +42.7%
- By 2075
- 699,992 · +74.7%
- By 2100
- 751,119 · +87.5%
Race, ethnicity, and origin ACS 2023
- Neighborhood character
- Predominantly White (80%)
- Race & ethnicity
- White 80% Hispanic / Latino 12% Two or more races 8% Asian 2% Black 1%
- Hispanic origin (detail)
- Mexican 6%
- Common ancestry
- Italian 4% Slovak 3% Portuguese 3%
- Foreign-born
- 6% · Canada, Jamaica
- Languages at home
- 89% English-only · Spanish 9% Other Indo-European 1%
Political lean MEDSL · Douglas
- 2024 margin
- Lean R (+7.0) · D 45.3% · R 52.3% · Other 2.4%
- 2008→2024 swing
- +10.2pp toward D · 2008: -17.2pp · 2024: -7.0pp
- All cycles
- 2024: R+7.0 2020: R+7.2 2016: R+18.1 2012: R+26.5 2008: R+17.2
Not yet ingested
- Civics
- —
Market trends
- HPI YoY
- ▼ -84.64%
- Current HPI
- 268.6028
- Rent YoY
- ▲ 0.38%
- Metro
- Denver-Aurora-Lakewood, CO
- State GDP YoY
- ▲ 1.95%
- F500 in state
- 14
Industry mix (Fortune 500 HQ in CO)
| Industry | F500 HQs | Revenue |
|---|---|---|
| Technology Distribution | 1 | $31B |
|
||
| Food / Agriculture | 1 | $18B |
|
||
| Packaging | 1 | $14B |
|
||
| Healthcare | 1 | $13B |
|
||
| Energy | 1 | $10B |
|
||
| Technology | 1 | $4B |
|
||
Price history
-4.1% since first listed11 events — show timeline
- 2026-03-20 Pending — REColorado as Distributed by MLS Grid
- 2026-01-28 Price Changed $115,000 REColorado as Distributed by MLS Grid
- 2025-10-24 Price Changed $125,000 REColorado as Distributed by MLS Grid
- 2025-10-10 Listed $130,000 REColorado as Distributed by MLS Grid
- 2025-10-06 Listing Removed — REColorado as Distributed by MLS Grid
- 2025-09-11 Price Changed $130,000 REColorado as Distributed by MLS Grid
- 2025-08-21 Listed $135,000 REColorado as Distributed by MLS Grid
- 2025-08-19 Coming Soon — REColorado as Distributed by MLS Grid
- 2022-01-21 Sold (MLS) $115,000 REColorado as Distributed by MLS Grid
- 2021-12-05 Pending — REColorado as Distributed by MLS Grid
- 2021-10-28 Listed $119,900 REColorado as Distributed by MLS Grid
Property tax history
+4.3%/yrLatest (2025): $530 · +100.2% YoY. Source: county tax records.
Cash-flow waterfall
monthlySold comps — $/sqft
last 12 mo · ≤1 miLoading sold comps…