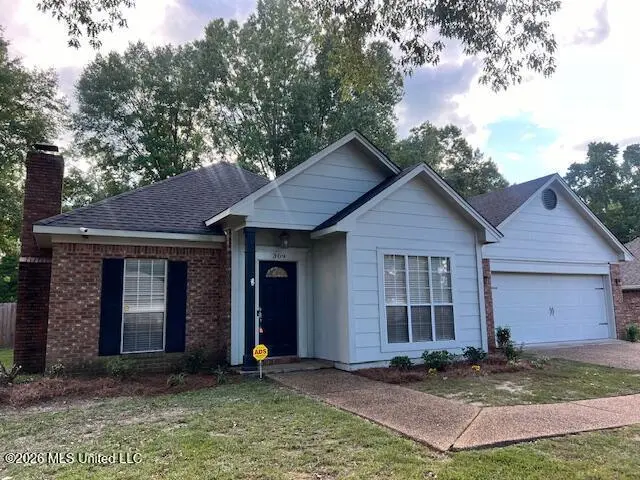
309 Water Oak Rd · Flowood, MS
Flood risk 1/10 · Minimal
- FEMA flood zone
- X (unshaded)
- Chance of flooding over 30 yrs
- 0.0%
- Est. flood insurance / yr
- $507 – $1,088
Fire risk 3/10 · Minor
- Est. fire insurance / yr
- $1,241 – $2,305
Heat risk 7/10 · Major
- Hot days now (above 108°F)
- 7 days/yr
- Hot days in 30 yrs
- 20 days/yr
Wind risk 8/10 · Major
- Chance of severe wind over 30 yrs
- 80.0%
Air-quality risk 2/10 · Minimal
- Unhealthy air days now
- 0 days/yr
- Unhealthy air days in 30 yrs
- 1 days/yr
Risk factors via First Street. Map © Google.
Why this score? — see what drove the D grade
The composite is a weighted blend of 9 inputs, each scored 0–100. Each bar is that input's sub-score; the figure is the points it added to the 100-point composite (weight × sub-score).
- Cash flow +14.0/30.0
- ARV discount +7.9/15.0
- Schools +4.6/10.0
- DSCR +4.3/10.0
- Livability +3.9/5.0
- Rent growth +3.2/5.0
- 1% rule +2.8/10.0
- Condition / age +2.5/5.0
- Appreciation +0.0/10.0
$259,900
🖨 Deal sheet (PDF) 📄 Offer letter ✓ Due diligence
Listing remarks MLS
Perfect starter home - 3 bed room/2 full bath, quiet neighborhood; Ready to move in. Spacious throughout, walk in closet in master bedroom, door to back patio; Newly screened patio, quiet patio setting for a morning coffee or just chill out in the back facing shaded trees on large grassy back yard; "Freshly Painted interior walls and front of the house and pressure washed " Kitchen cabinets will be painted in a couple of days.
Key facts
- Tile floors
- New landscaping
- Medallion focal tile
Tags
Property features AI
Finance
- Other: Living area source: Appraiser
- Financial info: Financial details not provided
- HOA & community: Homeowners association with annual fee of $150 (includes management); Community curbs
Exterior
- Parking: 2 total parking spaces; 2-car garage with garage door opener and garage facing front
- Security: Prewired for security; Smoke detector(s)
- Utilities: Public water; Public sewer; Electricity available; Natural gas available; Cable available
- Home design: Single-family residence; House; One story; Move-in ready
- Construction: Brick and HardiPlank-type siding; Architectural shingle roof; Concrete perimeter foundation and slab; Built year source: Assessor
- Exterior features: Patio (screened); Back yard fencing (wood); Level lot
Interior
- Kitchen: Dishwasher; Disposal; Electric cooktop; Microwave; Oven; Self-cleaning oven; Exhaust fan
- Bedrooms: Bedrooms information not provided
- Flooring: Carpet; Ceramic tile; Laminate
- Bathrooms: 2 full bathrooms
- Heating & cooling: Central heating (natural gas); Fireplace heat; Central air; Ceiling fan(s)
- Interior features: High ceilings; Double vanity; Walk-in closet(s); Storage; Dead bolt locks; Prewired security; Smoke detector(s); Gas log fireplace
- Laundry & utility: Electric dryer hookup; Gas water heater; Water heater
Neighborhood map
What this means for you Summary
Snapshot
- This is a 3-bed/2.0-bath single-family listed at $260k.
Deal economics
- At list price, monthly cash flow is $34 ($412/yr) — positive.
- The deal already cash-flows at list — no discount required.
- To meet the 1% rule (rent ≥ 1% of price), the offer needs to be $204k (21.7% below list).
- Recommended offer: $204k (21.7% below list) — sets the bar for 1% rule.
- Cap rate 6.5% vs local median 4.3% in Flowood — top-decile yield for the area; either an underpriced asset or a hidden risk that comps aren't pricing in. Stress-test before assuming the spread holds.
Location & tenants
- Location reads 77/100 on livability (#10 in MS, #3,075 nationally) — a middle-class / working-renter tenant base. Strengths: crime A+, cost of living A+, housing A+; Watch: amenities F, commute F.
- Rankin County School District (rural): math 56% / reading 48% proficiency, ranked #6 of 130 in MS (top 5%) — acceptable for families but not a draw, mixed tenant base, ~2y average lease.
- Zoned schools: Flowood Elementary School (math 48% / reading 51%, grade D, #65 of 375 statewide, top 20%, 489 students, 99% FRL); Northwest Rankin Middle School (math 63% / reading 51%, grade B, #13 of 179 statewide, top 7%, 1,374 students, 100% FRL); Northwest Rankin High School (math 48% / reading 42%, grade D-, #34 of 197 statewide, top 17%, 1,898 students, 100% FRL) — zoned schools average 100% FRL vs 35% district-wide (65 pts higher); higher-poverty schools than district average — tighter screening recommended.
- Market conditions: Rents rising (+2.9%/yr); 440 active listings in the ZIP; 7 comparable units currently listed for rent nearby; rentals lingering (median 46d on market — plan ~5-8 weeks vacancy on turnover, expect pricing pressure); 57% of comp listings sitting > 30 days — soft ceiling on asking rent; solid renter incomes; 343 units permitted in Rankin County in 2024 (0 in 5+ unit buildings).
Forward outlook
- Local home prices are declining (-3.0%/yr); year-one equity from $2k of loan paydown is wiped out by about $8k of value loss. Plan a longer hold.
- Rankin County population projected at +17% by 2050 — long-run rental-demand tailwind backs the buy-and-hold thesis.
Negotiation context
- Only 8 days on market — expect competitive offers; lowballing is unlikely to land.
- 4 sale attempts since 24y ago with the ask held roughly flat each time — persistent listings suggest the price (not the market) is what's stuck; bring a comps-based counter.
Risks & watch-outs
- Climate carrying-cost: severe wind risk, 80% chance of damaging wind over 30y; extreme-heat days projected 7→20/yr by 2055 (HVAC capex compounding) — expect insurance premiums to compound above CPI over the hold.
Questions for the listing agent
- What does the HOA fee cover, when was the last increase, and are there any pending special assessments or reserve-fund shortfalls?
- Is there a deadline driving the sale (1031 exchange, divorce, estate, relocation)? That informs how much negotiation room exists.
- Schools are B-rated — typically a magnet for longer-tenancy family renters. What's the average tenant stay here, and is there a school-zone premium baked into asking?
- The area grade is low — what's the realistic commute time and amenity access for the typical tenant pool here? Any planned neighborhood developments (good or bad) we should know about?
- What's the average days-on-market for RENTAL listings here right now (not sales)? A rising rental-DOM trend means longer vacancies and softer asking-rent achievability than the comps imply.
- What's the recent tenant-quality profile in this submarket — average credit score on applications, eviction rate, late-payment / NSF rate, and stable-employment percentage? A property-management company in the area should have these aggregated.
- How much new for-sale + rental construction is in the pipeline within 1–3 miles? Heavy new supply typically softens prices + rents 12–24 months out; constrained supply supports both.
Investment metrics
- 1% rule
- 0.78% ✗
- Cap rate
- 6.45%
- Cash-on-cash
- 0.57%
- DSCR
- 1.03
- GRM
- 10.6
CMA / ARV
- ARV (on-the-fly)
- $262,080
- Comps found
- 12
Show comp detail 12 sales within ~0.75 mi
| Address | Dist | Beds/Ba | Sqft | Sold | Price | $/sf | Match |
|---|---|---|---|---|---|---|---|
| 1401 Barnett Bend Cir | 0.30mi | 3/2.0 | 1,438 (-1%) | 3mo | $239,900 | $167 | 81 |
| 301 White Oak Dr | 0.15mi | 3/2.0 | 1,558 (+7%) | 3mo | $279,500 | $179 | 79 |
| 344 White Oak Dr | 0.26mi | 3/2.0 | 1,323 (-9%) | 2mo | $244,000 | $184 | 71 |
| 100 Summerdale Pl | 0.62mi | 3/2.0 | 1,440 (-1%) | 0mo | $287,000 | $199 | 69 |
| 188 Oak Grove Dr | 0.40mi | 3/2.0 | 1,570 (+8%) | 1mo | $264,900 | $169 | 68 |
| 214 Chinkapen Dr | 0.21mi | 3/2.0 | 1,634 (+12%) | 3mo | $282,000 | $173 | 67 |
| 509 Suffolk Cv | 0.61mi | 3/2.0 | 1,410 (-3%) | 1mo | $275,000 | $195 | 66 |
| 132 Post Oak Dr | 0.60mi | 3/2.0 | 1,386 (-5%) | 1mo | $250,000 | $180 | 63 |
| 129 Post Oak Dr | 0.62mi | 3/2.0 | 1,405 (-4%) | 2mo | $240,000 | $171 | 63 |
| 222 Cherrybark Ln | 0.60mi | 3/2.0 | 1,340 (-8%) | 3mo | $240,000 | $179 | 56 |
| 813 Whippoorwill Dr | 0.69mi | 3/2.0 | 1,347 (-8%) | 0mo | $254,000 | $189 | 55 |
| 424 Timber Ridge Way | 0.72mi | 3/2.0 | 1,365 (-6%) | 3mo | $249,900 | $183 | 53 |
Match score weights: distance 35% · size 25% · config 20% · recency 20%. Top-matched comps best support the ARV.
Projected returns pro-forma
-3.0% appreciation · 2.9% rent growth · sell at horizon
- IRR
- -15.5%
- Equity multiple
- 0.45×
- Total profit
- $-40,237
- Equity at exit
- $38,752
- IRR
- -7.3%
- Equity multiple
- 0.54×
- Total profit
- $-33,487
- Equity at exit
- $22,471
Cash invested: $72,772 (down + closing). Projections, not guarantees.
Landlord ↔ Tenant lean methodology
- Overall (STATE)
- 90 Strongly Landlord-Friendly
- State Mississippi
- 90 Strongly Landlord-Friendly · R+11
- County
- — inherits STATE
- City
- — inherits STATE
ZIP-level market 39047
- Home prices YoY
- -32.6%
- Rents YoY
- 2.9%
- Active inventory
- 440
- Price-to-rent
- 10.6×
Monthly cashflow live
- Estimated rent
- $2,036 high interval (Pro) →
- Mortgage (P&I)
- −$1,363
- Tax from tax record
- −$90 /mo · $1,079/yr
- Insurance
- −$108
- HOA
- −$13
- Vacancy / Maint / Mgmt
- −$428
- Net cashflow
- $34
Break-even live
Sensitivity live
| Price | -10% $181 | -5% $108 | +0% $34 | +5% $-39 | +10% $-113 |
|---|---|---|---|---|---|
| Rent | -10% $-126 | -5% $-46 | +0% $34 | +5% $115 | +10% $195 |
| Rate | -1.0pp $165 | -0.5pp $100 | base $34 | +0.5pp $-33 | +1.0pp $-101 |
UW: 25.0% down · 7.5% · 30yr · 1.5% tax · 5.0% vac · 8.0% maint · 8.0% mgmt
Financing live
Cash to close
- Down payment
- $64,975
- Closing costs
- $7,797
- Reserves months
- —
- Total cash needed
- —
Loan-product check · same deal, 3 products live
Conventional
25% down · 7.5% · 30yr
- Down + closing
- —
- Monthly P&I
- —
- Monthly cashflow
- —
- DSCR
- —
- Eligible?
- —
Personal DTI + credit; lowest rate.
DSCR
20% down · 8.5% · 30yr
- Down + closing
- —
- Monthly P&I
- —
- Monthly cashflow
- —
- DSCR
- —
- Eligible?
- —
No personal income docs; deal must DSCR.
Hard money
10% down · 12.0% · 12mo
- Down + closing
- —
- Monthly P&I
- —
- Monthly cashflow
- —
- DSCR
- —
- Eligible?
- —
Short-term bridge; refi at stabilization.
Rent comps 7 comps
| Address | Beds | Baths | Sqft | Rent | $/sqft | DOM | Units | Dist |
|---|---|---|---|---|---|---|---|---|
| 1204 Barnett Bend Cir Brandon, MS | 2.0 | 2.0 | 1127 | $1,625 | $1.44 | 23d | 1 | 0.38mi |
| 301 Jasmine Ct Brandon, MS | 3.0 | 2.0 | 1805 | $2,200 | $1.22 | 45d | 1 | 0.82mi |
| 500 Avalon Way Brandon, MS | 2.0–3.0 | 2.0 | 1287 | $2,052 | $1.59 | 15d | 6 | 1.00mi |
| 111 Lakeshore Dr Brandon, MS | 1.0–3.0 | 1.0–2.0 | 974 | $2,218 | $2.28 | 15d | 8 | 1.14mi |
| 352 Brendalwood Cv Brandon, MS | 2.0 | 1.5 | 1248 | $1,157 | $0.93 | 45d | 1 | 1.40mi |
| 224 Jacks Pl Brandon, MS | 3.0 | 2.0 | 1512 | $2,100 | $1.39 | 45d | 1 | 1.41mi |
| 508 Stockton Cv Flowood, MS | 3.0 | 2.0 | 1271 | $1,806 | $1.42 | 45d | 1 | 1.46mi |
HOA detail
- Monthly dues
- $13 · $156/yr
Listing history 7 events
-
2026-06-22days on market $259,900 Active 8 DOM
-
2026-06-18days on market $259,900 Active 5 DOM
-
2026-06-17days on market $259,900 Active 4 DOM
-
2026-06-16days on market $259,900 Active 3 DOM
-
2026-06-15days on market $259,900 Active 2 DOM
-
2026-06-14remarks 699-char remark
-
2026-06-14$259,900 Active 1 DOM
ⓘ Source: listings_history table (triggers on properties + properties_extension) + one-shot
backfill from property_details.listing_events for pre-trigger history.
Tax reassessment forecast MS · Resets to sale price
- Current annual tax
- $1,079 · $90/mo
- Projected year-2 tax
- $2,053 · $171/mo
- Expected delta
- +$974/yr (+$81/mo · 90.3%)
ⓘ Screening estimate from a state-policy table — verify with the county assessor before closing.
Climate risk First Street
- Flood 1/10 Low FEMA zone X (unshaded) · 0% chance over 30 yrs
- Wildfire 3/10 Moderate
- Heat 7/10 Severe 7 d/yr ≥108°F today · 20 d/yr by 30 yrs out
- Wind 8/10 Severe 80% chance of damaging wind over 30 yrs
- Air quality 2/10 Low 0 unhealthy d/yr today · 1 by 30 yrs out
Nearby sold comps map
Loading sold comps map…
Walkable amenities ~0.75 mi
Loading nearby amenities…
Taxation est. · year 1
- Rental income
- $24,433
- − Mortgage interest
- −$14,558
- − Property taxes
- −$1,079
- − Insurance
- −$1,300
- − Repairs & maintenance
- −$1,955
- − Management
- −$1,955
- − HOA
- −$156
- − Depreciation
- −$7,561
- Taxable loss
- −$4,130
- Est. tax savings @ 24.0%
- +$991
- After-tax cash flow
- $1,404/yr
For passive investors: Depreciation is non-cash, so a rental often shows a tax loss while cash-flowing — sheltering income. Rental losses are passive: they offset passive income freely, and up to $25,000/yr can offset ordinary (W-2) income if you actively participate and your MAGI is under $100k (phasing out to $0 by $150k); unused losses carry forward. On sale, claimed depreciation is recaptured at up to 25%, and gains may owe capital-gains tax (a 1031 exchange can defer both). Figures are a year-1 estimate at your 24.0% rate — not tax advice; consult a CPA.
Schools (NCES district)
- District
- Rankin County School District
- NCES district ID
- 2803830
- Math proficiency
- 56% ▼ -4.00%
- Reading proficiency
- 48% ▼ -6.00%
- Median HH income
- $61,867
- Composite
- 45.62/100
- National rank
- #2587
- State rank
- #6 of 130 in MS
Livability — Flowood
- Score
- 77/100
- State rank
- #10
- US rank
- #3075
Category grades
Schools grade is shown separately in the Schools card above.
Census & demographics
- County
- Rankin County · 123,614 people
- City population
- 9,222
- Metro
- Jackson, MS
- Population (ZIP)
- 40,808
- Household income
- $100,347
- Rent vs Own
- Severe rent burden
- 551.0
Population outlook (Rankin County) Hauer SSP2
- Today (2025)
- 164,317 people
- By 2030
- 171,013 · +4.1%
- By 2040
- 182,723 · +11.2%
- By 2050
- 192,376 · +17.1%
- By 2075
- 209,535 · +27.5%
- By 2100
- 209,534 · +27.5%
Race, ethnicity, and origin ACS 2023
- Neighborhood character
- Predominantly White (77%)
- Race & ethnicity
- White 77% Black 16% Two or more races 4% Hispanic / Latino 2% Asian 1%
- Common ancestry
- Italian 4% Slovak 3% Serbian 3%
- Foreign-born
- 3% · Canada
- Languages at home
- 95% English-only · Spanish 3% Other Indo-European 1% Other Asian/Pacific 1%
Political lean MEDSL · Rankin
- 2024 margin
- Solid R (+47.1) · D 25.9% · R 73.0% · Other 1.0%
- 2008→2024 swing
- +6.4pp toward D · 2008: -53.5pp · 2024: -47.1pp
- All cycles
- 2024: R+47.1 2020: R+45.4 2016: R+52.9 2012: R+51.9 2008: R+53.5
Not yet ingested
- Civics
- —
Market trends
- HPI YoY
- ▼ -79.01%
- Current HPI
- 162.9709
- Rent YoY
- ▲ 2.90%
- Metro
- Jackson, MS
- State GDP YoY
- —
- F500 in state
- 0
Price history
+120.4% since first listed7 events — show timeline
- 2026-06-13 Listed $259,900 MLSU
- 2017-12-18 Sold (MLS) — MLSU
- 2017-09-30 Listed $159,900 MLSU
- 2016-04-25 Sold (MLS) — MLSU
- 2016-02-10 Listed $159,900 MLSU
- 2002-09-20 Sold (MLS) — MLSU
- 2002-06-08 Listed $117,900 MLSU
Property tax history
-1.1%/yrLatest (2025): $1,079 · +5.4% YoY. Source: county tax records.
Cash-flow waterfall
monthlySold comps — $/sqft
last 12 mo · ≤1 miLoading sold comps…