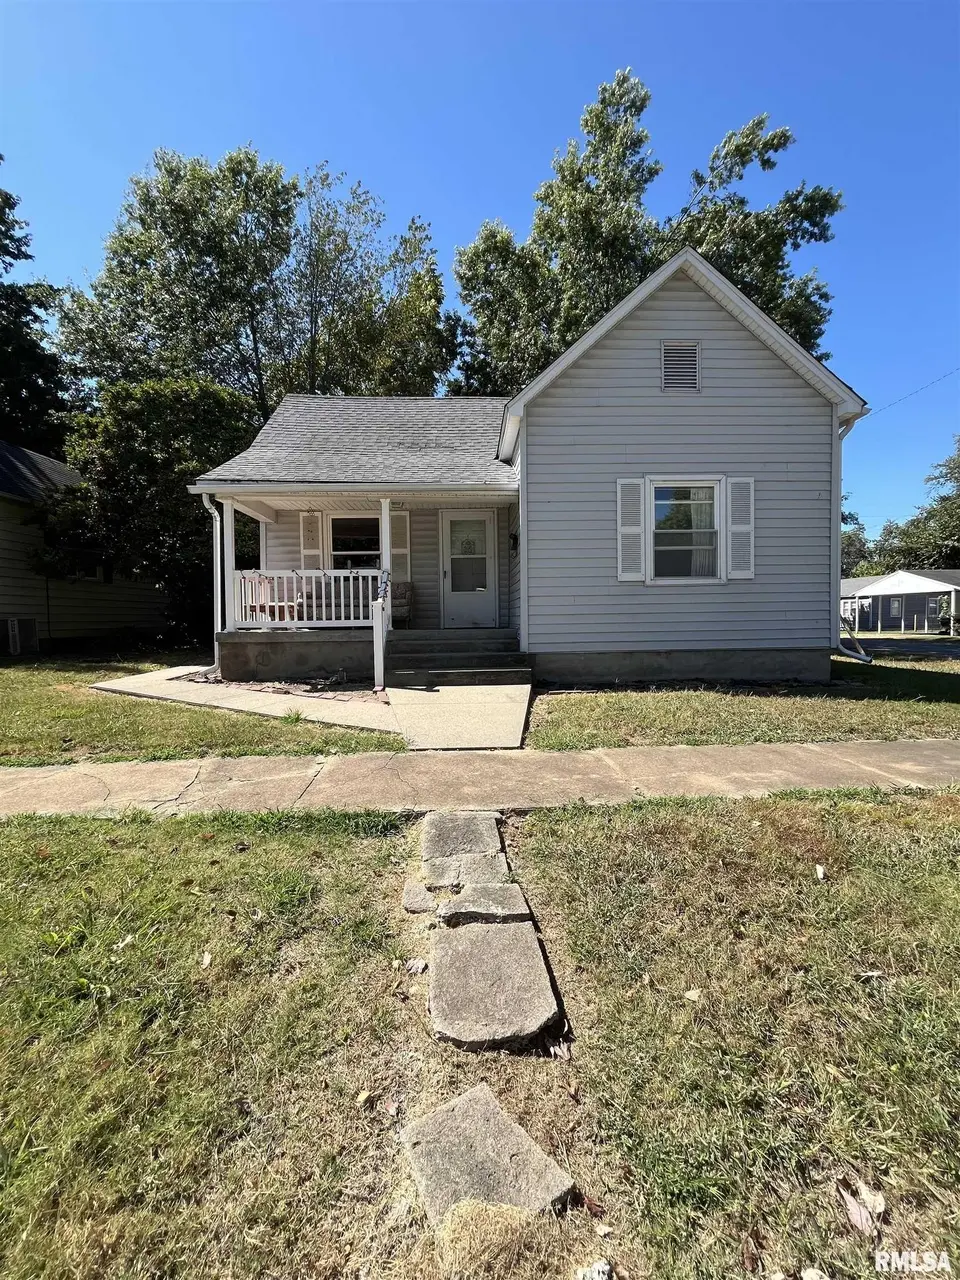
421 N 21st St · Herrin, IL
Flood risk 1/10 · Minimal
- FEMA flood zone
- X (unshaded)
- Chance of flooding over 30 yrs
- 0.0%
- Est. flood insurance / yr
- $507 – $1,088
Fire risk 1/10 · Minimal
- Est. fire insurance / yr
- $804 – $1,492
Heat risk 5/10 · Moderate
- Hot days now (above 107°F)
- 7 days/yr
- Hot days in 30 yrs
- 20 days/yr
Wind risk 2/10 · Minimal
- Chance of severe wind over 30 yrs
- 2.0%
Air-quality risk 2/10 · Minimal
- Unhealthy air days now
- 0 days/yr
- Unhealthy air days in 30 yrs
- 2 days/yr
Risk factors via First Street. Map © Google.
Why this score? — see what drove the B+ grade
The composite is a weighted blend of 9 inputs, each scored 0–100. Each bar is that input's sub-score; the figure is the points it added to the 100-point composite (weight × sub-score).
- Cash flow +30.0/30.0
- ARV discount +15.0/15.0
- 1% rule +10.0/10.0
- DSCR +10.0/10.0
- Livability +3.2/5.0
- Rent growth +2.5/5.0
- Condition / age +2.5/5.0
- Schools +2.1/10.0
- Appreciation +0.0/10.0
$58,900
🖨 Deal sheet (PDF) 📄 Offer letter ✓ Due diligence
Listing remarks MLS
Cute and cozy 2 bedroom home in Herrin. The home is rented with a wonderful tenant and consistently brings monthly income. The house sits on a corner lot and features a side deck for outdoor relaxing. There is a carport in the back as well.
Key facts
- Side deck
- Carport
- Corner lot
Tags
Neighborhood map
What this means for you Summary
Snapshot
- This is a 2-bed/1.0-bath single-family listed at $59k.
Deal economics
- At list price, monthly cash flow is $435 ($5k/yr) — positive.
- The deal already cash-flows at list — no discount required.
- Meets the 1% rule at list price ($1k rent vs $59k).
- Recommended offer: $52k (12.0% below list) — sets the bar for market timing.
- Cap rate 15.2% vs local median 8.7% in Herrin — top-decile yield for the area; either an underpriced asset or a hidden risk that comps aren't pricing in. Stress-test before assuming the spread holds.
Location & tenants
- Location reads 64/100 on livability (#667 in IL) — a middle-class / working-renter tenant base. Strengths: cost of living A+, housing A+, health & safety B; Watch: crime D-, amenities F, commute F.
- Herrin CUSD 4 (suburban): math 22% / reading 27% proficiency, ranked #364 of 620 in IL (top 59%) — low school quality limits family demand, transient renter base, plan for 1-2y turnover.
- Zoned schools: Herrin C U S D 4 Elem School (math 21% / reading 25%, grade F, #929 of 2,056 statewide, top 45%, 679 students, 0% FRL); Herrin Middle School (math 24% / reading 28%, grade F, #318 of 665 statewide, top 48%, 507 students, 0% FRL); Herrin High School (math 22% / reading 32%, grade F, #218 of 693 statewide, top 35%, 686 students, 0% FRL) — zoned schools average 0% FRL vs 56% district-wide (56 pts lower); this property's tenant base skews higher-income than the district average.
- Market conditions: 92 active listings in the ZIP; 3 comparable units currently listed for rent nearby; rentals lingering (median 46d on market — plan ~5-8 weeks vacancy on turnover, expect pricing pressure); 100% of comp listings sitting > 30 days — soft ceiling on asking rent; 130 units permitted in Williamson County in 2024 (5 in 5+ unit buildings).
Forward outlook
- Local home prices are declining (-3.0%/yr); year-one equity from $407 of loan paydown is wiped out by about $2k of value loss. Plan a longer hold.
- At projected returns (-3.0% appreciation + 3.0% rent growth), your $16k cash investment doubles in ~4 years — after that, you're playing with house money.
Negotiation context
- It's been on market 151 days — a 12% lower offer ($52k) is reasonable based on typical stale-listing flexibility.
- 9 sale attempts since 17y ago; this cycle's ask has dropped $10k (15%) from the opening price — seller is motivated, your offer sets the floor, not the list.
- Current owner paid $43k; 38% above their basis — modest negotiation headroom, anchor on the comps not their cost.
Risks & watch-outs
- Watch-outs: built in 1910 — expect roof / HVAC / electrical / plumbing capex.
- Climate carrying-cost: extreme-heat days projected 7→20/yr by 2055 (HVAC capex compounding) — expect insurance premiums to compound above CPI over the hold.
Questions for the listing agent
- It's been on market 151 days. Have you received any prior offers? Is the seller open to a 12% concession, seller financing, or rate buy-down credit?
- Built in 1910 — when were the roof, HVAC, electrical panel, plumbing, and water heater last replaced?
- Why hasn't it sold? Are there any deal-killer items the seller is aware of (foundation, flood, title, zoning, code violations)?
- Is there a deadline driving the sale (1031 exchange, divorce, estate, relocation)? That informs how much negotiation room exists.
- Schools are D-rated, which usually means shorter tenancies and higher turnover. Who's the typical renter profile here, and what's been the actual vacancy rate?
- Crime grade is D in this area — have there been break-ins, vandalism, or insurance claims at this property in the last 3 years? What carrier currently insures it and at what premium?
- What's the average days-on-market for RENTAL listings here right now (not sales)? A rising rental-DOM trend means longer vacancies and softer asking-rent achievability than the comps imply.
- What's the recent tenant-quality profile in this submarket — average credit score on applications, eviction rate, late-payment / NSF rate, and stable-employment percentage? A property-management company in the area should have these aggregated.
- How much new for-sale + rental construction is in the pipeline within 1–3 miles? Heavy new supply typically softens prices + rents 12–24 months out; constrained supply supports both.
Investment metrics
- 1% rule
- 1.86% ✓
- Cap rate
- 15.15%
- Cash-on-cash
- 31.64%
- DSCR
- 2.41
- GRM
- 4.5
CMA / ARV
- ARV (median comp)
- $73,186
- List price
- $58,900
- Delta
- -19.52%
- Verdict
- UNDERPRICED
- Comps
- 20 within 1.0 mi
Show comp detail 12 sales within ~0.75 mi
| Address | Dist | Beds/Ba | Sqft | Sold | Price | $/sf | Match |
|---|---|---|---|---|---|---|---|
| 421 N 18th St | 0.19mi | 2/1.0 | 902 (-2%) | 1mo | $93,000 | $103 | 86 |
| 804 W Harrison St | 0.35mi | 2/1.0 | 940 (+2%) | 2mo | $71,000 | $76 | 80 |
| 710 W Maple St | 0.41mi | 2/1.0 | 932 (+1%) | 1mo | $94,800 | $102 | 79 |
| 1117 W Cherry St | 0.33mi | 2/1.0 | 980 (+6%) | 6mo | $79,900 | $82 | 69 |
| 520 N 27th St | 0.29mi | 3/1.0 (+1) | 960 (+4%) | 8mo | $105,000 | $109 | 69 |
| 501 N 18th St | 0.19mi | 2/1.0 | 824 (-11%) | 7mo | $62,500 | $76 | 67 |
| 708 N 20th St | 0.19mi | 2/1.0 | 1,044 (+13%) | 5mo | $86,000 | $82 | 65 |
| 211 W Bryan St | 0.55mi | 2/1.0 | 984 (+6%) | 1mo | $55,000 | $56 | 63 |
| 304 N 18th St | 0.24mi | 2/2.0 | 1,020 (+10%) | 15mo | $90,000 | $88 | 55 |
| 1316 N Park Ave | 0.70mi | 2/1.0 | 990 (+7%) | 1mo | $82,300 | $83 | 54 |
| 404 S 23rd St | 0.53mi | 2/2.0 | 1,000 (+8%) | 12mo | $87,500 | $88 | 48 |
| 408 N 12th St | 0.61mi | 3/1.0 (+1) | 810 (-12%) | 4mo | $60,000 | $74 | 43 |
Match score weights: distance 35% · size 25% · config 20% · recency 20%. Top-matched comps best support the ARV.
Projected returns pro-forma
-3.0% appreciation · 3.0% rent growth · sell at horizon
- IRR
- 26.6%
- Equity multiple
- 2.10×
- Total profit
- $18,182
- Equity at exit
- $8,782
- IRR
- 34.2%
- Equity multiple
- 4.13×
- Total profit
- $51,618
- Equity at exit
- $5,093
Cash invested: $16,492 (down + closing). Projections, not guarantees.
Landlord ↔ Tenant lean methodology
- Overall (STATE)
- 43 Moderately Tenant-Leaning
- State Illinois
- 43 Moderately Tenant-Leaning · D+7
- County
- — inherits STATE
- City
- — inherits STATE
ZIP-level market 62948
- Home prices YoY
- -34.1%
- Active inventory
- 92
- Price-to-rent
- 4.5×
Monthly cashflow live
- Estimated rent
- $1,093 medium interval (Pro) →
- Mortgage (P&I)
- −$309
- Tax from tax record
- −$95 /mo · $1,146/yr
- Insurance
- −$25
- HOA
- −$0
- Vacancy / Maint / Mgmt
- −$230
- Net cashflow
- $435
Break-even live
Sensitivity live
| Price | -10% $468 | -5% $452 | +0% $435 | +5% $418 | +10% $402 |
|---|---|---|---|---|---|
| Rent | -10% $348 | -5% $392 | +0% $435 | +5% $478 | +10% $521 |
| Rate | -1.0pp $465 | -0.5pp $450 | base $435 | +0.5pp $420 | +1.0pp $404 |
UW: 25.0% down · 7.5% · 30yr · 1.5% tax · 5.0% vac · 8.0% maint · 8.0% mgmt
Financing live
Cash to close
- Down payment
- $14,725
- Closing costs
- $1,767
- Reserves months
- —
- Total cash needed
- —
Loan-product check · same deal, 3 products live
Conventional
25% down · 7.5% · 30yr
- Down + closing
- —
- Monthly P&I
- —
- Monthly cashflow
- —
- DSCR
- —
- Eligible?
- —
Personal DTI + credit; lowest rate.
DSCR
20% down · 8.5% · 30yr
- Down + closing
- —
- Monthly P&I
- —
- Monthly cashflow
- —
- DSCR
- —
- Eligible?
- —
No personal income docs; deal must DSCR.
Hard money
10% down · 12.0% · 12mo
- Down + closing
- —
- Monthly P&I
- —
- Monthly cashflow
- —
- DSCR
- —
- Eligible?
- —
Short-term bridge; refi at stabilization.
Rent comps 3 comps
| Address | Beds | Baths | Sqft | Rent | $/sqft | DOM | Units | Dist |
|---|---|---|---|---|---|---|---|---|
| 715 N 35th St Unit D Herrin, IL | 2.0 | 1.0 | 850 | $1,200 | $1.41 | 45d | 1 | 0.83mi |
| 6 Court C Herrin, IL | 2.0 | 1.0 | 900 | $895 | $0.99 | 45d | 1 | 0.88mi |
| 3 Ct D Herrin, IL | 3.0 | 1.0 | 1000 | $1,195 | $1.20 | 45d | 1 | 0.93mi |
Listing history 49 events
-
2026-06-22days on market $58,900 Active 151 DOM
-
2026-06-21days on market $58,900 Active 150 DOM
-
2026-06-19days on market $58,900 Active 148 DOM
-
2026-06-18days on market $58,900 Active 147 DOM
-
2026-06-17days on market $58,900 Active 146 DOM
-
2026-06-16days on market $58,900 Active 145 DOM
-
2026-06-15days on market $58,900 Active 144 DOM
-
2026-06-14days on market $58,900 Active 142 DOM
-
2026-06-13days on market $58,900 Active 141 DOM
-
2026-06-10days on market $58,900 Active 139 DOM
-
2026-06-09days on market $58,900 Active 138 DOM
-
2026-06-08days on market $58,900 Active 137 DOM
-
2026-06-07days on market $58,900 Active 136 DOM
-
2026-06-03days on market $58,900 Active 132 DOM
-
2026-06-02days on market $58,900 Active 131 DOM
-
2026-06-01days on market $58,900 Active 130 DOM
-
2026-05-31days on market $58,900 Active 129 DOM
-
2026-05-30days on market $58,900 Active 128 DOM
-
2026-04-16price $58,900 240-char remark
Show marketing remark (240 chars)
Cute and cozy 2 bedroom home in Herrin. The home is rented with a wonderful tenant and consistently brings monthly income. The house sits on a corner lot and features a side deck for outdoor relaxing. There is a carport in the back as well.
-
2026-01-28historical
-
2026-01-20status Active
-
2026-01-14historical
-
2026-01-08status Active
-
2026-01-05historical
-
2025-10-22status Active
-
2025-10-22price
-
2025-10-22historical
-
2025-09-14status Pending
-
2025-09-08Active
-
2025-09-04$68,900 Active 240-char remark
Show marketing remark (240 chars)
Cute and cozy 2 bedroom home in Herrin. The home is rented with a wonderful tenant and consistently brings monthly income. The house sits on a corner lot and features a side deck for outdoor relaxing. There is a carport in the back as well.
-
2021-08-06historical
-
2021-08-06historical
-
2021-08-06historical
-
2021-08-06historical
-
2018-09-04soldstatus $42,600
-
2018-09-04soldstatus $42,600
-
2018-08-10soldstatus $43,000
-
2018-05-01$45,000
-
2018-05-01$45,000
-
2015-08-10historical
-
2010-01-11soldstatus $50,000
-
2010-01-11soldstatus $50,000
-
2010-01-11soldstatus $50,000
-
2009-02-09$57,000
-
2009-02-09$57,000
-
2003-06-04soldstatus $38,000
-
2002-12-24historical
-
2002-10-09historical
-
2002-06-24historical
ⓘ Source: listings_history table (triggers on properties + properties_extension) + one-shot
backfill from property_details.listing_events for pre-trigger history.
Tax reassessment forecast IL · Partial reset (capped growth)
- Current annual tax
- $1,146 · $95/mo
- Projected year-2 tax
- $1,241 · $103/mo
- Expected delta
- +$96/yr (+$8/mo · 8.3%)
ⓘ Screening estimate from a state-policy table — verify with the county assessor before closing.
Climate risk First Street
- Flood 1/10 Low FEMA zone X (unshaded) · 0% chance over 30 yrs
- Wildfire 1/10 Low
- Heat 5/10 Major 7 d/yr ≥107°F today · 20 d/yr by 30 yrs out
- Wind 2/10 Low 2% chance of damaging wind over 30 yrs
- Air quality 2/10 Low 0 unhealthy d/yr today · 2 by 30 yrs out
Nearby sold comps map
Loading sold comps map…
Walkable amenities ~0.75 mi
Loading nearby amenities…
Taxation est. · year 1
- Rental income
- $13,120
- − Mortgage interest
- −$3,299
- − Property taxes
- −$1,146
- − Insurance
- −$294
- − Repairs & maintenance
- −$1,050
- − Management
- −$1,050
- − Depreciation
- −$1,713
- Taxable income
- $4,568
- Est. tax owed @ 24.0%
- −$1,096
- After-tax cash flow
- $4,122/yr
For passive investors: Depreciation is non-cash, so a rental often shows a tax loss while cash-flowing — sheltering income. Rental losses are passive: they offset passive income freely, and up to $25,000/yr can offset ordinary (W-2) income if you actively participate and your MAGI is under $100k (phasing out to $0 by $150k); unused losses carry forward. On sale, claimed depreciation is recaptured at up to 25%, and gains may owe capital-gains tax (a 1031 exchange can defer both). Figures are a year-1 estimate at your 24.0% rate — not tax advice; consult a CPA.
Schools (NCES district)
- District
- Herrin CUSD 4
- NCES district ID
- 1718810
- Math proficiency
- 22% ▼ -11.00%
- Reading proficiency
- 27% ▼ -17.00%
- Median HH income
- $38,824
- Composite
- 20.56/100
- National rank
- #8558
- State rank
- #364 of 620 in IL
Livability — Herrin
- Score
- 64/100
- State rank
- #667
- US rank
- #13670
Category grades
Schools grade is shown separately in the Schools card above.
Census & demographics
- Census place
- Herrin, IL
- City population
- 12,728
- Population (ZIP)
- 12,728
Population outlook (Williamson County) Hauer SSP2
- Today (2025)
- 69,553 people
- By 2030
- 70,090 · +0.8%
- By 2040
- 70,345 · +1.1%
- By 2050
- 69,394 · -0.2%
- By 2075
- 63,590 · -8.6%
- By 2100
- 51,154 · -26.5%
Race, ethnicity, and origin ACS 2023
- Neighborhood character
- Predominantly White (85%)
- Race & ethnicity
- White 85% Two or more races 8% Black 5% Hispanic / Latino 4% Native American 1%
- Common ancestry
- Romanian 4% Lithuanian 3% Slovak 2%
- Foreign-born
- 3% · Canada
- Languages at home
- 95% English-only · Spanish 3%
Political lean MEDSL · Williamson
- 2024 margin
- Solid R (+38.8) · D 30.0% · R 68.8% · Other 1.3%
- 2008→2024 swing
- -24.0pp toward R · 2008: -14.8pp · 2024: -38.8pp
- All cycles
- 2024: R+38.8 2020: R+37.3 2016: R+41.2 2012: R+25.0 2008: R+14.8
Not yet ingested
- Civics
- —
Market trends
- HPI YoY
- ▼ -67.82%
- Current HPI
- 131.1617
- Rent YoY
- —
- Metro
- —
- State GDP YoY
- ▲ 1.59%
- F500 in state
- 60
Industry mix (Fortune 500 HQ in IL)
| Industry | F500 HQs | Revenue |
|---|---|---|
| Insurance | 4 | $201B |
|
||
| Consumer Goods | 4 | $87B |
|
||
| Industrial Machinery | 3 | $64B |
|
||
| Healthcare | 2 | $55B |
|
||
| Retail / Pharmacy | 1 | $148B |
|
||
| Agriculture / Food | 1 | $86B |
|
||
Price history
+55.0% since first listed31 events — show timeline
- 2026-04-16 Price Changed $58,900 RMLSA as Distributed by MLS Grid
- 2026-01-28 Listing Removed — MRED as Distributed by MLS Grid
- 2026-01-20 Relisted — MRED as Distributed by MLS Grid
- 2026-01-14 Listing Removed — MRED as Distributed by MLS Grid
- 2026-01-08 Relisted — MRED as Distributed by MLS Grid
- 2026-01-05 Listing Removed — MRED as Distributed by MLS Grid
- 2025-10-22 Relisted — RMLSA as Distributed by MLS Grid
- 2025-10-22 Price Changed — RMLSA as Distributed by MLS Grid
- 2025-10-22 Listing Removed — RMLSA as Distributed by MLS Grid
- 2025-09-14 Pending — RMLSA as Distributed by MLS Grid
- 2025-09-08 Listed — RMLSA as Distributed by MLS Grid
- 2025-09-04 Listed $68,900 RMLSA as Distributed by MLS Grid
- 2021-08-06 Listing Removed — RMLSA as Distributed by MLS Grid
- 2021-08-06 Listing Removed — RMLSA as Distributed by MLS Grid
- 2021-08-06 Listing Removed — RMLSA as Distributed by MLS Grid
- 2021-08-06 Listing Removed — RMLSA as Distributed by MLS Grid
- 2018-09-04 Sold (MLS) $42,600 MRED as Distributed by MLS Grid
- 2018-09-04 Sold (MLS) $42,600 RMLSA as Distributed by MLS Grid
- 2018-08-10 Sold (Public Records) $43,000 Public Records
- 2018-05-01 Listed $45,000 MRED as Distributed by MLS Grid
- 2018-05-01 Listed $45,000 RMLSA as Distributed by MLS Grid
- 2015-08-10 Listing Removed — MRED as Distributed by MLS Grid
- 2010-01-11 Sold (Public Records) $50,000 Public Records
- 2010-01-11 Sold (MLS) $50,000 RMLSA as Distributed by MLS Grid
- 2010-01-11 Sold (MLS) $50,000 MRED as Distributed by MLS Grid
- 2009-02-09 Listed $57,000 RMLSA as Distributed by MLS Grid
- 2009-02-09 Listed $57,000 MRED as Distributed by MLS Grid
- 2003-06-04 Sold (Public Records) $38,000 Public Records
- 2002-12-24 Listing Removed — MRED as Distributed by MLS Grid
- 2002-10-09 Listing Removed — MRED as Distributed by MLS Grid
- 2002-06-24 Listing Removed — MRED as Distributed by MLS Grid
Property tax history
+13.8%/yrLatest (2025): $1,146 · +4.7% YoY. Source: county tax records.
Cash-flow waterfall
monthlySold comps — $/sqft
last 12 mo · ≤1 miLoading sold comps…