205 Granite Dr · Lucama, NC
Flood risk 1/10 · Minimal
- FEMA flood zone
- X (unshaded)
- Chance of flooding over 30 yrs
- 0.0%
- Est. flood insurance / yr
- $507 – $1,088
Fire risk 3/10 · Minor
- Est. fire insurance / yr
- $906 – $1,684
Heat risk 7/10 · Major
- Hot days now (above 108°F)
- 7 days/yr
- Hot days in 30 yrs
- 16 days/yr
Wind risk 8/10 · Major
- Chance of severe wind over 30 yrs
- 80.0%
Air-quality risk 3/10 · Minor
- Unhealthy air days now
- 2 days/yr
- Unhealthy air days in 30 yrs
- 3 days/yr
Risk factors via First Street. Map © Google.
Why this score? — see what drove the B grade
The composite is a weighted blend of 9 inputs, each scored 0–100. Each bar is that input's sub-score; the figure is the points it added to the 100-point composite (weight × sub-score).
- Cash flow +27.8/30.0
- DSCR +9.8/10.0
- 1% rule +7.7/10.0
- ARV discount +6.9/15.0
- Appreciation +6.9/10.0
- Schools +3.3/10.0
- Livability +2.9/5.0
- Rent growth +2.5/5.0
- Condition / age +2.5/5.0
$100,000
🖨 Deal sheet (PDF) 📄 Offer letter ✓ Due diligence
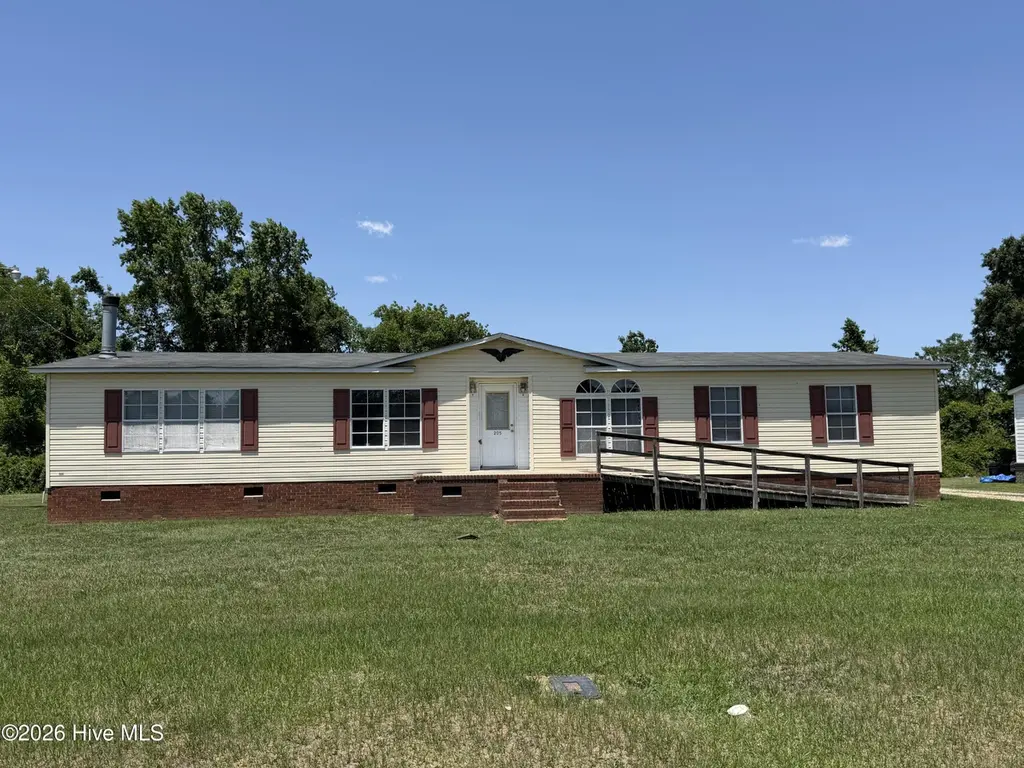
Listing remarks
Double wide on half an acre in Lucama. Lots of room in this open-floor-plan home. Great Room with fireplace, Formal Dining Area, Kitchen, and Den along with 3 Bedrooms and 2 Baths.
Key facts
- 0.52 acre lot
- Built 2007
Neighborhood map
What this means for you Summary
Snapshot
- This is a 3-bed/2.0-bath manufactured listed at $100k.
Deal economics
- At list price, monthly cash flow is $304 ($4k/yr) — positive.
- The deal already cash-flows at list — no discount required.
- Meets the 1% rule at list price ($1k rent vs $100k).
Location & tenants
- Location reads 57/100 on livability (#599 in NC) — a working-class tenant base; expect higher turnover. Strengths: cost of living A+, housing A+; Watch: crime F, amenities F, commute F.
- Wilson County Schools (rural): math 38% / reading 40% proficiency, ranked #119 of 178 in NC (top 67%) — families likely to look elsewhere, expect single-tenant / working-renter base with shorter leases.
- Zoned schools: Lucama Elementary (math 62% / reading 52%, grade C+, #249 of 1,410 statewide, top 20%, 362 students, 99% FRL); Springfield Middle (math 49% / reading 57%, grade C+, #93 of 475 statewide, top 19%, 445 students, 56% FRL); James Hunt High (math 67% / reading 58%, grade B-, #179 of 535 statewide, top 34%, 1,069 students, 60% FRL).
- Zoned-school proficiency averages 58% at this address vs 39% district-wide (+18 pts) — the actual schools serving this property are materially stronger than the Wilson County Schools average implies; a family-tenant draw the district grade alone would hide.
- Market conditions: 16 active listings in the ZIP; 580 units permitted in Wilson County in 2024 (168 in 5+ unit buildings).
Forward outlook
- In year one you build about $5k of equity ($691 loan paydown + $4k appreciation (3.8% local appreciation)).
- Wilson County population projected to shrink 5% by 2050 — rents likely to lag national; underwrite the cash flow, not the appreciation.
- At projected returns (3.8% appreciation + 3.0% rent growth), your $28k cash investment doubles in ~4 years — after that, you're playing with house money.
- By year 8, paydown + projected appreciation supports a ~$34k cash-out refi (75% LTV) — recoverable capital for the next deal without selling this one.
Negotiation context
- Only 0 days on market — expect competitive offers; lowballing is unlikely to land.
Risks & watch-outs
- Climate carrying-cost: severe wind risk, 80% chance of damaging wind over 30y; extreme-heat days projected 7→16/yr by 2055 (HVAC capex compounding) — expect insurance premiums to compound above CPI over the hold.
Questions for the listing agent
- Is there a deadline driving the sale (1031 exchange, divorce, estate, relocation)? That informs how much negotiation room exists.
- Schools are D-rated, which usually means shorter tenancies and higher turnover. Who's the typical renter profile here, and what's been the actual vacancy rate?
- Crime grade is F in this area — have there been break-ins, vandalism, or insurance claims at this property in the last 3 years? What carrier currently insures it and at what premium?
- What's the average days-on-market for RENTAL listings here right now (not sales)? A rising rental-DOM trend means longer vacancies and softer asking-rent achievability than the comps imply.
- What's the recent tenant-quality profile in this submarket — average credit score on applications, eviction rate, late-payment / NSF rate, and stable-employment percentage? A property-management company in the area should have these aggregated.
- How much new for-sale + rental construction is in the pipeline within 1–3 miles? Heavy new supply typically softens prices + rents 12–24 months out; constrained supply supports both.
Investment metrics
- 1% rule
- 1.27% ✓
- Cap rate
- 9.94%
- Cash-on-cash
- 13.01%
- DSCR
- 1.58
- GRM
- 6.6
CMA / ARV
- ARV (on-the-fly)
- $98,604
- Comps found
- 1
Show comp detail 1 sale within ~0.75 mi
| Address | Dist | Beds/Ba | Sqft | Sold | Price | $/sf | Match |
|---|---|---|---|---|---|---|---|
| 205 Granite Dr | 0.00mi | 3/2.0 | 1,862 (+2%) | 0mo | $100,000 | $54 | 96 |
Match score weights: distance 35% · size 25% · config 20% · recency 20%. Top-matched comps best support the ARV.
Projected returns pro-forma
3.82% appreciation · 3.0% rent growth · sell at horizon
- IRR
- 21.6%
- Equity multiple
- 2.28×
- Total profit
- $35,832
- Equity at exit
- $49,672
- IRR
- 22.0%
- Equity multiple
- 4.40×
- Total profit
- $95,225
- Equity at exit
- $80,432
Cash invested: $28,000 (down + closing). Projections, not guarantees.
Landlord ↔ Tenant lean methodology
- Overall (STATE)
- 85 Strongly Landlord-Friendly
- State North Carolina
- 85 Strongly Landlord-Friendly · R+3
- County
- — inherits STATE
- City
- — inherits STATE
ZIP-level market 27851
- Home prices YoY
- 1.6%
- Active inventory
- 16
- Price-to-rent
- 6.6×
Monthly cashflow live
- Estimated rent
- $1,271 medium interval (Pro) →
- Mortgage (P&I)
- −$524
- Tax from tax record
- −$134 /mo · $1,613/yr
- Insurance
- −$42
- HOA
- −$0
- Vacancy / Maint / Mgmt
- −$267
- Net cashflow
- $304
Break-even live
Sensitivity live
| Price | -10% $360 | -5% $332 | +0% $304 | +5% $275 | +10% $247 |
|---|---|---|---|---|---|
| Rent | -10% $203 | -5% $253 | +0% $304 | +5% $354 | +10% $404 |
| Rate | -1.0pp $354 | -0.5pp $329 | base $304 | +0.5pp $278 | +1.0pp $251 |
UW: 25.0% down · 7.5% · 30yr · 1.5% tax · 5.0% vac · 8.0% maint · 8.0% mgmt
Financing live
Cash to close
- Down payment
- $25,000
- Closing costs
- $3,000
- Reserves months
- —
- Total cash needed
- —
Loan-product check · same deal, 3 products live
Conventional
25% down · 7.5% · 30yr
- Down + closing
- —
- Monthly P&I
- —
- Monthly cashflow
- —
- DSCR
- —
- Eligible?
- —
Personal DTI + credit; lowest rate.
DSCR
20% down · 8.5% · 30yr
- Down + closing
- —
- Monthly P&I
- —
- Monthly cashflow
- —
- DSCR
- —
- Eligible?
- —
No personal income docs; deal must DSCR.
Hard money
10% down · 12.0% · 12mo
- Down + closing
- —
- Monthly P&I
- —
- Monthly cashflow
- —
- DSCR
- —
- Eligible?
- —
Short-term bridge; refi at stabilization.
Listing history 2 events
-
2026-06-03remarks 180-char remark
-
2026-06-03$100,000 Pending
ⓘ Source: listings_history table (triggers on properties + properties_extension) + one-shot
backfill from property_details.listing_events for pre-trigger history.
Tax reassessment forecast NC · Resets to sale price
- Current annual tax
- $1,613 · $134/mo
- Projected year-2 tax
- $1,613 · $134/mo
- Expected delta
- $0/yr ($0/mo · 0.0%)
ⓘ Screening estimate from a state-policy table — verify with the county assessor before closing.
Climate risk First Street
- Flood 1/10 Low FEMA zone X (unshaded) · 0% chance over 30 yrs
- Wildfire 3/10 Moderate
- Heat 7/10 Severe 7 d/yr ≥108°F today · 16 d/yr by 30 yrs out
- Wind 8/10 Severe 80% chance of damaging wind over 30 yrs
- Air quality 3/10 Moderate 2 unhealthy d/yr today · 3 by 30 yrs out
Nearby sold comps map
Loading sold comps map…
Walkable amenities ~0.75 mi
Loading nearby amenities…
Taxation est. · year 1
- Rental income
- $15,251
- − Mortgage interest
- −$5,602
- − Property taxes
- −$1,613
- − Insurance
- −$500
- − Repairs & maintenance
- −$1,220
- − Management
- −$1,220
- − Depreciation
- −$2,909
- Taxable income
- $2,188
- Est. tax owed @ 24.0%
- −$525
- After-tax cash flow
- $3,118/yr
For passive investors: Depreciation is non-cash, so a rental often shows a tax loss while cash-flowing — sheltering income. Rental losses are passive: they offset passive income freely, and up to $25,000/yr can offset ordinary (W-2) income if you actively participate and your MAGI is under $100k (phasing out to $0 by $150k); unused losses carry forward. On sale, claimed depreciation is recaptured at up to 25%, and gains may owe capital-gains tax (a 1031 exchange can defer both). Figures are a year-1 estimate at your 24.0% rate — not tax advice; consult a CPA.
Schools (NCES district)
- District
- Wilson County Schools
- NCES district ID
- 3705020
- Math proficiency
- 38% ▲ 2.00%
- Reading proficiency
- 40% ▼ -1.00%
- Median HH income
- $39,342
- Composite
- 32.64/100
- National rank
- #5665
- State rank
- #119 of 178 in NC
Livability — Lucama
- Score
- 57/100
- State rank
- #599
- US rank
- #21804
Category grades
Schools grade is shown separately in the Schools card above.
Census & demographics
- Census place
- Lucama, NC
- Population (ZIP)
- 5,366
Population outlook (Wilson County) Hauer SSP2
- Today (2025)
- 82,765 people
- By 2030
- 82,492 · -0.3%
- By 2040
- 81,054 · -2.1%
- By 2050
- 78,610 · -5.0%
- By 2075
- 71,865 · -13.2%
- By 2100
- 62,792 · -24.1%
Race, ethnicity, and origin ACS 2023
- Neighborhood character
- Majority White (65%)
- Race & ethnicity
- White 65% Black 23% Hispanic / Latino 7% Two or more races 6%
- Hispanic origin (detail)
- Mexican 6%
- Common ancestry
- Slovak 2% Lithuanian 1% German 1%
- Foreign-born
- 4% · Canada
- Languages at home
- 93% English-only · Spanish 7%
Political lean MEDSL · Wilson
- 2024 margin
- Toss-up / Even · D 49.8% · R 49.4%
- 2008→2024 swing
- -5.7pp toward R · 2008: 6.1pp · 2024: 0.4pp
- All cycles
- 2024: D+0.4 2020: D+2.9 2016: D+5.6 2012: D+7.3 2008: D+6.1
Not yet ingested
- Civics
- —
Market trends
- HPI YoY
- ▲ 3.82%
- Current HPI
- 239.7454
- Rent YoY
- —
- Metro
- —
- State GDP YoY
- ▲ 3.28%
- F500 in state
- 26
Industry mix (Fortune 500 HQ in NC)
| Industry | F500 HQs | Revenue |
|---|---|---|
| Financial Services | 2 | $213B |
|
||
| Retail | 2 | $95B |
|
||
| Industrial Conglomerate | 1 | $38B |
|
||
| Metals / Steel | 1 | $35B |
|
||
| Utilities | 1 | $30B |
|
||
| Industrial Machinery | 1 | $19B |
|
||
Price history
2 events — show timeline
- 2026-06-02 Listing Removed — Hive MLS
- 2026-06-01 Listed $100,000 Hive MLS
Property tax history
+2.8%/yrLatest (2025): $1,613 · +66.7% YoY. Source: county tax records.
Cash-flow waterfall
monthlySold comps — $/sqft
last 12 mo · ≤1 miLoading sold comps…