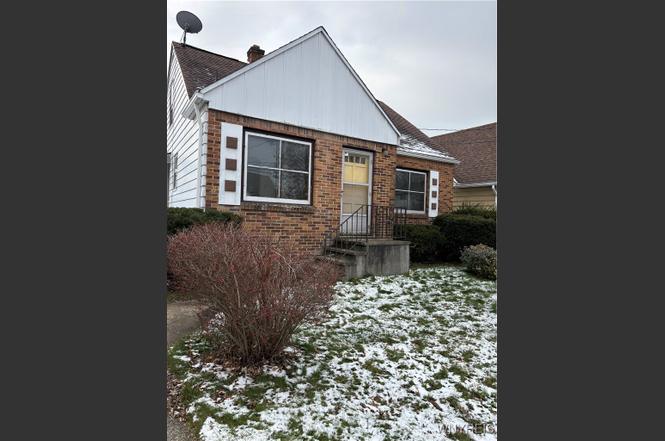
59 Martha Ave · Buffalo, NY
Flood risk 6/10 · Moderate
- FEMA flood zone
- X (unshaded)
- Chance of flooding over 30 yrs
- 0.71%
- Est. flood insurance / yr
- $473 – $860
Fire risk 1/10 · Minimal
- Est. fire insurance / yr
- $691 – $1,283
Heat risk 3/10 · Minor
- Hot days now (above 93°F)
- 7 days/yr
- Hot days in 30 yrs
- 15 days/yr
Wind risk 1/10 · Minimal
- Chance of severe wind over 30 yrs
- —
Air-quality risk 3/10 · Minor
- Unhealthy air days now
- 2 days/yr
- Unhealthy air days in 30 yrs
- 3 days/yr
Risk factors via First Street. Map © Google.
Why this score? — see what drove the D grade
The composite is a weighted blend of 9 inputs, each scored 0–100. Each bar is that input's sub-score; the figure is the points it added to the 100-point composite (weight × sub-score).
- Cash flow +13.3/30.0
- ARV discount +8.7/15.0
- DSCR +4.0/10.0
- Livability +3.9/5.0
- 1% rule +3.8/10.0
- Schools +3.3/10.0
- Rent growth +2.7/5.0
- Condition / age +2.5/5.0
- Appreciation +0.0/10.0
$159,900
🖨 Deal sheet (PDF) 📄 Offer letter ✓ Due diligence
Listing remarks MLS
Word to describe this house would be IMPECCABLE!! Extremely well maintained 3 bedroom 1 bath. Orginal owners. Very dry full finished basement with shower. Original woodwork and hardwood floors throughout. Extra room on second floor could be 4th bedroom/office. Landscaped yard. 1 car garage. Furniture available. This home is priced to sell and a must see!
Key facts
- 3,555 sq ft lot
- Garage
- Built 1950
Neighborhood map
What this means for you Summary
Snapshot
- This is a 3-bed/1.0-bath single-family listed at $160k.
Deal economics
- At list price, monthly cash flow is $1 ($14/yr) — positive.
- The deal already cash-flows at list — no discount required.
- To meet the 1% rule (rent ≥ 1% of price), the offer needs to be $140k (12.4% below list).
- Recommended offer: $140k (12.4% below list) — sets the bar for 1% rule.
- Cap rate 6.3% vs local median 8.0% in Buffalo — below-typical yield; the buyer is paying a premium for something (appreciation thesis, condition, location) that the cap rate doesn't capture.
Location & tenants
- Location reads 77/100 on livability (#195 in NY, #3,011 nationally) — a middle-class / working-renter tenant base. Strengths: commute A+, housing A+, health & safety A+; Watch: crime F, employment D-.
- Buffalo City School District (urban): math 41% / reading 40% proficiency, ranked #535 of 590 in NY (top 91%) — families likely to look elsewhere, expect single-tenant / working-renter base with shorter leases; 75% free/reduced lunch — lower-income household profile, screen leases tightly.
- Market conditions: Rents flat; 239 active listings in the ZIP; 24 comparable units currently listed for rent nearby; rentals lingering (median 45d on market — plan ~5-8 weeks vacancy on turnover, expect pricing pressure); 50% of comp listings sitting > 30 days — soft ceiling on asking rent; lower-income renter base — watch delinquency; 1,244 units permitted in Erie County in 2024 (563 in 5+ unit buildings).
- This rent runs 37% of the median local income ($45k/yr) — at the standard rent-burdened threshold; future hikes will face affordability resistance.
Forward outlook
- Local home prices are declining (-3.0%/yr); year-one equity from $1k of loan paydown is wiped out by about $5k of value loss. Plan a longer hold.
Negotiation context
- It's been on market 63 days — a 6% lower offer ($150k) is reasonable based on typical stale-listing flexibility.
- 4 sale attempts since 12y ago with the ask held roughly flat each time — persistent listings suggest the price (not the market) is what's stuck; bring a comps-based counter.
- Current owner paid $35k; list at $160k implies a 357% gain — meaningful room to come down on a strong offer.
Risks & watch-outs
- Watch-outs: built in 1950 — expect roof / HVAC / electrical / plumbing capex.
- Climate carrying-cost: major flood risk — expect insurance premiums to compound above CPI over the hold.
Questions for the listing agent
- It's been on market 63 days. Have you received any prior offers? Is the seller open to a 12% concession, seller financing, or rate buy-down credit?
- Built in 1950 — when were the roof, HVAC, electrical panel, plumbing, and water heater last replaced?
- Why hasn't it sold? Are there any deal-killer items the seller is aware of (foundation, flood, title, zoning, code violations)?
- Is there a deadline driving the sale (1031 exchange, divorce, estate, relocation)? That informs how much negotiation room exists.
- Crime grade is F in this area — have there been break-ins, vandalism, or insurance claims at this property in the last 3 years? What carrier currently insures it and at what premium?
- The area grade is low — what's the realistic commute time and amenity access for the typical tenant pool here? Any planned neighborhood developments (good or bad) we should know about?
- What's the average days-on-market for RENTAL listings here right now (not sales)? A rising rental-DOM trend means longer vacancies and softer asking-rent achievability than the comps imply.
- What's the recent tenant-quality profile in this submarket — average credit score on applications, eviction rate, late-payment / NSF rate, and stable-employment percentage? A property-management company in the area should have these aggregated.
- How much new for-sale + rental construction is in the pipeline within 1–3 miles? Heavy new supply typically softens prices + rents 12–24 months out; constrained supply supports both.
Investment metrics
- 1% rule
- 0.88% ✗
- Cap rate
- 6.30%
- Cash-on-cash
- 0.03%
- DSCR
- 1.00
- GRM
- 9.5
CMA / ARV
- ARV (on-the-fly)
- $164,096
- Comps found
- 12
Show comp detail 12 sales within ~0.75 mi
| Address | Dist | Beds/Ba | Sqft | Sold | Price | $/sf | Match |
|---|---|---|---|---|---|---|---|
| 59 Martha Ave | 0.00mi | 3/1.0 | 1,282 (0%) | 1mo | $149,000 | $116 | 99 |
| 496 Berkshire Ave | 0.49mi | 3/1.0 | 1,266 (-1%) | 1mo | $125,000 | $99 | 74 |
| 37 Elmer Ave | 0.44mi | 4/1.0 (+1) | 1,327 (+4%) | 0mo | $170,000 | $128 | 69 |
| 157 Roosevelt Ave | 0.19mi | 4/2.0 (+1) | 1,394 (+9%) | 4mo | $200,000 | $143 | 64 |
| 212 Easton Ave | 0.53mi | 4/1.0 (+1) | 1,248 (-3%) | 3mo | $220,000 | $176 | 63 |
| 153 Stockbridge Ave | 0.68mi | 3/1.0 | 1,248 (-3%) | 3mo | $150,000 | $120 | 61 |
| 99 Fennimore Ave | 0.32mi | 3/1.0 | 1,100 (-14%) | 3mo | $115,000 | $105 | 59 |
| 358 Hastings Ave | 0.59mi | 3/1.0 | 1,152 (-10%) | 2mo | $128,500 | $112 | 54 |
| 90 Alma Ave | 0.52mi | 2/2.0 (-1) | 1,360 (+6%) | 3mo | $105,000 | $77 | 54 |
| 601 Lasalle Ave | 0.73mi | 4/1.0 (+1) | 1,188 (-7%) | 1mo | $165,000 | $139 | 48 |
| 322 Phyllis Ave | 0.52mi | 2/1.0 (-1) | 1,098 (-14%) | 0mo | $175,000 | $159 | 47 |
| 28 Cedar Rd | 0.71mi | 3/1.5 | 1,407 (+10%) | 3mo | $240,000 | $171 | 46 |
Match score weights: distance 35% · size 25% · config 20% · recency 20%. Top-matched comps best support the ARV.
Projected returns pro-forma
-3.0% appreciation · 0.67% rent growth · sell at horizon
- IRR
- -18.9%
- Equity multiple
- 0.35×
- Total profit
- $-29,026
- Equity at exit
- $23,842
- IRR
- -17.0%
- Equity multiple
- 0.16×
- Total profit
- $-37,660
- Equity at exit
- $13,825
Cash invested: $44,772 (down + closing). Projections, not guarantees.
Landlord ↔ Tenant lean methodology
- Overall (STATE)
- 15 Strongly Tenant-Friendly
- State New York
- 15 Strongly Tenant-Friendly · D+10
- County
- — inherits STATE
- City
- — inherits STATE
ZIP-level market 14215
- Home prices YoY
- -30.0%
- Rents YoY
- 0.7%
- Active inventory
- 239
- Price-to-rent
- 9.5×
Monthly cashflow live
- Estimated rent
- $1,400 high interval (Pro) →
- Mortgage (P&I)
- −$839
- Tax est. 1.5%
- −$200 /mo · $2,398/yr
- Insurance
- −$67
- HOA
- −$0
- Vacancy / Maint / Mgmt
- −$294
- Net cashflow
- $1
Break-even live
Sensitivity live
| Price | -10% $112 | -5% $56 | +0% $1 | +5% $-54 | +10% $-109 |
|---|---|---|---|---|---|
| Rent | -10% $-109 | -5% $-54 | +0% $1 | +5% $56 | +10% $112 |
| Rate | -1.0pp $82 | -0.5pp $42 | base $1 | +0.5pp $-40 | +1.0pp $-82 |
UW: 25.0% down · 7.5% · 30yr · 1.5% tax · 5.0% vac · 8.0% maint · 8.0% mgmt
Financing live
Cash to close
- Down payment
- $39,975
- Closing costs
- $4,797
- Reserves months
- —
- Total cash needed
- —
Loan-product check · same deal, 3 products live
Conventional
25% down · 7.5% · 30yr
- Down + closing
- —
- Monthly P&I
- —
- Monthly cashflow
- —
- DSCR
- —
- Eligible?
- —
Personal DTI + credit; lowest rate.
DSCR
20% down · 8.5% · 30yr
- Down + closing
- —
- Monthly P&I
- —
- Monthly cashflow
- —
- DSCR
- —
- Eligible?
- —
No personal income docs; deal must DSCR.
Hard money
10% down · 12.0% · 12mo
- Down + closing
- —
- Monthly P&I
- —
- Monthly cashflow
- —
- DSCR
- —
- Eligible?
- —
Short-term bridge; refi at stabilization.
Rent comps 24 comps
| Address | Beds | Baths | Sqft | Rent | $/sqft | DOM | Units | Dist |
|---|---|---|---|---|---|---|---|---|
| 97 Davidson Ave Buffalo, NY | 3.0 | 1.0 | 925 | $1,495 | $1.62 | 3d | 1 | 0.22mi |
| 17 Proctor Ave Unit 1 Buffalo, NY | 2.0 | 1.0 | 900 | $1,100 | $1.22 | 45d | 1 | 0.52mi |
| 189 Westminster Ave Buffalo, NY | 4.0 | 1.5 | 1065 | $1,595 | $1.50 | 11d | 1 | 0.54mi |
| 74 Dorris Ave Buffalo, NY | 3.0 | 1.0 | 1200 | $1,450 | $1.21 | 45d | 1 | 0.57mi |
| 71 Gerald Ave Buffalo, NY | 2.0 | 1.0 | 1773 | $1,100 | $0.62 | 45d | 1 | 0.63mi |
| 140 Parkridge Ave Buffalo, NY | 3.0 | 1.0 | 990 | $1,500 | $1.52 | 45d | 1 | 0.64mi |
| 220 Dartmouth Ave Buffalo, NY | 2.0 | 1.0 | 1000 | $1,100 | $1.10 | 25d | 1 | 0.72mi |
| 249 Newburgh Ave Unit 2 Buffalo, NY | 2.0 | 1.0 | 930 | $1,300 | $1.40 | 45d | 1 | 0.87mi |
| 90 Sussex St Unit 2 Buffalo, NY | 2.0 | 1.0 | 1000 | $1,000 | $1.00 | 45d | 1 | 0.88mi |
| 61 Courtland Ave Unit Lower Buffalo, NY | 2.0 | 1.0 | 1000 | $1,300 | $1.30 | 45d | 1 | 0.91mi |
| 216 Newburgh Ave Buffalo, NY | 2.0 | 1.0 | 1690 | $1,150 | $0.68 | 25d | 1 | 0.93mi |
| 263 Minnesota Ave Unit Upper Buffalo, NY | 3.0 | 1.0 | 1242 | $1,500 | $1.21 | 15d | 1 | 0.95mi |
| 103 Preston Rd Unit Lower Cheektowaga, NY | 2.0 | 1.0 | 882 | $1,300 | $1.47 | 4d | 1 | 0.97mi |
| 265 Lisbon Ave Unit 2 Buffalo, NY | 3.0 | 1.0 | 1200 | $1,400 | $1.17 | 45d | 1 | 0.99mi |
| 222 Lisbon Ave Buffalo, NY | 4.0 | 1.0 | 1300 | $1,400 | $1.08 | 25d | 1 | 1.06mi |
| 222 Lisbon Ave Unit Upper Buffalo, NY | 3.0 | 1.0 | 1400 | $1,400 | $1.00 | 45d | 1 | 1.06mi |
| 89 Lasalle Ave Buffalo, NY | 1.0–4.0 | 1.0–4.0 | 1024 | $2,291 | $2.24 | 3d | 10 | 1.17mi |
| 92 Lasalle Ave Unit 1 Buffalo, NY | 2.0 | 1.0 | 1000 | $1,150 | $1.15 | 45d | 1 | 1.18mi |
| 85 Blake St Unit 1 Buffalo, NY | 4.0 | 2.0 | 1022 | $1,000 | $0.98 | 45d | 1 | 1.23mi |
| 40 Lisbon Ave Unit Upper Buffalo, NY | 2.0 | 1.0 | 1057 | $1,500 | $1.42 | 12d | 1 | 1.30mi |
| 65 Domedion Ave Buffalo, NY | 3.0 | 1.0 | 1632 | $1,500 | $0.92 | 3d | 1 | 1.37mi |
| 50 Pine Ridge Ter Unit 3 Cheektowaga, NY | 2.0 | 1.0 | 900 | $1,400 | $1.56 | 18d | 1 | 1.37mi |
| 26 Custer St Buffalo, NY | 2.0 | 1.0 | 1000 | $1,300 | $1.30 | 45d | 1 | 1.41mi |
| 44 Aurora Dr Buffalo, NY | 3.0 | 1.0 | 1272 | $3,300 | $2.59 | 3d | 1 | 1.44mi |
Listing history 8 events
-
2026-03-27status Pending
-
2026-01-31status Active
-
2026-01-29status Pending
-
2026-01-22$159,900 Active
-
2025-10-14historical
-
2024-11-11$159,900 Active
-
2015-01-30soldstatus $35,000 356-char remark
Show marketing remark (356 chars)
Word to describe this house would be IMPECCABLE!! Extremely well maintained 3 bedroom 1 bath. Orginal owners. Very dry full finished basement with shower. Original woodwork and hardwood floors throughout. Extra room on second floor could be 4th bedroom/office. Landscaped yard. 1 car garage. Furniture available. This home is priced to sell and a must see!
-
2014-09-25$35,000 356-char remark
Show marketing remark (356 chars)
Word to describe this house would be IMPECCABLE!! Extremely well maintained 3 bedroom 1 bath. Orginal owners. Very dry full finished basement with shower. Original woodwork and hardwood floors throughout. Extra room on second floor could be 4th bedroom/office. Landscaped yard. 1 car garage. Furniture available. This home is priced to sell and a must see!
ⓘ Source: listings_history table (triggers on properties + properties_extension) + one-shot
backfill from property_details.listing_events for pre-trigger history.
Climate risk First Street
- Flood 6/10 Major FEMA zone X (unshaded) · 71% chance over 30 yrs
- Wildfire 1/10 Low
- Heat 3/10 Moderate 7 d/yr ≥93°F today · 15 d/yr by 30 yrs out
- Wind 1/10 Low
- Air quality 3/10 Moderate 2 unhealthy d/yr today · 3 by 30 yrs out
Nearby sold comps map
Loading sold comps map…
Walkable amenities ~0.75 mi
Loading nearby amenities…
Taxation est. · year 1
- Rental income
- $16,803
- − Mortgage interest
- −$8,957
- − Property taxes
- −$2,398
- − Insurance
- −$800
- − Repairs & maintenance
- −$1,344
- − Management
- −$1,344
- − Depreciation
- −$4,652
- Taxable loss
- −$2,692
- Est. tax savings @ 24.0%
- +$646
- After-tax cash flow
- $660/yr
For passive investors: Depreciation is non-cash, so a rental often shows a tax loss while cash-flowing — sheltering income. Rental losses are passive: they offset passive income freely, and up to $25,000/yr can offset ordinary (W-2) income if you actively participate and your MAGI is under $100k (phasing out to $0 by $150k); unused losses carry forward. On sale, claimed depreciation is recaptured at up to 25%, and gains may owe capital-gains tax (a 1031 exchange can defer both). Figures are a year-1 estimate at your 24.0% rate — not tax advice; consult a CPA.
Schools (NCES district)
- District
- Buffalo City School District
- NCES district ID
- 3605850
- Math proficiency
- 41% ▲ 11.00%
- Reading proficiency
- 40% ▲ 7.00%
- Median HH income
- $31,665
- Composite
- 33.17/100
- National rank
- #5544
- State rank
- #535 of 590 in NY
Livability — Buffalo
- Score
- 77/100
- State rank
- #195
- US rank
- #3011
Category grades
Schools grade is shown separately in the Schools card above.
Census & demographics
- Census place
- Buffalo, NY
- County
- Erie County · 714,559 people
- City population
- 440,021
- Metro
- Buffalo-Cheektowaga, NY
- Population (ZIP)
- 42,524
- Household income
- $44,955
- Rent vs Own
- Severe rent burden
- 2873.0
Population outlook (Erie County) Hauer SSP2
- Today (2025)
- 933,037 people
- By 2030
- 935,181 · +0.2%
- By 2040
- 928,531 · -0.5%
- By 2050
- 905,725 · -2.9%
- By 2075
- 834,037 · -10.6%
- By 2100
- 708,033 · -24.1%
Race, ethnicity, and origin ACS 2023
- Neighborhood character
- Predominantly Black (67%)
- Race & ethnicity
- Black 67% White 15% Asian 7% Hispanic / Latino 6% Two or more races 6%
- Hispanic origin (detail)
- Puerto Rican 4%
- Common ancestry
- Romanian 4% Lithuanian 1% Italian 1%
- Foreign-born
- 9% · Canada, China
- Languages at home
- 88% English-only · Other Indo-European 4% Spanish 4% Chinese 1%
Political lean MEDSL · Erie
- 2024 margin
- Lean D (+9.7) · D 54.8% · R 45.2%
- 2008→2024 swing
- -7.9pp toward R · 2008: 17.5pp · 2024: 9.7pp
- All cycles
- 2024: D+9.7 2020: D+14.7 2016: D+4.8 2012: D+15.6 2008: D+17.5
Not yet ingested
- Civics
- —
Market trends
- HPI YoY
- ▼ -126.29%
- Current HPI
- 295.2966
- Rent YoY
- ▲ 0.67%
- Metro
- Buffalo-Cheektowaga, NY
- State GDP YoY
- ▲ 2.60%
- F500 in state
- 92
Industry mix (Fortune 500 HQ in NY)
| Industry | F500 HQs | Revenue |
|---|---|---|
| Financial Services | 10 | $950B |
|
||
| Consumer Goods | 9 | $162B |
|
||
| Insurance | 4 | $225B |
|
||
| Telecommunications | 2 | $144B |
|
||
| Pharmaceuticals | 2 | $112B |
|
||
| Media / Entertainment | 2 | $69B |
|
||
Price history
+356.9% since first listed8 events — show timeline
- 2026-03-27 Pending — WNYREIS
- 2026-01-31 Relisted — WNYREIS
- 2026-01-29 Pending — WNYREIS
- 2026-01-22 Listed $159,900 WNYREIS
- 2025-10-14 Listing Removed — WNYREIS
- 2024-11-11 Listed $159,900 WNYREIS
- 2015-01-30 Sold (MLS) $35,000 WNYREIS
- 2014-09-25 Listed $35,000 WNYREIS
Property tax history
+5.3%/yrLatest (2025): $258 · +0.0% YoY. Source: county tax records.
Cash-flow waterfall
monthlySold comps — $/sqft
last 12 mo · ≤1 miLoading sold comps…