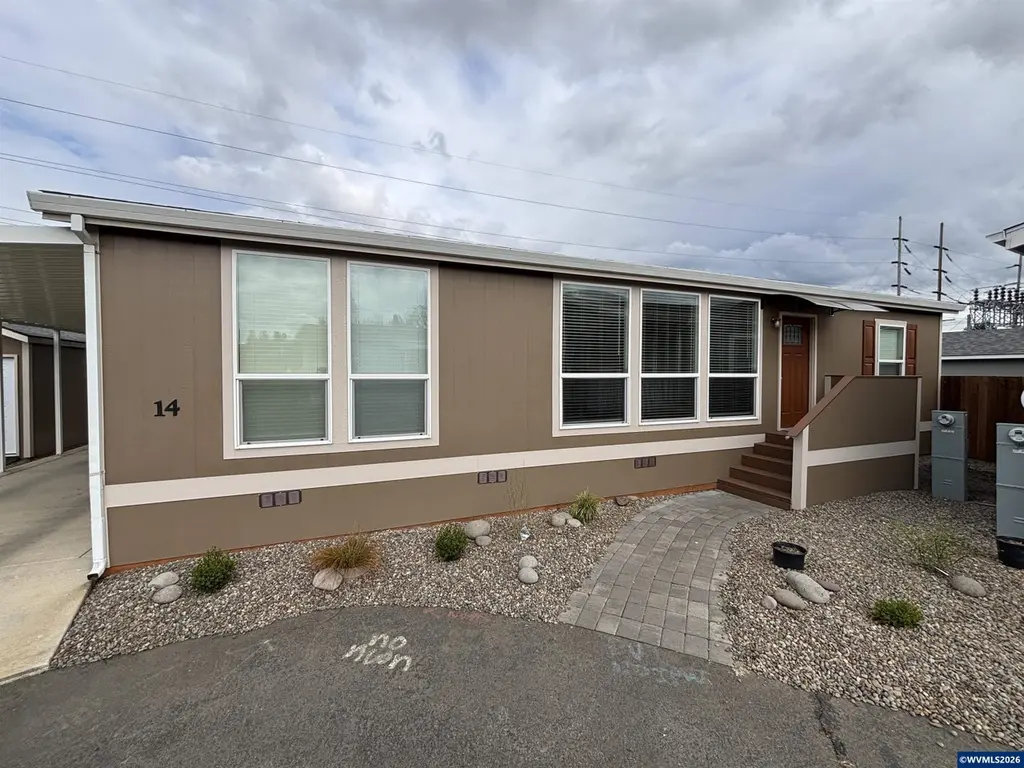
1220 Monmouth St #14 · Independence, OR
Flood risk 1/10 · Minimal
- FEMA flood zone
- X (unshaded)
- Chance of flooding over 30 yrs
- 0.0%
- Est. flood insurance / yr
- $507 – $1,088
Fire risk 2/10 · Minimal
- Est. fire insurance / yr
- $498 – $926
Heat risk 3/10 · Minor
- Hot days now (above 92°F)
- 7 days/yr
- Hot days in 30 yrs
- 13 days/yr
Wind risk 1/10 · Minimal
- Chance of severe wind over 30 yrs
- —
Air-quality risk 9/10 · Severe
- Unhealthy air days now
- 11 days/yr
- Unhealthy air days in 30 yrs
- 11 days/yr
Risk factors via First Street. Map © Google.
Why this score? — see what drove the D grade
The composite is a weighted blend of 9 inputs, each scored 0–100. Each bar is that input's sub-score; the figure is the points it added to the 100-point composite (weight × sub-score).
- Cash flow +16.6/30.0
- DSCR +5.2/10.0
- 1% rule +4.5/10.0
- Condition / age +4.0/5.0
- Rent growth +3.8/5.0
- Livability +3.2/5.0
- Schools +3.1/10.0
- ARV discount +0.0/15.0
- Appreciation +0.0/10.0
$189,000
🖨 Deal sheet (PDF) 📄 Offer letter ✓ Due diligence
Listing remarks MLS
Wonderful 2015 home on quiet cul-de-sac in centrally located Hazel Glen Court, an All Ages park just East of Central High School. Vaulted great room design with Primary suite oposite of the guest rooms, all with walk-in closets. Butcher block island in well appointed kitchen with stainless appliances. Home has central air conditioning, LVP, and warm color pallet. Carport is 31 feet deep, storage shed is 10x12. Sunny yard, great for garden boxes rounds out this lovely home.
Key facts
- Stainless appliances
- Storage shed
- Sunny yard
Tags
Neighborhood map
What this means for you Summary
Snapshot
- This is a 3-bed/2.0-bath manufactured listed at $189k. Condition is rated good.
Deal economics
- At list price, monthly cash flow is $115 ($1k/yr) — positive.
- The deal already cash-flows at list — no discount required.
- To meet the 1% rule (rent ≥ 1% of price), the offer needs to be $180k (4.8% below list).
- Recommended offer: $178k (6.0% below list) — sets the bar for market timing.
- Cap rate 7.0% vs local median 3.5% in Independence — top-decile yield for the area; either an underpriced asset or a hidden risk that comps aren't pricing in. Stress-test before assuming the spread holds.
Location & tenants
- Location reads 65/100 on livability (#194 in OR) — a middle-class / working-renter tenant base. Strengths: housing A+, commute A, crime B; Watch: employment D+, health & safety D+, amenities F.
- Central SD 13J (town): math 26% / reading 41% proficiency, ranked #149 of 183 in OR (top 81%) — families likely to look elsewhere, expect single-tenant / working-renter base with shorter leases.
- Zoned schools: Ash Creek Elementary School (473 students, 65% FRL); Talmadge Middle School (740 students, 64% FRL); Central High School (1,100 students, 65% FRL).
- Market conditions: Rents rising fast (+5.4%/yr); 47 active listings in the ZIP; 22 comparable units currently listed for rent nearby; rentals at typical pace (median 25d on market — plan ~3-4 weeks tenant-placement turnaround); solid renter incomes; 177 units permitted in Polk County in 2024 (14 in 5+ unit buildings).
Forward outlook
- Local home prices are declining (-3.0%/yr); year-one equity from $1k of loan paydown is wiped out by about $6k of value loss. Plan a longer hold.
- Polk County population projected at +25% by 2050 — long-run rental-demand tailwind backs the buy-and-hold thesis.
Negotiation context
- It's been on market 82 days — a 6% lower offer ($178k) is reasonable based on typical stale-listing flexibility.
Questions for the listing agent
- It's been on market 82 days. Have you received any prior offers? Is the seller open to a 6% concession, seller financing, or rate buy-down credit?
- Why hasn't it sold? Are there any deal-killer items the seller is aware of (foundation, flood, title, zoning, code violations)?
- Is there a deadline driving the sale (1031 exchange, divorce, estate, relocation)? That informs how much negotiation room exists.
- Schools are F-rated, which usually means shorter tenancies and higher turnover. Who's the typical renter profile here, and what's been the actual vacancy rate?
- The area grade is low — what's the realistic commute time and amenity access for the typical tenant pool here? Any planned neighborhood developments (good or bad) we should know about?
- What's the average days-on-market for RENTAL listings here right now (not sales)? A rising rental-DOM trend means longer vacancies and softer asking-rent achievability than the comps imply.
- What's the recent tenant-quality profile in this submarket — average credit score on applications, eviction rate, late-payment / NSF rate, and stable-employment percentage? A property-management company in the area should have these aggregated.
- How much new for-sale + rental construction is in the pipeline within 1–3 miles? Heavy new supply typically softens prices + rents 12–24 months out; constrained supply supports both.
Investment metrics
- 1% rule
- 0.95% ✗
- Cap rate
- 7.02%
- Cash-on-cash
- 2.60%
- DSCR
- 1.12
- GRM
- 8.8
CMA / ARV
- ARV (median comp)
- $132,897
- List price
- $189,000
- Delta
- 42.22%
- Verdict
- OVERPRICED
- Comps
- 4 within 1.0 mi
Show comp detail 9 sales within ~0.75 mi
| Address | Dist | Beds/Ba | Sqft | Sold | Price | $/sf | Match |
|---|---|---|---|---|---|---|---|
| 1220 Monmouth St #40 | 0.02mi | 3/2.0 | 1,300 (+4%) | 23mo | $195,000 | $150 | 73 |
| 1220 Monmouth St #13 | 0.02mi | 3/2.0 | 1,160 (-7%) | 19mo | $195,000 | $168 | 71 |
| 1220 Monmouth St #37 | 0.02mi | 3/2.0 | 1,340 (+7%) | 19mo | $130,000 | $97 | 71 |
| 1220 Monmouth St #22 | 0.02mi | 2/2.0 (-1) | 1,280 (+3%) | 23mo | $215,000 | $168 | 71 |
| 141 S 17th St #15 | 0.56mi | 3/2.0 | 1,188 (-5%) | 7mo | $180,000 | $152 | 60 |
| 1220 Monmouth St #19 | 0.02mi | 2/2.0 (-1) | 1,368 (+10%) | 23mo | $95,000 | $69 | 58 |
| 141 S 17th St #54 | 0.58mi | 3/2.0 | 1,400 (+12%) | 20mo | $125,000 | $89 | 36 |
| 141 S 17th St #67 | 0.56mi | 2/2.0 (-1) | 1,404 (+12%) | 16mo | $175,000 | $125 | 35 |
| 141 S 17th St #78 | 0.56mi | 3/2.0 | 1,416 (+14%) | 20mo | $93,500 | $66 | 34 |
Match score weights: distance 35% · size 25% · config 20% · recency 20%. Top-matched comps best support the ARV.
Projected returns pro-forma
-3.0% appreciation · 5.37% rent growth · sell at horizon
- IRR
- -9.5%
- Equity multiple
- 0.64×
- Total profit
- $-18,903
- Equity at exit
- $28,181
- IRR
- 2.8%
- Equity multiple
- 1.23×
- Total profit
- $11,968
- Equity at exit
- $16,341
Cash invested: $52,920 (down + closing). Projections, not guarantees.
Landlord ↔ Tenant lean methodology
- Overall (STATE)
- 28 Tenant-Leaning
- State Oregon
- 28 Tenant-Leaning · D+6
- County
- — inherits STATE
- City
- — inherits STATE
ZIP-level market 97351
- Home prices YoY
- -24.8%
- Rents YoY
- 5.4%
- Active inventory
- 47
- Price-to-rent
- 8.8×
Monthly cashflow live
- Estimated rent
- $1,799 high interval (Pro) →
- Mortgage (P&I)
- −$991
- Tax est. 1.5%
- −$236 /mo · $2,835/yr
- Insurance
- −$79
- HOA
- −$0
- Vacancy / Maint / Mgmt
- −$378
- Net cashflow
- $115
Break-even live
Sensitivity live
| Price | -10% $245 | -5% $180 | +0% $115 | +5% $49 | +10% $-16 |
|---|---|---|---|---|---|
| Rent | -10% $-27 | -5% $44 | +0% $115 | +5% $186 | +10% $257 |
| Rate | -1.0pp $210 | -0.5pp $163 | base $115 | +0.5pp $66 | +1.0pp $16 |
UW: 25.0% down · 7.5% · 30yr · 1.5% tax · 5.0% vac · 8.0% maint · 8.0% mgmt
Financing live
Cash to close
- Down payment
- $47,250
- Closing costs
- $5,670
- Reserves months
- —
- Total cash needed
- —
Loan-product check · same deal, 3 products live
Conventional
25% down · 7.5% · 30yr
- Down + closing
- —
- Monthly P&I
- —
- Monthly cashflow
- —
- DSCR
- —
- Eligible?
- —
Personal DTI + credit; lowest rate.
DSCR
20% down · 8.5% · 30yr
- Down + closing
- —
- Monthly P&I
- —
- Monthly cashflow
- —
- DSCR
- —
- Eligible?
- —
No personal income docs; deal must DSCR.
Hard money
10% down · 12.0% · 12mo
- Down + closing
- —
- Monthly P&I
- —
- Monthly cashflow
- —
- DSCR
- —
- Eligible?
- —
Short-term bridge; refi at stabilization.
Rent comps 22 comps
| Address | Beds | Baths | Sqft | Rent | $/sqft | DOM | Units | Dist |
|---|---|---|---|---|---|---|---|---|
| 1400 E St Independence, OR | 2.0–3.0 | 1.0–2.0 | 962 | $1,725 | $1.79 | 15d | 2 | 0.24mi |
| 205 N Gun Club Rd Unit 123 Independence, OR | 2.0 | 1.0 | 868 | $1,400 | $1.61 | 25d | 1 | 0.29mi |
| 1408 Falcon Loop Unit 1408 Independence, OR | 3.0 | 2.0 | 1056 | $1,795 | $1.70 | 15d | 1 | 0.30mi |
| 1439 Falcon Loop Unit 1439 Independence, OR | 3.0 | 2.5 | 1262 | $1,895 | $1.50 | 25d | 1 | 0.36mi |
| 1630 Monmouth St Unit 1630-20 Independence, OR | 2.0 | 1.5 | 900 | $1,375 | $1.53 | 25d | 1 | 0.52mi |
| 1630 Monmouth St Independence, OR | 2.0 | 1.5 | 900 | $1,375 | $1.53 | 15d | 1 | 0.53mi |
| 1422 Marigold Dr Independence, OR | 3.0 | 2.5 | 1380 | $1,995 | $1.45 | 45d | 1 | 0.61mi |
| 675 White Oak Cir Independence, OR | 2.0 | 2.0 | 923 | $1,675 | $1.81 | 15d | 5 | 0.64mi |
| 800 S 4th St Unit 800-08 Independence, OR | 2.0 | 1.0 | 775 | $1,250 | $1.61 | 25d | 1 | 0.72mi |
| 75 C St Independence, OR | 1.0–2.0 | 1.0–2.0 | 946 | $2,250 | $2.38 | 15d | 8 | 0.91mi |
| 314 Monmouth Independence Hwy Monmouth, OR | 3.0 | 1.0 | 1100 | $1,795 | $1.63 | 45d | 1 | 0.92mi |
| 1021 Main St E Unit 1021-1 Monmouth, OR | 2.0 | 1.0 | 800 | $1,450 | $1.81 | 45d | 1 | 1.11mi |
| 201 Deann Dr Independence, OR | 1.0–3.0 | 1.0–2.0 | 966 | $2,184 | $2.26 | 15d | 22 | 1.26mi |
| 501 Catron St N Monmouth, OR | 2.0 | 2.0 | 1090 | $1,450 | $1.33 | 15d | 1 | 1.36mi |
| 523 Catron St N Unit 523-11 Monmouth, OR | 2.0 | 2.0 | 1090 | $1,400 | $1.28 | 45d | 1 | 1.36mi |
| 523 Catron St N Unit 523-05 Monmouth, OR | 2.0 | 2.0 | 1090 | $1,450 | $1.33 | 25d | 1 | 1.36mi |
| 537 Catron St N Unit 537-05 Monmouth, OR | 2.0 | 2.0 | 1090 | $1,400 | $1.28 | 45d | 1 | 1.39mi |
| 163 Catron St N Unit 163-02 Monmouth, OR | 2.0 | 1.0 | 760 | $1,395 | $1.84 | 45d | 1 | 1.40mi |
| 468 Catron St N Monmouth, OR | 3.0 | 2.5 | 1300 | $1,895 | $1.46 | 15d | 1 | 1.42mi |
| 4373 Independence Hwy Independence, OR | 2.0 | 1.0 | 982 | $1,199 | $1.22 | 15d | 1 | 1.47mi |
| 4311 Independence Hwy Unit 4353 Independence, OR | 2.0 | 1.0 | 982 | $1,199 | $1.22 | 25d | 1 | 1.47mi |
| 4311 Independence Hwy Unit 4365 Independence, OR | 2.0 | 1.0 | 982 | $1,299 | $1.32 | 25d | 1 | 1.47mi |
Listing history 17 events
-
2026-06-22days on market $189,000 Active 82 DOM
-
2026-06-18days on market $189,000 Active 79 DOM
-
2026-06-17days on market $189,000 Active 78 DOM
-
2026-06-16days on market $189,000 Active 77 DOM
-
2026-06-15days on market $189,000 Active 76 DOM
-
2026-06-14days on market $189,000 Active 74 DOM
-
2026-06-10days on market $189,000 Active 71 DOM
-
2026-06-09days on market $189,000 Active 70 DOM
-
2026-06-08days on market $189,000 Active 69 DOM
-
2026-06-07days on market $189,000 Active 68 DOM
-
2026-06-05days on market $189,000 Active 65 DOM
-
2026-06-03days on market $189,000 Active 64 DOM
-
2026-06-02days on market $189,000 Active 63 DOM
-
2026-06-01days on market $189,000 Active 62 DOM
-
2026-05-31days on market $189,000 Active 61 DOM
-
2026-05-30days on market $189,000 Active 60 DOM
-
2026-03-31$195,000 Active 478-char remark
Show marketing remark (478 chars)
Wonderful 2015 home on quiet cul-de-sac in centrally located Hazel Glen Court, an All Ages park just East of Central High School. Vaulted great room design with Primary suite oposite of the guest rooms, all with walk-in closets. Butcher block island in well appointed kitchen with stainless appliances. Home has central air conditioning, LVP, and warm color pallet. Carport is 31 feet deep, storage shed is 10x12. Sunny yard, great for garden boxes rounds out this lovely home.
ⓘ Source: listings_history table (triggers on properties + properties_extension) + one-shot
backfill from property_details.listing_events for pre-trigger history.
Climate risk First Street
- Flood 1/10 Low FEMA zone X (unshaded) · 0% chance over 30 yrs
- Wildfire 2/10 Low
- Heat 3/10 Moderate 7 d/yr ≥92°F today · 13 d/yr by 30 yrs out
- Wind 1/10 Low
- Air quality 9/10 Extreme 11 unhealthy d/yr today · 11 by 30 yrs out
Nearby sold comps map
Loading sold comps map…
Walkable amenities ~0.75 mi
Loading nearby amenities…
Taxation est. · year 1
- Rental income
- $21,582
- − Mortgage interest
- −$10,587
- − Property taxes
- −$2,835
- − Insurance
- −$945
- − Repairs & maintenance
- −$1,727
- − Management
- −$1,727
- − Depreciation
- −$5,498
- Taxable loss
- −$1,736
- Est. tax savings @ 24.0%
- +$417
- After-tax cash flow
- $1,793/yr
For passive investors: Depreciation is non-cash, so a rental often shows a tax loss while cash-flowing — sheltering income. Rental losses are passive: they offset passive income freely, and up to $25,000/yr can offset ordinary (W-2) income if you actively participate and your MAGI is under $100k (phasing out to $0 by $150k); unused losses carry forward. On sale, claimed depreciation is recaptured at up to 25%, and gains may owe capital-gains tax (a 1031 exchange can defer both). Figures are a year-1 estimate at your 24.0% rate — not tax advice; consult a CPA.
Condition & rehab AI · 12 photos
This 2015 manufactured home is in good condition with a cosmetic rehab level, featuring stainless steel appliances, granite countertops, and vinyl plank flooring. It is located on a quiet cul-de-sac with a carport and storage shed, making it a great investment opportunity.
Value-add opportunities
- Both Paint exterior trim — Enhances curb appeal and value
- Both Clean gutters — Improves drainage and property value
Renovation cost estimate screening
Value-add ROI direction
- Both Paint exterior trim — Enhances curb appeal and value ↑
- Both Clean gutters — Improves drainage and property value ↑
ⓘ Cost ranges are severity-bucket heuristics (US national rule-of-thumb). Get contractor quotes + a written scope before underwriting a rehab budget.
Schools (NCES district)
- District
- Central SD 13J
- NCES district ID
- 4102840
- Math proficiency
- 26% ▼ -3.00%
- Reading proficiency
- 41% ▼ -2.00%
- Median HH income
- $42,374
- Composite
- 31.04/100
- National rank
- #11310
- State rank
- #149 of 183 in OR
Livability — Independence
- Score
- 65/100
- State rank
- #194
- US rank
- #12576
Category grades
Schools grade is shown separately in the Schools card above.
Census & demographics
- Census place
- Independence, OR
- County
- Polk County · 84,240 people
- City population
- 11,454
- Metro
- Salem, OR
- Population (ZIP)
- 11,454
- Household income
- $88,519
- Rent vs Own
- Severe rent burden
- 211.0
Population outlook (Polk County) Hauer SSP2
- Today (2025)
- 88,594 people
- By 2030
- 93,209 · +5.2%
- By 2040
- 101,942 · +15.1%
- By 2050
- 110,395 · +24.6%
- By 2075
- 131,091 · +48.0%
- By 2100
- 141,746 · +60.0%
Race, ethnicity, and origin ACS 2023
- Neighborhood character
- Diverse neighborhood (Simpson 0.55)
- Race & ethnicity
- White 57% Hispanic / Latino 36% Two or more races 14% Native American 1%
- Hispanic origin (detail)
- Mexican 33% Puerto Rican 1%
- Common ancestry
- Italian 3% Slovak 2% Portuguese 2%
- Foreign-born
- 9% · Canada, Dominican Republic
- Languages at home
- 77% English-only · Spanish 22%
Political lean MEDSL · Polk
- 2024 margin
- Toss-up / Even · D 46.6% · R 50.4% · Other 3.0%
- 2008→2024 swing
- -3.3pp toward R · 2008: -0.5pp · 2024: -3.8pp
- All cycles
- 2024: R+3.8 2020: R+1.7 2016: R+7.0 2012: R+4.8 2008: R+0.5
Not yet ingested
- Civics
- —
Market trends
- HPI YoY
- ▼ -114.45%
- Current HPI
- 346.7564
- Rent YoY
- ▲ 5.37%
- Metro
- Salem, OR
- State GDP YoY
- ▲ 2.05%
- F500 in state
- 2
Industry mix (Fortune 500 HQ in OR)
| Industry | F500 HQs | Revenue |
|---|---|---|
| Consumer Goods | 1 | $51B |
|
||
Price history
1 event — show timeline
- 2026-03-31 Listed $195,000 WVMLS
Cash-flow waterfall
monthlySold comps — $/sqft
last 12 mo · ≤1 miLoading sold comps…