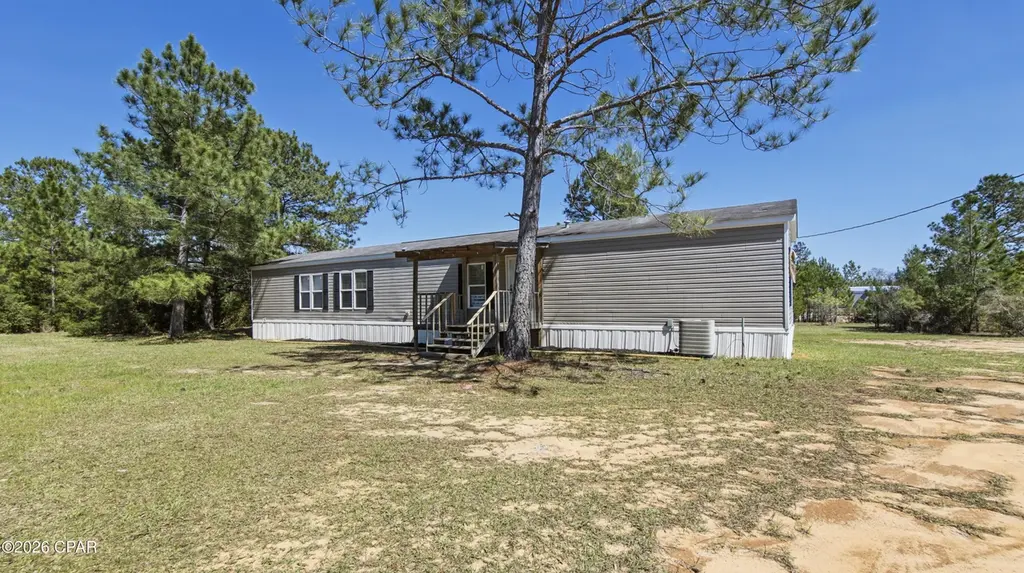
1884 Bayview Ln · Alford, FL
Flood risk 1/10 · Minimal
- FEMA flood zone
- X (unshaded)
- Chance of flooding over 30 yrs
- 0.0%
- Est. flood insurance / yr
- $507 – $1,088
Fire risk 6/10 · Moderate
- Est. fire insurance / yr
- $947 – $1,759
Heat risk 8/10 · Major
- Hot days now (above 107°F)
- 7 days/yr
- Hot days in 30 yrs
- 20 days/yr
Wind risk 9/10 · Severe
- Chance of severe wind over 30 yrs
- 99.0%
Air-quality risk 2/10 · Minimal
- Unhealthy air days now
- 0 days/yr
- Unhealthy air days in 30 yrs
- 1 days/yr
Risk factors via First Street. Map © Google.
Why this score? — see what drove the D+ grade
The composite is a weighted blend of 9 inputs, each scored 0–100. Each bar is that input's sub-score; the figure is the points it added to the 100-point composite (weight × sub-score).
- Cash flow +13.7/30.0
- Appreciation +10.0/10.0
- ARV discount +5.8/15.0
- DSCR +4.2/10.0
- Schools +4.2/10.0
- 1% rule +3.8/10.0
- Livability +3.0/5.0
- Rent growth +2.5/5.0
- Condition / age +2.5/5.0
$129,900
🖨 Deal sheet 📄 Offer letter ✓ Due diligence
Listing remarks
Move-in ready 3-bedroom, 2-bath home situated on a spacious 0.50-acre lot in Cottondale's Parrot Bay subdivision. This 2015 home offers 1,216 sq ft of comfortable living space with brand-new flooring throughout, new kitchen appliances, and new exterior skirting for added curb appeal and durability. The large lot provides plenty of room for outdoor living, storage, or future improvements. Perfect for first-time buyers or investors seeking an affordable property with recent updates. Utilize the outdoor storage building. Ask about available lender credits and zero-down payment assistance programs for qualified buyers, making homeownership more accessible than ever. Schedule your showing today!
Key facts
- Spacious lot
- Move in ready
- 0.5 acre lot
Tags
Property features AI
Finance
- HOA & community: Short-term rentals allowed
Exterior
- Utilities: Electricity available
- Home design: Single-wide mobile home; Mobile home zoning
- Construction: Vinyl siding; Composition/shingle roof
- Exterior features: Cul-de-sac lot; Lot dimensions approximately 100 x 218
Interior
- Kitchen: Electric oven
- Bedrooms: One bedroom on the first floor (approximately 11 x 11)
- Bathrooms: 2 full bathrooms
- Heating & cooling: Electric heating
- Interior features: Total of 3 rooms
- Laundry & utility: Electric water heater
Neighborhood map
What this means for you Summary
Snapshot
- This is a 3-bed/2.0-bath manufactured listed at $130k.
Deal economics
- At list price, monthly cash flow is $10 ($123/yr) — positive.
- The deal already cash-flows at list — no discount required.
- To meet the 1% rule (rent ≥ 1% of price), the offer needs to be $115k (11.5% below list).
- Recommended offer: $115k (11.5% below list) — sets the bar for 1% rule.
- Cap rate 6.4% vs local median 2.8% in Alford — top-decile yield for the area; either an underpriced asset or a hidden risk that comps aren't pricing in. Stress-test before assuming the spread holds.
Location & tenants
- Location reads 59/100 on livability (#819 in FL) — a working-class tenant base; expect higher turnover. Strengths: cost of living A+, housing A+; Watch: crime D, health & safety D, schools F.
- Jackson (rural): math 47% / reading 54% proficiency, ranked #39 of 73 in FL (top 53%) — acceptable for families but not a draw, mixed tenant base, ~2y average lease.
- Market conditions: 45 active listings in the ZIP; 153 units permitted in Jackson County in 2024 (40 in 5+ unit buildings).
Forward outlook
- In year one you build about $14k of equity ($898 loan paydown + $13k appreciation (10.0% local appreciation)).
- Jackson County population projected at -18% by 2050 — secular population decline; favor cash flow + early exit over multi-decade hold.
- At projected returns (10.0% appreciation + 3.0% rent growth), your $36k cash investment doubles in ~3 years — after that, you're playing with house money.
- By year 3, paydown + projected appreciation supports a ~$35k cash-out refi (75% LTV) — recoverable capital for the next deal without selling this one.
Negotiation context
- It's been on market 26 days — a 2% lower offer ($128k) is reasonable based on typical stale-listing flexibility.
Risks & watch-outs
- Climate carrying-cost: severe wind risk, 99% chance of damaging wind over 30y; major wildfire risk; extreme-heat days projected 7→20/yr by 2055 (HVAC capex compounding) — expect insurance premiums to compound above CPI over the hold.
Questions for the listing agent
- Is there a deadline driving the sale (1031 exchange, divorce, estate, relocation)? That informs how much negotiation room exists.
- Schools are F-rated, which usually means shorter tenancies and higher turnover. Who's the typical renter profile here, and what's been the actual vacancy rate?
- Crime grade is D in this area — have there been break-ins, vandalism, or insurance claims at this property in the last 3 years? What carrier currently insures it and at what premium?
- The area grade is low — what's the realistic commute time and amenity access for the typical tenant pool here? Any planned neighborhood developments (good or bad) we should know about?
- What's the average days-on-market for RENTAL listings here right now (not sales)? A rising rental-DOM trend means longer vacancies and softer asking-rent achievability than the comps imply.
- What's the recent tenant-quality profile in this submarket — average credit score on applications, eviction rate, late-payment / NSF rate, and stable-employment percentage? A property-management company in the area should have these aggregated.
- How much new for-sale + rental construction is in the pipeline within 1–3 miles? Heavy new supply typically softens prices + rents 12–24 months out; constrained supply supports both.
Investment metrics
- 1% rule
- 0.88% ✗
- Cap rate
- 6.39%
- Cash-on-cash
- 0.34%
- DSCR
- 1.02
- GRM
- 9.4
CMA / ARV
- ARV (on-the-fly)
- $125,248
- Comps found
- 2
Show comp detail 2 sales within ~0.75 mi
| Address | Dist | Beds/Ba | Sqft | Sold | Price | $/sf | Match |
|---|---|---|---|---|---|---|---|
| 1884 Bayview Ln | 0.00mi | 3/2.0 | 1,216 (0%) | 1mo | $125,000 | $103 | 99 |
| 1811 Quail Roost Dr | 0.38mi | 3/2.0 | 1,344 (+10%) | 14mo | $52,500 | $39 | 53 |
Match score weights: distance 35% · size 25% · config 20% · recency 20%. Top-matched comps best support the ARV.
Projected returns pro-forma
10.0% appreciation · 3.0% rent growth · sell at horizon
- IRR
- 24.5%
- Equity multiple
- 2.96×
- Total profit
- $71,416
- Equity at exit
- $117,024
- IRR
- 21.7%
- Equity multiple
- 6.77×
- Total profit
- $209,831
- Equity at exit
- $252,367
Cash invested: $36,372 (down + closing). Projections, not guarantees.
Landlord ↔ Tenant lean methodology
- Overall (STATE)
- 87 Strongly Landlord-Friendly
- State Florida
- 87 Strongly Landlord-Friendly · R+3
- County
- — inherits STATE
- City
- — inherits STATE
ZIP-level market 32431
- Home prices YoY
- 7.3%
- Active inventory
- 45
- Price-to-rent
- 9.4×
Monthly cashflow live
- Estimated rent
- $1,149 medium interval (Pro) →
- Mortgage (P&I)
- −$681
- Tax est. 1.5%
- −$162 /mo · $1,948/yr
- Insurance
- −$54
- HOA
- −$0
- Vacancy / Maint / Mgmt
- −$241
- Net cashflow
- $10
Break-even live
UW: 25.0% down · 7.5% · 30yr · 1.5% tax · 5.0% vac · 8.0% maint · 8.0% mgmt
Financing live
Cash to close
- Down payment
- $32,475
- Closing costs
- $3,897
- Reserves months
- —
- Total cash needed
- —
Loan-product check · same deal, 3 products live
Conventional
25% down · 7.5% · 30yr
- Down + closing
- —
- Monthly P&I
- —
- Monthly cashflow
- —
- DSCR
- —
- Eligible?
- —
Personal DTI + credit; lowest rate.
DSCR
20% down · 8.5% · 30yr
- Down + closing
- —
- Monthly P&I
- —
- Monthly cashflow
- —
- DSCR
- —
- Eligible?
- —
No personal income docs; deal must DSCR.
Hard money
10% down · 12.0% · 12mo
- Down + closing
- —
- Monthly P&I
- —
- Monthly cashflow
- —
- DSCR
- —
- Eligible?
- —
Short-term bridge; refi at stabilization.
Listing history 3 events
-
2026-04-29status Pending
-
2026-04-20price $129,900
-
2026-04-02$139,900 Active
ⓘ Source: listings_history table (triggers on properties + properties_extension) + one-shot
backfill from property_details.listing_events for pre-trigger history.
Climate risk First Street
- Flood 1/10 Low FEMA zone X (unshaded) · 0% chance over 30 yrs
- Wildfire 6/10 Major
- Heat 8/10 Severe 7 d/yr ≥107°F today · 20 d/yr by 30 yrs out
- Wind 9/10 Extreme 99% chance of damaging wind over 30 yrs
- Air quality 2/10 Low 0 unhealthy d/yr today · 1 by 30 yrs out
Nearby sold comps map
Loading sold comps map…
Walkable amenities ~0.75 mi
Loading nearby amenities…
Taxation est. · year 1
- Rental income
- $13,792
- − Mortgage interest
- −$7,276
- − Property taxes
- −$1,948
- − Insurance
- −$650
- − Repairs & maintenance
- −$1,103
- − Management
- −$1,103
- − Depreciation
- −$3,779
- Taxable loss
- −$2,068
- Est. tax savings @ 24.0%
- +$496
- After-tax cash flow
- $619/yr
For passive investors: Depreciation is non-cash, so a rental often shows a tax loss while cash-flowing — sheltering income. Rental losses are passive: they offset passive income freely, and up to $25,000/yr can offset ordinary (W-2) income if you actively participate and your MAGI is under $100k (phasing out to $0 by $150k); unused losses carry forward. On sale, claimed depreciation is recaptured at up to 25%, and gains may owe capital-gains tax (a 1031 exchange can defer both). Figures are a year-1 estimate at your 24.0% rate — not tax advice; consult a CPA.
Schools (NCES district)
- District
- Jackson
- NCES district ID
- 1200960
- Math proficiency
- 47% ▼ -9.00%
- Reading proficiency
- 54% ▼ -3.00%
- Median HH income
- $36,824
- Composite
- 41.92/100
- National rank
- #3358
- State rank
- #39 of 73 in FL
Livability — Alford
- Score
- 59/100
- State rank
- #819
- US rank
- #20017
Category grades
Schools grade is shown separately in the Schools card above.
Census & demographics
- Population (ZIP)
- 4,887
Population outlook (Jackson County) Hauer SSP2
- Today (2025)
- 46,095 people
- By 2030
- 44,432 · -3.6%
- By 2040
- 41,077 · -10.9%
- By 2050
- 37,587 · -18.5%
- By 2075
- 28,921 · -37.3%
- By 2100
- 19,332 · -58.1%
Race, ethnicity, and origin ACS 2023
- Neighborhood character
- Predominantly White (80%)
- Race & ethnicity
- White 80% Black 16% Two or more races 4%
- Common ancestry
- Hispanic 4% Serbian 2% Slovak 2%
- Foreign-born
- 2% · Canada
- Languages at home
- 98% English-only · French/Haitian/Cajun 1% Spanish 1%
Political lean MEDSL · Jackson
- 2024 margin
- Solid R (+46.1) · D 26.7% · R 72.7%
- 2008→2024 swing
- -18.0pp toward R · 2008: -28.0pp · 2024: -46.1pp
- All cycles
- 2024: R+46.1 2020: R+38.9 2016: R+37.4 2012: R+29.0 2008: R+28.0
Not yet ingested
- Civics
- —
Market trends
- HPI YoY
- ▲ 14.20%
- Current HPI
- 208.19
- Rent YoY
- —
- Metro
- —
- State GDP YoY
- ▲ 3.28%
- F500 in state
- 36
Industry mix (Fortune 500 HQ in FL)
| Industry | F500 HQs | Revenue |
|---|---|---|
| Industrial Technology | 2 | $29B |
|
||
| Insurance | 2 | $17B |
|
||
| Retail | 1 | $60B |
|
||
| Technology Distribution | 1 | $58B |
|
||
| Homebuilding | 1 | $35B |
|
||
| Technology Manufacturing | 1 | $35B |
|
||
Price history
-7.1% since first listed3 events — show timeline
- 2026-04-29 Pending — CPARMLS
- 2026-04-20 Price Changed $129,900 CPARMLS
- 2026-04-02 Listed $139,900 CPARMLS
Property tax history
+13.8%/yrLatest (2025): $231 · +7.1% YoY. Source: county tax records.
Cash-flow waterfall
monthlySold comps — $/sqft
last 12 mo · ≤1 miLoading sold comps…