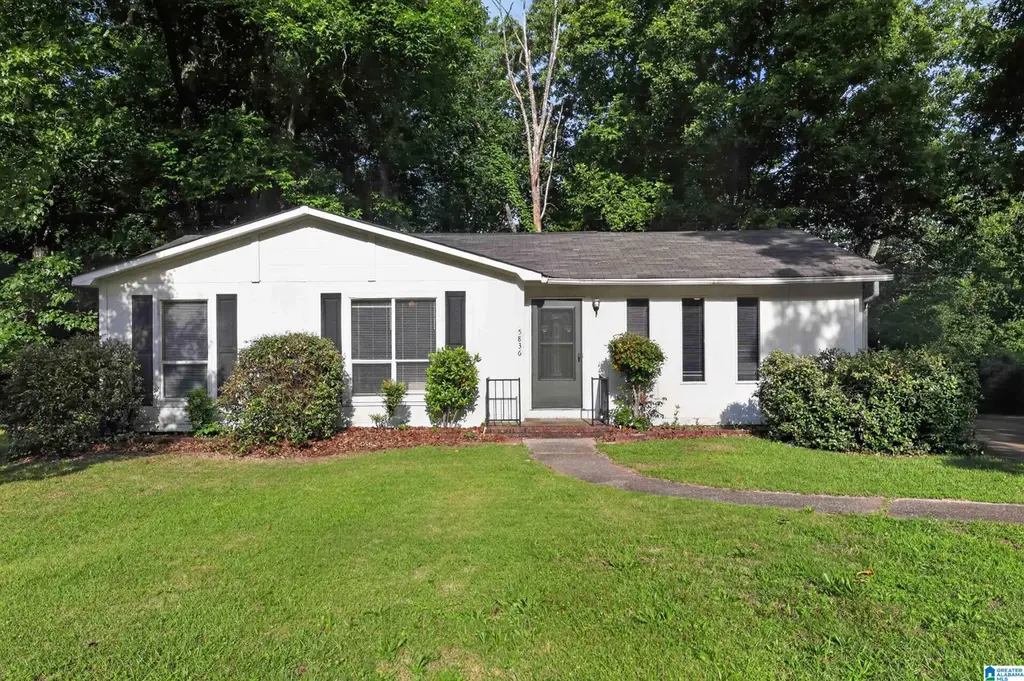
5836 Willow Ridge Rd · Pinson, AL
Flood risk 1/10 · Minimal
- FEMA flood zone
- X (unshaded)
- Chance of flooding over 30 yrs
- 0.0%
- Est. flood insurance / yr
- $507 – $1,088
Fire risk 3/10 · Minor
- Est. fire insurance / yr
- $916 – $1,700
Heat risk 5/10 · Moderate
- Hot days now (above 105°F)
- 7 days/yr
- Hot days in 30 yrs
- 18 days/yr
Wind risk 6/10 · Moderate
- Chance of severe wind over 30 yrs
- 27.0%
Air-quality risk 5/10 · Moderate
- Unhealthy air days now
- 6 days/yr
- Unhealthy air days in 30 yrs
- 9 days/yr
Risk factors via First Street. Map © Google.
Why this score? — see what drove the C- grade
The composite is a weighted blend of 9 inputs, each scored 0–100. Each bar is that input's sub-score; the figure is the points it added to the 100-point composite (weight × sub-score).
- Cash flow +21.8/30.0
- ARV discount +10.3/15.0
- DSCR +7.0/10.0
- 1% rule +5.1/10.0
- Livability +3.0/5.0
- Rent growth +2.9/5.0
- Condition / age +2.5/5.0
- Schools +1.8/10.0
- Appreciation +0.0/10.0
$154,900
🖨 Deal sheet 📄 Offer letter ✓ Due diligence
Listing remarks MLS
3 bedroom, 2 bath features hardwoods in dining room and foyer. Fenced in backyard.
Key facts
- Private lot
- Fenced-in backyard
- 0.34 acre lot
Tags
Property features AI
Finance
- Other: Lot size approximately 0.34 acres
Exterior
- Parking: Driveway parking
- Utilities: Public water; Electric water heater; Internet service available
- Home design: Existing construction; Single-family property (subdivision: Willow Ridge)
- Construction: Vinyl siding; Slab foundation
- Exterior features: Open deck; No pool; No patio; No garden/patio area; Not waterfront; Flood plain: No; No lot view noted
Interior
- Kitchen: Solid surface countertops; Electric cooktop; Built-in dishwasher; Electric oven; Refrigerator
- Bedrooms: Master bedroom on main level; Two additional bedrooms on main level
- Flooring: Carpet; Hardwood laminate
- Bathrooms: One full bathroom with garden tub
- Heating & cooling: Central heating; Central electric cooling
- Interior features: Ceilings described as 'Other (See Remarks)'; No additional built-in interior features listed
- Laundry & utility: Laundry on main level; Washer hookup; Electric dryer hookup; Laundry located in a closet
Neighborhood map
What this means for you Summary
Snapshot
- This is a 3-bed/1.0-bath single-family listed at $155k.
Deal economics
- At list price, monthly cash flow is $241 ($3k/yr) — positive.
- The deal already cash-flows at list — no discount required.
- Meets the 1% rule at list price ($2k rent vs $155k).
- Recommended offer: $153k (1.5% below list) — sets the bar for market timing.
- Cap rate 8.2% vs local median 5.3% in Pinson — top-decile yield for the area; either an underpriced asset or a hidden risk that comps aren't pricing in. Stress-test before assuming the spread holds.
Location & tenants
- Location reads 60/100 on livability (#289 in AL) — a middle-class / working-renter tenant base. Strengths: cost of living A+, housing A+, crime B+; Watch: amenities F, commute F, health & safety F.
- Jefferson County (suburban): math 9% / reading 32% proficiency, ranked #104 of 129 in AL (top 81%) — low school quality limits family demand, transient renter base, plan for 1-2y turnover.
- Zoned schools: Pinson Elementary School (801 students, 54% FRL); Pinson Valley High School (math 6% / reading 17%, grade F, #246 of 305 statewide, top 81%, 1,029 students, 81% FRL) — zoned schools average 68% FRL vs 49% district-wide (19 pts higher); higher-poverty schools than district average — tighter screening recommended.
- Market conditions: Rents rising (+1.6%/yr); 186 active listings in the ZIP; 8 comparable units currently listed for rent nearby; rentals at typical pace (median 21d on market — plan ~3-4 weeks tenant-placement turnaround); solid renter incomes; 2,114 units permitted in Jefferson County in 2024 (556 in 5+ unit buildings).
Forward outlook
- Local home prices are declining (-3.0%/yr); year-one equity from $1k of loan paydown is wiped out by about $5k of value loss. Plan a longer hold.
- Jefferson County population projected to shrink 4% by 2050 — rents likely to lag national; underwrite the cash flow, not the appreciation.
Negotiation context
- It's been on market 21 days — a 2% lower offer ($153k) is reasonable based on typical stale-listing flexibility.
- 3 sale attempts since 13y ago with the ask held roughly flat each time — persistent listings suggest the price (not the market) is what's stuck; bring a comps-based counter.
Risks & watch-outs
- Climate carrying-cost: major wind risk, 27% chance of damaging wind over 30y; extreme-heat days projected 7→18/yr by 2055 (HVAC capex compounding) — expect insurance premiums to compound above CPI over the hold.
Questions for the listing agent
- Built in 1977 — when were the roof, HVAC, electrical panel, plumbing, and water heater last replaced?
- Is there a deadline driving the sale (1031 exchange, divorce, estate, relocation)? That informs how much negotiation room exists.
- Schools are D-rated, which usually means shorter tenancies and higher turnover. Who's the typical renter profile here, and what's been the actual vacancy rate?
- What's the average days-on-market for RENTAL listings here right now (not sales)? A rising rental-DOM trend means longer vacancies and softer asking-rent achievability than the comps imply.
- What's the recent tenant-quality profile in this submarket — average credit score on applications, eviction rate, late-payment / NSF rate, and stable-employment percentage? A property-management company in the area should have these aggregated.
- How much new for-sale + rental construction is in the pipeline within 1–3 miles? Heavy new supply typically softens prices + rents 12–24 months out; constrained supply supports both.
Investment metrics
- 1% rule
- 1.01% ✓
- Cap rate
- 8.16%
- Cash-on-cash
- 6.67%
- DSCR
- 1.30
- GRM
- 8.2
CMA / ARV
- ARV (on-the-fly)
- $165,308
- Comps found
- 10
Show comp detail 10 sales within ~0.75 mi
| Address | Dist | Beds/Ba | Sqft | Sold | Price | $/sf | Match |
|---|---|---|---|---|---|---|---|
| 5150 Amberwood Ln | 0.12mi | 3/1.0 | 1,128 (-2%) | 2mo | $155,000 | $137 | 89 |
| 5781 Desoto Dr | 0.12mi | 3/1.0 | 1,150 (-0%) | 20mo | $145,000 | $126 | 77 |
| 5135 Amberwood Ln | 0.16mi | 3/2.0 | 1,135 (-2%) | 11mo | $162,000 | $143 | 76 |
| 5819 Balboa Ter | 0.14mi | 3/2.0 | 1,104 (-4%) | 10mo | $159,900 | $145 | 73 |
| 5943 Honeysuckle Cir | 0.36mi | 3/1.0 | 1,120 (-3%) | 14mo | $150,000 | $134 | 66 |
| 5740 Balboa Ter | 0.20mi | 3/1.0 | 1,104 (-4%) | 22mo | $110,000 | $100 | 64 |
| 5270 Willow Ridge Dr | 0.39mi | 3/2.0 | 1,120 (-3%) | 23mo | $199,000 | $178 | 54 |
| 5100 Willow Ridge Dr | 0.32mi | 3/2.0 | 1,290 (+12%) | 12mo | $150,000 | $116 | 52 |
| 6128 Summer Side Dr | 0.50mi | 4/2.5 (+1) | 1,136 (-2%) | 20mo | $259,000 | $228 | 47 |
| 5437 Balboa Ave | 0.67mi | 3/2.5 | 1,290 (+12%) | 2mo | $230,000 | $178 | 42 |
Match score weights: distance 35% · size 25% · config 20% · recency 20%. Top-matched comps best support the ARV.
Projected returns pro-forma
-3.0% appreciation · 1.61% rent growth · sell at horizon
- IRR
- -7.6%
- Equity multiple
- 0.73×
- Total profit
- $-11,927
- Equity at exit
- $23,096
- IRR
- 0.2%
- Equity multiple
- 1.02×
- Total profit
- $671
- Equity at exit
- $13,393
Cash invested: $43,372 (down + closing). Projections, not guarantees.
Landlord ↔ Tenant lean methodology
- Overall (STATE)
- 90 Strongly Landlord-Friendly
- State Alabama
- 90 Strongly Landlord-Friendly · R+15
- County
- — inherits STATE
- City
- — inherits STATE
ZIP-level market 35126
- Home prices YoY
- -22.4%
- Rents YoY
- 1.6%
- Active inventory
- 186
- Price-to-rent
- 8.2×
Monthly cashflow live
- Estimated rent
- $1,569 high interval (Pro) →
- Mortgage (P&I)
- −$812
- Tax from tax record
- −$121 /mo · $1,458/yr
- Insurance
- −$65
- HOA
- −$0
- Vacancy / Maint / Mgmt
- −$329
- Net cashflow
- $241
Break-even live
UW: 25.0% down · 7.5% · 30yr · 1.5% tax · 5.0% vac · 8.0% maint · 8.0% mgmt
Financing live
Cash to close
- Down payment
- $38,725
- Closing costs
- $4,647
- Reserves months
- —
- Total cash needed
- —
Loan-product check · same deal, 3 products live
Conventional
25% down · 7.5% · 30yr
- Down + closing
- —
- Monthly P&I
- —
- Monthly cashflow
- —
- DSCR
- —
- Eligible?
- —
Personal DTI + credit; lowest rate.
DSCR
20% down · 8.5% · 30yr
- Down + closing
- —
- Monthly P&I
- —
- Monthly cashflow
- —
- DSCR
- —
- Eligible?
- —
No personal income docs; deal must DSCR.
Hard money
10% down · 12.0% · 12mo
- Down + closing
- —
- Monthly P&I
- —
- Monthly cashflow
- —
- DSCR
- —
- Eligible?
- —
Short-term bridge; refi at stabilization.
Rent comps 8 comps
| Address | Beds | Baths | Sqft | Rent | $/sqft | DOM | Units | Dist |
|---|---|---|---|---|---|---|---|---|
| 5764 Desoto Dr Pinson, AL | 3.0 | 1.5 | 1104 | $1,225 | $1.11 | 1d | 1 | 0.15mi |
| 5944 Tyler Loop Rd Pinson, AL | 3.0 | 2.0 | 1247 | $1,485 | $1.19 | 23d | 1 | 0.34mi |
| 4464 Winchester Hills Ln Pinson, AL | 3.0 | 2.0 | 1500 | $1,750 | $1.17 | 11d | 1 | 0.85mi |
| 4464 Winchester Hills Way Birmingham, AL | 3.0 | 2.0 | 1178 | $1,750 | $1.49 | 43d | 1 | 0.86mi |
| 1104 Oak Creek Trl NE Birmingham, AL | 3.0 | 2.0 | 1233 | $1,543 | $1.25 | 1d | 1 | 0.91mi |
| 2504 Beechwood Trl Pinson, AL | 3.0 | 2.0 | 1359 | $1,435 | $1.06 | 21d | 1 | 1.04mi |
| 4246 Centerwood Dr Birmingham, AL | 3.0 | 2.0 | 1336 | $1,450 | $1.09 | 16d | 1 | 1.22mi |
| 2561 Gaylon St Birmingham, AL | 3.0 | 1.5 | 1318 | $1,345 | $1.02 | 21d | 1 | 1.35mi |
Listing history 24 events
-
2026-06-18days on market $154,900 Active 21 DOM
-
2026-06-17days on market $154,900 Active 20 DOM
-
2026-06-16days on market $154,900 Active 19 DOM
-
2026-06-15days on market $154,900 Active 18 DOM
-
2026-06-13days on market $154,900 Active 16 DOM
-
2026-06-10days on market $154,900 Active 13 DOM
-
2026-06-09days on market $154,900 Active 12 DOM
-
2026-06-08days on market $154,900 Active 11 DOM
-
2026-06-07days on market $154,900 Active 10 DOM
-
2026-06-03days on market $154,900 Active 6 DOM
-
2026-06-02days on market $154,900 Active 5 DOM
-
2026-06-01days on market $154,900 Active 4 DOM
-
2026-05-31days on market $154,900 Active 3 DOM
-
2026-05-28$154,900 Active
-
2024-03-12soldstatus $417,784,000
-
2016-09-23soldstatus $58,000 Sold 82-char remark
Show marketing remark (82 chars)
3 bedroom, 2 bath features hardwoods in dining room and foyer. Fenced in backyard.
-
2016-08-12historical 82-char remark
Show marketing remark (82 chars)
3 bedroom, 2 bath features hardwoods in dining room and foyer. Fenced in backyard.
-
2016-06-17status Pending 82-char remark
Show marketing remark (82 chars)
3 bedroom, 2 bath features hardwoods in dining room and foyer. Fenced in backyard.
-
2016-05-26$52,000 Active 82-char remark
Show marketing remark (82 chars)
3 bedroom, 2 bath features hardwoods in dining room and foyer. Fenced in backyard.
-
2013-10-03soldstatus $84,900
-
2013-09-26soldstatus $84,900 321-char remark
Show marketing remark (321 chars)
Hardwoods in Dining Room & Foyer. Updated Baths. Crown Molding. Fabulous, Big, Fenced Back Yard for Kids! Deck & Patio for Entertaining. Per Seller: Kitchen Countertops ~ 2011; Tile Backsplash in Kitchen ~ 2011; Hardwoods in Dining Room & Foyer ~ 2011. Roof ~ 2013, Gutters ~ 2013. Qualifies USDA Rural.
-
2013-05-09$84,900 321-char remark
Show marketing remark (321 chars)
Hardwoods in Dining Room & Foyer. Updated Baths. Crown Molding. Fabulous, Big, Fenced Back Yard for Kids! Deck & Patio for Entertaining. Per Seller: Kitchen Countertops ~ 2011; Tile Backsplash in Kitchen ~ 2011; Hardwoods in Dining Room & Foyer ~ 2011. Roof ~ 2013, Gutters ~ 2013. Qualifies USDA Rural.
-
2004-07-02soldstatus $79,000
-
1993-09-28soldstatus $57,250
ⓘ Source: listings_history table (triggers on properties + properties_extension) + one-shot
backfill from property_details.listing_events for pre-trigger history.
Tax reassessment forecast AL · Resets to sale price
- Current annual tax
- $1,458 · $121/mo
- Projected year-2 tax
- $1,458 · $121/mo
- Expected delta
- $0/yr ($0/mo · 0.0%)
ⓘ Screening estimate from a state-policy table — verify with the county assessor before closing.
Climate risk First Street
- Flood 1/10 Low FEMA zone X (unshaded) · 0% chance over 30 yrs
- Wildfire 3/10 Moderate
- Heat 5/10 Major 7 d/yr ≥105°F today · 18 d/yr by 30 yrs out
- Wind 6/10 Major 27% chance of damaging wind over 30 yrs
- Air quality 5/10 Major 6 unhealthy d/yr today · 9 by 30 yrs out
Nearby sold comps map
Loading sold comps map…
Walkable amenities ~0.75 mi
Loading nearby amenities…
Taxation est. · year 1
- Rental income
- $18,828
- − Mortgage interest
- −$8,677
- − Property taxes
- −$1,458
- − Insurance
- −$774
- − Repairs & maintenance
- −$1,506
- − Management
- −$1,506
- − Depreciation
- −$4,506
- Taxable income
- $400
- Est. tax owed @ 24.0%
- −$96
- After-tax cash flow
- $2,798/yr
For passive investors: Depreciation is non-cash, so a rental often shows a tax loss while cash-flowing — sheltering income. Rental losses are passive: they offset passive income freely, and up to $25,000/yr can offset ordinary (W-2) income if you actively participate and your MAGI is under $100k (phasing out to $0 by $150k); unused losses carry forward. On sale, claimed depreciation is recaptured at up to 25%, and gains may owe capital-gains tax (a 1031 exchange can defer both). Figures are a year-1 estimate at your 24.0% rate — not tax advice; consult a CPA.
Schools (NCES district)
- District
- Jefferson County
- NCES district ID
- 0101920
- Math proficiency
- 9% ▼ -24.00%
- Reading proficiency
- 32% ▼ -5.00%
- Median HH income
- $51,712
- Composite
- 18.4/100
- National rank
- #8937
- State rank
- #104 of 129 in AL
Livability — Pinson
- Score
- 60/100
- State rank
- #289
- US rank
- #18763
Category grades
Schools grade is shown separately in the Schools card above.
Census & demographics
- Census place
- Pinson, AL
- County
- Jefferson County · 527,445 people
- City population
- 22,599
- Metro
- Birmingham-Hoover, AL
- Population (ZIP)
- 22,599
- Household income
- $83,732
- Rent vs Own
- Severe rent burden
- 267.0
Population outlook (Jefferson County) Hauer SSP2
- Today (2025)
- 669,185 people
- By 2030
- 669,694 · +0.1%
- By 2040
- 661,388 · -1.2%
- By 2050
- 643,086 · -3.9%
- By 2075
- 577,267 · -13.7%
- By 2100
- 474,758 · -29.1%
Race, ethnicity, and origin ACS 2023
- Neighborhood character
- Diverse neighborhood (Simpson 0.58)
- Race & ethnicity
- White 58% Black 28% Hispanic / Latino 8% Two or more races 7% Asian 2%
- Hispanic origin (detail)
- Mexican 5% Puerto Rican 1%
- Common ancestry
- Slovak 2% Lithuanian 1% Italian 1%
- Foreign-born
- 5% · Canada, China, Jamaica
- Languages at home
- 92% English-only · Spanish 5% Vietnamese 1% Chinese 0%
Political lean MEDSL · Jefferson
- 2024 margin
- D (+10.4) · D 54.6% · R 44.2% · Other 1.2%
- 2008→2024 swing
- +5.4pp toward D · 2008: 5.1pp · 2024: 10.4pp
- All cycles
- 2024: D+10.4 2020: D+13.2 2016: D+7.2 2012: D+6.0 2008: D+5.1
Not yet ingested
- Civics
- —
Market trends
- HPI YoY
- ▼ -54.52%
- Current HPI
- 188.6439
- Rent YoY
- ▲ 1.61%
- Metro
- Birmingham-Hoover, AL
- State GDP YoY
- ▲ 2.94%
- F500 in state
- 4
Industry mix (Fortune 500 HQ in AL)
| Industry | F500 HQs | Revenue |
|---|---|---|
| Financial Services | 1 | $8B |
|
||
| Healthcare | 1 | $5B |
|
||
Price history
+170.6% since first listed11 events — show timeline
- 2026-05-28 Listed $154,900 Greater Alabama MLS
- 2024-03-12 Sold (Public Records) $417,784,000 Public Records
- 2016-09-23 Sold (MLS) $58,000 Greater Alabama MLS
- 2016-08-12 Delisted — Greater Alabama MLS
- 2016-06-17 Pending — Greater Alabama MLS
- 2016-05-26 Listed $52,000 Greater Alabama MLS
- 2013-10-03 Sold (Public Records) $84,900 Public Records
- 2013-09-26 Sold (MLS) $84,900 Greater Alabama MLS
- 2013-05-09 Listed $84,900 Greater Alabama MLS
- 2004-07-02 Sold (Public Records) $79,000 Public Records
- 1993-09-28 Sold (Public Records) $57,250 Public Records
Property tax history
+12.3%/yrLatest (2025): $1,458 · -2.6% YoY. Source: county tax records.
Cash-flow waterfall
monthlySold comps — $/sqft
last 12 mo · ≤1 miLoading sold comps…