9810 Marina Blvd #1136 · Hillsboro Pines, FL
Flood risk 1/10 · Minimal
- FEMA flood zone
- AO
- Chance of flooding over 30 yrs
- 0.0%
- Est. flood insurance / yr
- $848 – $2,087
Fire risk 1/10 · Minimal
- Est. fire insurance / yr
- $947 – $1,759
Heat risk 9/10 · Severe
- Hot days now (above 107°F)
- 7 days/yr
- Hot days in 30 yrs
- 26 days/yr
Wind risk 10/10 · Severe
- Chance of severe wind over 30 yrs
- 99.0%
Air-quality risk 3/10 · Minor
- Unhealthy air days now
- 2 days/yr
- Unhealthy air days in 30 yrs
- 3 days/yr
Risk factors via First Street. Map © Google.
Why this score? — see what drove the B- grade
The composite is a weighted blend of 9 inputs, each scored 0–100. Each bar is that input's sub-score; the figure is the points it added to the 100-point composite (weight × sub-score).
- Cash flow +27.2/30.0
- 1% rule +10.0/10.0
- DSCR +9.5/10.0
- ARV discount +7.5/15.0
- Schools +4.3/10.0
- Livability +3.9/5.0
- Rent growth +3.4/5.0
- Condition / age +2.5/5.0
- Appreciation +0.0/10.0
$139,999
🖨 Deal sheet (PDF) 📄 Offer letter ✓ Due diligence
Listing remarks MLS
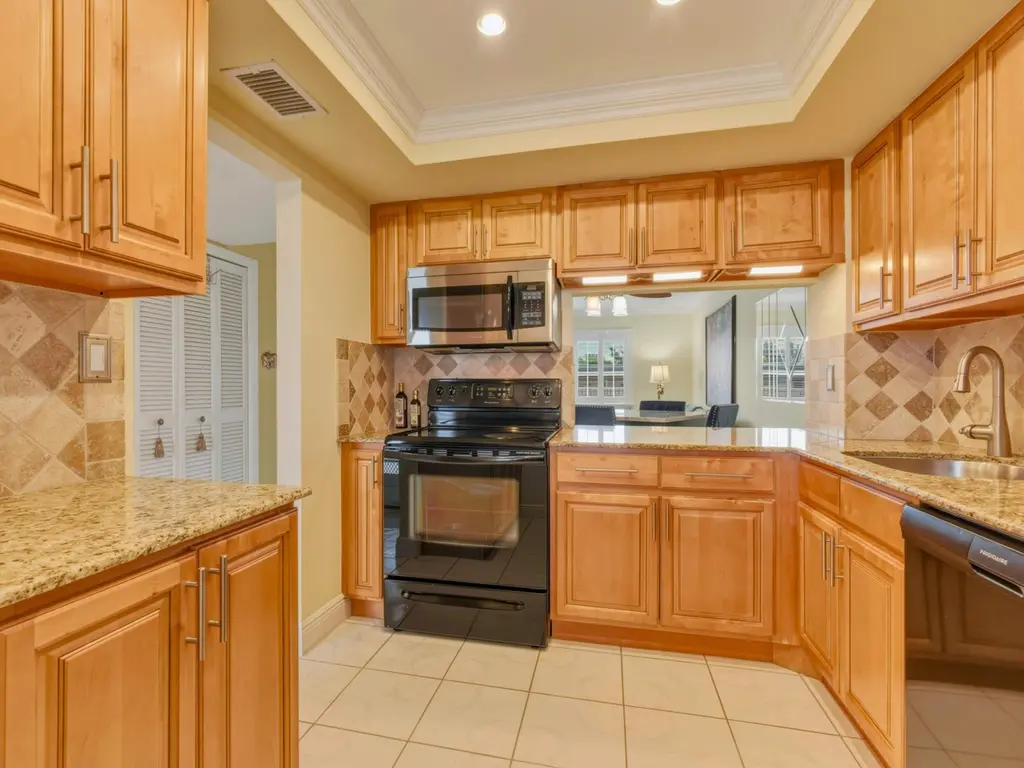
WOW!! A COMPLETLY REMODELED PENTHOUSE * ONE BEDROOM * ONE AND HALF BATH * UNLIMITED FREE GOLF * WOOD KITCHEN WITH GRANITE COUNTER TOPS * CROWN MOLDING * HURICANE RESISTANT WINDOWS AND DOORS * PLANTATION SHUTERS ON ALL WINDOWS * TILE THRU-OUT * TURN KEY * GREAT VIEWS THIS IS NOT A SHORT SALE OR A FORECLOSURE !! * JUST A MOTIVATED SELLER !! *
Key facts
- Open concept living
- Updated kitchen
- Recessed lighting
Tags
Property features AI
Finance
- Financial info: Pets not allowed
- HOA & community: HOA with monthly fee; Community amenities include clubhouse, elevator(s), pool, trash chute; Senior community
Exterior
- Parking: Assigned parking; Guest parking; One parking space
- Security: Secure elevator
- Utilities: Public water; Public sewer; Electricity connected; Water connected
- Home design: Condominium; One level; Resale; Faces north; Three-story building
- Construction: Concrete construction
- Exterior features: No waterfront; Flat roof
Interior
- Kitchen: Electric range; Dishwasher; Microwave; Refrigerator; Electric water heater
- Bedrooms: One bedroom on the main level
- Flooring: Tile
- Bathrooms: One full bathroom; One half bathroom
- Heating & cooling: Central electric heating; Central air conditioning; Ceiling fan(s)
- Interior features: Walk-in closet(s); Furnished
- Laundry & utility: Laundry room on lower level
Neighborhood map
What this means for you Summary
Snapshot
- This is a 1-bed/1.5-bath condo listed at $140k.
Deal economics
- At list price, monthly cash flow is $279 ($3k/yr) — positive.
- The deal already cash-flows at list — no discount required.
- Meets the 1% rule at list price ($2k rent vs $140k).
- Recommended offer: $132k (6.0% below list) — sets the bar for market timing.
Location & tenants
- Location reads 78/100 on livability (#173 in FL, #2,634 nationally) — a middle-class / working-renter tenant base. Strengths: schools A+, crime A+, employment A+; Watch: amenities F, cost of living F.
- Palm Beach (suburban): math 46% / reading 53% proficiency, ranked #34 of 73 in FL (top 47%) — families likely to look elsewhere, expect single-tenant / working-renter base with shorter leases.
- Market conditions: Rents rising (+3.7%/yr); 267 active listings in the ZIP; 39 comparable units currently listed for rent nearby; rentals leasing fast (median 14d on market — plan ~1-2 weeks tenant-placement turnaround); solid renter incomes; 3,974 units permitted in Palm Beach County in 2024 (1,012 in 5+ unit buildings).
Forward outlook
- Local home prices are declining (-3.0%/yr); year-one equity from $968 of loan paydown is wiped out by about $4k of value loss. Plan a longer hold.
- Palm Beach County population projected at +30% by 2050 — long-run rental-demand tailwind backs the buy-and-hold thesis.
Negotiation context
- It's been on market 77 days — a 6% lower offer ($132k) is reasonable based on typical stale-listing flexibility.
- 7 sale attempts since 20y ago with the ask held roughly flat each time — persistent listings suggest the price (not the market) is what's stuck; bring a comps-based counter.
- Current owner paid $113k; 24% above their basis — modest negotiation headroom, anchor on the comps not their cost.
Risks & watch-outs
- Watch-outs: flood insurance adds $122/mo.
- Climate carrying-cost: in FEMA flood zone AO (mandatory federal flood insurance); severe wind risk, 99% chance of damaging wind over 30y; extreme-heat days projected 7→26/yr by 2055 (HVAC capex compounding) — expect insurance premiums to compound above CPI over the hold.
Questions for the listing agent
- It's been on market 77 days. Have you received any prior offers? Is the seller open to a 6% concession, seller financing, or rate buy-down credit?
- Built in 1973 — when were the roof, HVAC, electrical panel, plumbing, and water heater last replaced?
- What's the actual annual flood-insurance premium (NFIP or private), and is the property in a SFHA with mandatory coverage?
- What does the HOA fee cover, when was the last increase, and are there any pending special assessments or reserve-fund shortfalls?
- Any open or pending special assessments — roof, HVAC, plumbing, elevator, façade? What's the per-unit balance and payoff schedule, and is the seller paying it off at close or rolling it to the buyer?
- Why hasn't it sold? Are there any deal-killer items the seller is aware of (foundation, flood, title, zoning, code violations)?
- Is there a deadline driving the sale (1031 exchange, divorce, estate, relocation)? That informs how much negotiation room exists.
- Schools are A-rated — typically a magnet for longer-tenancy family renters. What's the average tenant stay here, and is there a school-zone premium baked into asking?
- What's the average days-on-market for RENTAL listings here right now (not sales)? A rising rental-DOM trend means longer vacancies and softer asking-rent achievability than the comps imply.
- What's the recent tenant-quality profile in this submarket — average credit score on applications, eviction rate, late-payment / NSF rate, and stable-employment percentage? A property-management company in the area should have these aggregated.
- How much new apartment / multifamily construction is in the pipeline within 1–3 miles? Heavy new supply (>2% of stock underway) typically softens rents 12–24 months out; light construction supports rent growth.
Investment metrics
- 1% rule
- 1.54% ✓
- Cap rate
- 9.74%
- Cash-on-cash
- 12.30%
- DSCR
- 1.55
- GRM
- 5.4
CMA / ARV
No comps found within radius.
Projected returns pro-forma
-3.0% appreciation · 3.72% rent growth · sell at horizon
- IRR
- -2.0%
- Equity multiple
- 0.92×
- Total profit
- $-3,002
- Equity at exit
- $20,874
- IRR
- 8.9%
- Equity multiple
- 1.72×
- Total profit
- $28,125
- Equity at exit
- $12,105
Cash invested: $39,200 (down + closing). Projections, not guarantees.
Landlord ↔ Tenant lean methodology
- Overall (STATE)
- 87 Strongly Landlord-Friendly
- State Florida
- 87 Strongly Landlord-Friendly · R+3
- County
- — inherits STATE
- City
- — inherits STATE
ZIP-level market 33428
- Rents YoY
- 3.7%
- Active inventory
- 267
- Price-to-rent
- 5.4×
Monthly cashflow live
- Estimated rent
- $2,156 high interval (Pro) →
- Mortgage (P&I)
- −$734
- Tax from tax record
- −$116 /mo · $1,392/yr
- Insurance
- −$58
- Flood insurance flood zone
- −$122 /mo · $1,468/yr
- HOA
- −$393
- Vacancy / Maint / Mgmt
- −$453
- Net cashflow
- $279
Break-even live
Sensitivity live
| Price | -10% $359 | -5% $319 | +0% $279 | +5% $240 | +10% $200 |
|---|---|---|---|---|---|
| Rent | -10% $109 | -5% $194 | +0% $279 | +5% $365 | +10% $450 |
| Rate | -1.0pp $350 | -0.5pp $315 | base $279 | +0.5pp $243 | +1.0pp $206 |
UW: 25.0% down · 7.5% · 30yr · 1.5% tax · 5.0% vac · 8.0% maint · 8.0% mgmt
Financing live
Cash to close
- Down payment
- $35,000
- Closing costs
- $4,200
- Reserves months
- —
- Total cash needed
- —
Loan-product check · same deal, 3 products live
Conventional
25% down · 7.5% · 30yr
- Down + closing
- —
- Monthly P&I
- —
- Monthly cashflow
- —
- DSCR
- —
- Eligible?
- —
Personal DTI + credit; lowest rate.
DSCR
20% down · 8.5% · 30yr
- Down + closing
- —
- Monthly P&I
- —
- Monthly cashflow
- —
- DSCR
- —
- Eligible?
- —
No personal income docs; deal must DSCR.
Hard money
10% down · 12.0% · 12mo
- Down + closing
- —
- Monthly P&I
- —
- Monthly cashflow
- —
- DSCR
- —
- Eligible?
- —
Short-term bridge; refi at stabilization.
Rent comps 39 comps
| Address | Beds | Baths | Sqft | Rent | $/sqft | DOM | Units | Dist |
|---|---|---|---|---|---|---|---|---|
| 9826 Marina Blvd #1027 Boca Raton, FL | 2.0 | 2.0 | 955 | $2,500 | $2.62 | 25d | 1 | 0.03mi |
| 9780 Marina Blvd #415 Boca Raton, FL | 2.0 | 2.0 | 955 | $2,000 | $2.09 | 25d | 1 | 0.11mi |
| 9503 Boca Cove Cir #603 Boca Raton, FL | 2.0 | 2.0 | 912 | $2,200 | $2.41 | 22d | 1 | 0.29mi |
| 1620 SW 64th Way Unit H Boca Raton, FL | 2.0 | 2.0 | 1008 | $2,250 | $2.23 | 25d | 1 | 0.29mi |
| 9466 Boca Cove Cir #310 Boca Raton, FL | 2.0 | 2.0 | 770 | $2,000 | $2.60 | 25d | 1 | 0.35mi |
| 5800 NW 74th Pl Coconut Creek, FL | 1.0–2.0 | 1.0–2.0 | 1115 | $1,955 | $1.75 | 2d | 17 | 0.44mi |
| 9949 Sandalfoot Blvd #531 Boca Raton, FL | 2.0 | 2.0 | 820 | $2,200 | $2.68 | 25d | 1 | 0.54mi |
| 9949 Sandalfoot Blvd Boca Raton, FL | 2.0 | 1.5–2.0 | 818 | $2,000 | $2.44 | 13d | 2 | 0.54mi |
| 9915 Sandalfoot Blvd Boca Raton, FL | 2.0 | 1.0 | 777 | $2,000 | $2.57 | 11d | 2 | 0.54mi |
| 10166 Marlin Cir Unit 2 Boca Raton, FL | 2.0 | 1.0 | 789 | $1,450 | $1.84 | 16d | 1 | 0.58mi |
| 10267 Boca Bnd W Unit G4 Boca Raton, FL | 2.0 | 2.0 | 1068 | $2,850 | $2.67 | 25d | 1 | 0.59mi |
| 10323 Boca Bnd W Unit K4 Boca Raton, FL | 2.0 | 2.0 | 1068 | $2,500 | $2.34 | 0d | 1 | 0.62mi |
| 9973 Three Lakes Cir Boca Raton, FL | 2.0 | 2.0 | 1026 | $2,500 | $2.44 | 25d | 1 | 0.68mi |
| 9355 SW 8th St Boca Raton, FL | 1.0–2.0 | 1.5–2.0 | 780 | $1,600 | $2.05 | 2d | 4 | 0.75mi |
| 5201 W Hillsboro Blvd Coconut Creek, FL | 1.0–3.0 | 1.0–2.0 | 1072 | $2,029 | $1.89 | 2d | 28 | 0.77mi |
| 22605 SW 66th Ave #403 Boca Raton, FL | 2.0 | 2.0 | 1030 | $2,100 | $2.04 | 25d | 1 | 0.78mi |
| 22605 SW 66th Ave #206 Boca Raton, FL | 1.0 | 1.5 | 960 | $1,650 | $1.72 | 6d | 1 | 0.78mi |
| 10457 S 228th Ln Boca Raton, FL | 2.0 | 2.0 | 1104 | $1,900 | $1.72 | 8d | 1 | 0.80mi |
| 9273 SW 8th St Boca Raton, FL | 1.0–2.0 | 1.5–2.0 | 878 | $1,700 | $1.94 | 3d | 3 | 0.82mi |
| 23398 Lyons Rd #309 Boca Raton, FL | 2.0 | 2.0 | 988 | $2,200 | $2.23 | 14d | 1 | 0.87mi |
| 9370 SW 8th St #107 Boca Raton, FL | 2.0 | 2.0 | 900 | $2,150 | $2.39 | 15d | 1 | 0.87mi |
| 9370 SW 8th St #107 Boca Raton, FL | 2.0 | 2.0 | 900 | $2,100 | $2.33 | 6d | 1 | 0.87mi |
| 23398 SW 57th Ave Boca Raton, FL | 2.0 | 2.0 | 988 | $2,150 | $2.18 | 5d | 2 | 0.87mi |
| 9233 SW 8th St #110 Boca Raton, FL | 2.0 | 2.0 | 979 | $1,800 | $1.84 | 8d | 1 | 0.91mi |
| 9440 SW 8th St Boca Raton, FL | 1.0–2.0 | 1.5–2.0 | 878 | $1,900 | $2.16 | 3d | 2 | 0.95mi |
| 9235 SW 8th St Boca Raton, FL | 2.0 | 2.0 | 900 | $2,150 | $2.39 | 3d | 2 | 1.00mi |
| 9235 SW 8th St Boca Raton, FL | 2.0 | 2.0 | 1045 | $2,175 | $2.08 | 11d | 4 | 1.00mi |
| 9260 Boca Vue Dr Boca Raton, FL | 1.0–3.0 | 1.0–2.0 | 1052 | $2,348 | $2.23 | 0d | 32 | 1.02mi |
| 9162 SW 5th St Unit A Boca Raton, FL | 2.0 | 2.0 | 1039 | $2,400 | $2.31 | 25d | 1 | 1.08mi |
| 11887 Anchorage Way Boca Raton, FL | 2.0 | 2.0 | 960 | $1,900 | $1.98 | 25d | 1 | 1.11mi |
| 9860 SW 3rd St Boca Raton, FL | 1.0–3.0 | 1.5–2.5 | 1222 | $1,865 | $1.53 | 0d | 34 | 1.12mi |
| 5851 Holmberg Rd Parkland, FL | 1.0–3.0 | 1.0–2.5 | 1255 | $2,042 | $1.63 | 4d | 32 | 1.16mi |
| 9374 SW 3rd St #708 Boca Raton, FL | 2.0 | 2.0 | 961 | $2,100 | $2.19 | 8d | 1 | 1.17mi |
| 11992 Coral Pl Boca Raton, FL | 2.0 | 1.5 | 720 | $2,000 | $2.78 | 25d | 1 | 1.18mi |
| 9338 SW 3rd St #508 Boca Raton, FL | 2.0 | 2.0 | 961 | $2,300 | $2.39 | 14d | 1 | 1.20mi |
| 9338 SW 3rd St #508 Boca Raton, FL | 2.0 | 2.0 | 961 | $2,300 | $2.39 | 13d | 1 | 1.20mi |
| 11942 N Branch Rd Boca Raton, FL | 2.0 | 2.0 | 900 | $1,950 | $2.17 | 25d | 1 | 1.21mi |
| 9200 SW 3rd St #109 Boca Raton, FL | 2.0 | 2.0 | 961 | $2,250 | $2.34 | 25d | 1 | 1.23mi |
| 9210 SW 3rd St #216 Boca Raton, FL | 2.0 | 2.0 | 961 | $2,350 | $2.45 | 25d | 1 | 1.23mi |
HOA detail condo
- Monthly dues
- $393 · $4,716/yr
- Assessments
- None detected in remarks — confirm with the listing agent.
Listing history 34 events
-
2026-06-18days on market $139,999 Active 77 DOM
-
2026-06-17days on market $139,999 Active 76 DOM
-
2026-06-16days on market $139,999 Active 75 DOM
-
2026-06-15days on market $139,999 Active 74 DOM
-
2026-06-13days on market $139,999 Active 72 DOM
-
2026-06-09days on market $139,999 Active 68 DOM
-
2026-06-08days on market $139,999 Active 67 DOM
-
2026-06-07days on market $139,999 Active 66 DOM
-
2026-06-04days on market $139,999 Active 63 DOM
-
2026-06-03days on market $139,999 Active 62 DOM
-
2026-06-02days on market $139,999 Active 61 DOM
-
2026-06-01days on market $139,999 Active 60 DOM
-
2026-05-31days on market $139,999 Active 59 DOM
-
2026-04-02$139,999 Active
-
2022-02-08soldstatus $112,900
-
2015-04-13soldstatus $60,000
-
2011-04-27soldstatus $48,500
-
2011-04-14soldstatus $48,500 344-char remark
Show marketing remark (344 chars)
WOW!! A COMPLETLY REMODELED PENTHOUSE * ONE BEDROOM * ONE AND HALF BATH * UNLIMITED FREE GOLF * WOOD KITCHEN WITH GRANITE COUNTER TOPS * CROWN MOLDING * HURICANE RESISTANT WINDOWS AND DOORS * PLANTATION SHUTERS ON ALL WINDOWS * TILE THRU-OUT * TURN KEY * GREAT VIEWS THIS IS NOT A SHORT SALE OR A FORECLOSURE !! * JUST A MOTIVATED SELLER !! *
-
2011-03-11historical 344-char remark
Show marketing remark (344 chars)
WOW!! A COMPLETLY REMODELED PENTHOUSE * ONE BEDROOM * ONE AND HALF BATH * UNLIMITED FREE GOLF * WOOD KITCHEN WITH GRANITE COUNTER TOPS * CROWN MOLDING * HURICANE RESISTANT WINDOWS AND DOORS * PLANTATION SHUTERS ON ALL WINDOWS * TILE THRU-OUT * TURN KEY * GREAT VIEWS THIS IS NOT A SHORT SALE OR A FORECLOSURE !! * JUST A MOTIVATED SELLER !! *
-
2011-02-04$48,900 344-char remark
Show marketing remark (344 chars)
WOW!! A COMPLETLY REMODELED PENTHOUSE * ONE BEDROOM * ONE AND HALF BATH * UNLIMITED FREE GOLF * WOOD KITCHEN WITH GRANITE COUNTER TOPS * CROWN MOLDING * HURICANE RESISTANT WINDOWS AND DOORS * PLANTATION SHUTERS ON ALL WINDOWS * TILE THRU-OUT * TURN KEY * GREAT VIEWS THIS IS NOT A SHORT SALE OR A FORECLOSURE !! * JUST A MOTIVATED SELLER !! *
-
2011-01-30historical
-
2010-09-30$49,000
-
2010-07-15historical
-
2009-12-28$49,900
-
2009-11-30historical
-
2009-08-13$49,900
-
2008-11-26historical
-
2008-07-20$84,000
-
2007-02-26soldstatus $80,000
-
2007-02-20soldstatus $80,000
-
2007-01-24historical
-
2006-05-11$85,000
-
1989-12-22soldstatus $31,500
-
1989-05-01soldstatus $8,100
ⓘ Source: listings_history table (triggers on properties + properties_extension) + one-shot
backfill from property_details.listing_events for pre-trigger history.
Tax reassessment forecast FL · Resets to sale price
- Current annual tax
- $1,392 · $116/mo
- Projected year-2 tax
- $1,392 · $116/mo
- Expected delta
- $0/yr ($0/mo · 0.0%)
ⓘ Screening estimate from a state-policy table — verify with the county assessor before closing.
Climate risk First Street
- Flood 1/10 Low FEMA zone AO · 0% chance over 30 yrs
- Wildfire 1/10 Low
- Heat 9/10 Extreme 7 d/yr ≥107°F today · 26 d/yr by 30 yrs out
- Wind 10/10 Extreme 99% chance of damaging wind over 30 yrs
- Air quality 3/10 Moderate 2 unhealthy d/yr today · 3 by 30 yrs out
Nearby sold comps map
Loading sold comps map…
Walkable amenities ~0.75 mi
Loading nearby amenities…
Taxation est. · year 1
- Rental income
- $25,872
- − Mortgage interest
- −$7,842
- − Property taxes
- −$1,392
- − Insurance
- −$2,167
- − Repairs & maintenance
- −$2,070
- − Management
- −$2,070
- − HOA
- −$4,716
- − Depreciation
- −$4,073
- Taxable income
- $1,542
- Est. tax owed @ 24.0%
- −$370
- After-tax cash flow
- $2,983/yr
For passive investors: Depreciation is non-cash, so a rental often shows a tax loss while cash-flowing — sheltering income. Rental losses are passive: they offset passive income freely, and up to $25,000/yr can offset ordinary (W-2) income if you actively participate and your MAGI is under $100k (phasing out to $0 by $150k); unused losses carry forward. On sale, claimed depreciation is recaptured at up to 25%, and gains may owe capital-gains tax (a 1031 exchange can defer both). Figures are a year-1 estimate at your 24.0% rate — not tax advice; consult a CPA.
Schools (NCES district)
- District
- Palm Beach
- NCES district ID
- 1201500
- Math proficiency
- 46% ▼ -16.00%
- Reading proficiency
- 53% ▼ -4.00%
- Median HH income
- $53,943
- Composite
- 42.72/100
- National rank
- #3160
- State rank
- #34 of 73 in FL
Livability — Hillsboro Pines
- Score
- 78/100
- State rank
- #173
- US rank
- #2634
Category grades
Schools grade is shown separately in the Schools card above.
Census & demographics
- County
- Palm Beach County · 1,438,312 people
- Metro
- Miami-Fort Lauderdale-Pompano Beach, FL
- Population (ZIP)
- 47,588
- Household income
- $88,543
- Rent vs Own
- Severe rent burden
- 1990.0
Population outlook (Palm Beach County) Hauer SSP2
- Today (2025)
- 1,637,487 people
- By 2030
- 1,743,255 · +6.5%
- By 2040
- 1,948,712 · +19.0%
- By 2050
- 2,132,979 · +30.3%
- By 2075
- 2,530,027 · +54.5%
- By 2100
- 2,706,979 · +65.3%
Race, ethnicity, and origin ACS 2023
- Neighborhood character
- Diverse neighborhood (Simpson 0.69)
- Race & ethnicity
- White 50% Two or more races 23% Hispanic / Latino 22% Black 7% Asian 5%
- Hispanic origin (detail)
- Mexican 3% Puerto Rican 3% Cuban 2% Dominican 1%
- Common ancestry
- Estonian 12% Romanian 3% Scotch-Irish 3%
- Foreign-born
- 37% · Canada, Jamaica, Vietnam
- Languages at home
- 55% English-only · Spanish 19% Other Indo-European 17% French/Haitian/Cajun 2%
Political lean MEDSL · Palm Beach
- 2024 margin
- Toss-up / Even · D 50.0% · R 49.2%
- 2008→2024 swing
- -22.1pp toward R · 2008: 22.9pp · 2024: 0.8pp
- All cycles
- 2024: D+0.8 2020: D+12.8 2016: D+15.3 2012: D+17.0 2008: D+22.9
Not yet ingested
- Civics
- —
Market trends
- HPI YoY
- ▼ -299.00%
- Current HPI
- 373.2649
- Rent YoY
- ▲ 3.72%
- Metro
- Miami-Fort Lauderdale-Pompano Beach, FL
- State GDP YoY
- ▲ 3.28%
- F500 in state
- 36
Industry mix (Fortune 500 HQ in FL)
| Industry | F500 HQs | Revenue |
|---|---|---|
| Industrial Technology | 2 | $29B |
|
||
| Insurance | 2 | $17B |
|
||
| Retail | 1 | $60B |
|
||
| Technology Distribution | 1 | $58B |
|
||
| Homebuilding | 1 | $35B |
|
||
| Technology Manufacturing | 1 | $35B |
|
||
Price history
+1628.4% since first listed21 events — show timeline
- 2026-04-02 Listed $139,999 Beaches MLS
- 2022-02-08 Sold (Public Records) $112,900 Public Records
- 2015-04-13 Sold (Public Records) $60,000 Public Records
- 2011-04-27 Sold (Public Records) $48,500 Public Records
- 2011-04-14 Sold (MLS) $48,500 Beaches MLS
- 2011-03-11 Listing Removed — Beaches MLS
- 2011-02-04 Listed $48,900 Beaches MLS
- 2011-01-30 Listing Removed — Beaches MLS
- 2010-09-30 Listed $49,000 Beaches MLS
- 2010-07-15 Listing Removed — Beaches MLS
- 2009-12-28 Listed $49,900 Beaches MLS
- 2009-11-30 Listing Removed — Beaches MLS
- 2009-08-13 Listed $49,900 Beaches MLS
- 2008-11-26 Listing Removed — Beaches MLS
- 2008-07-20 Listed $84,000 Beaches MLS
- 2007-02-26 Sold (Public Records) $80,000 Public Records
- 2007-02-20 Sold (MLS) $80,000 Beaches MLS
- 2007-01-24 Listing Removed — Beaches MLS
- 2006-05-11 Listed $85,000 Beaches MLS
- 1989-12-22 Sold (Public Records) $31,500 Public Records
- 1989-05-01 Sold (Public Records) $8,100 Public Records
Property tax history
+15.6%/yrLatest (2025): $1,392 · +0.1% YoY. Source: county tax records.
Cash-flow waterfall
monthlySold comps — $/sqft
last 12 mo · ≤1 miLoading sold comps…