 Duplex
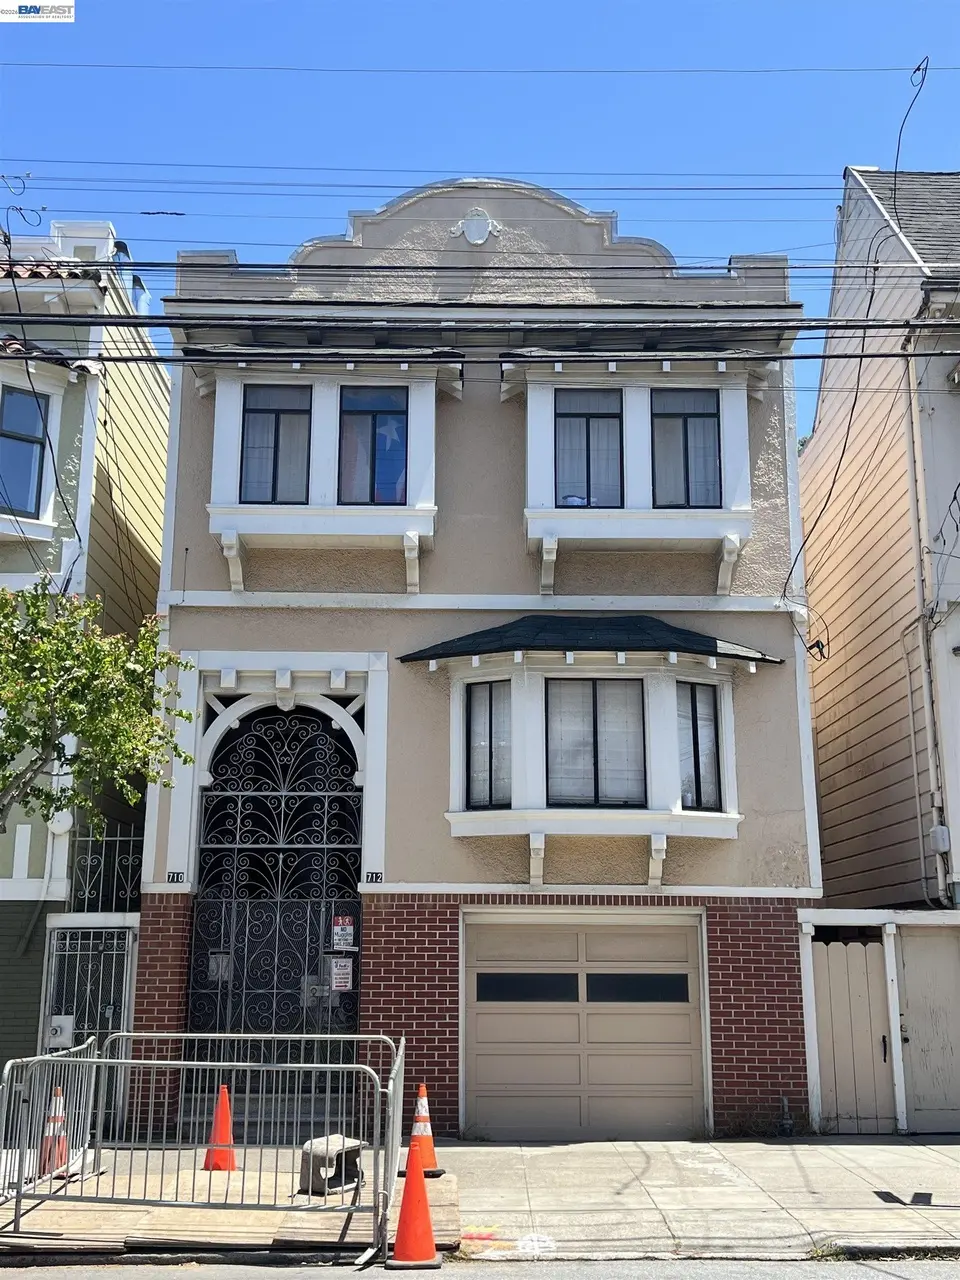
710-712 9th Ave · San Francisco, CA
Flood risk 1/10 · Minimal
- FEMA flood zone
- X (unshaded)
- Chance of flooding over 30 yrs
- 0.0%
- Est. flood insurance / yr
- $507 – $1,088
Fire risk 1/10 · Minimal
- Est. fire insurance / yr
- $659 – $1,223
Heat risk 2/10 · Minimal
- Hot days now (above 76°F)
- 7 days/yr
- Hot days in 30 yrs
- 17 days/yr
Wind risk 1/10 · Minimal
- Chance of severe wind over 30 yrs
- —
Air-quality risk 7/10 · Major
- Unhealthy air days now
- 13 days/yr
- Unhealthy air days in 30 yrs
- 13 days/yr
Risk factors via First Street. Map © Google.
Why this score? — see what drove the D+ grade
The composite is a weighted blend of 9 inputs, each scored 0–100. Each bar is that input's sub-score; the figure is the points it added to the 100-point composite (weight × sub-score).
- ARV discount +13.9/15.0
- Appreciation +9.0/10.0
- Cash flow +7.4/30.0
- Rent growth +5.0/5.0
- Schools +5.0/10.0
- Livability +3.8/5.0
- Condition / age +2.5/5.0
- DSCR +1.6/10.0
- 1% rule +0.9/10.0
$1,699,000
🖨 Deal sheet 📄 Offer letter ✓ Due diligence
Multi-family units
County records classify this as Multi-Family (2-4 Unit). Listing-text estimate: 2 units. confirmed
Listing remarks
Discover this rare Inner Richmond duplex, available for the first time in over 60 years, just one block from Golden Gate Park. This well-loved property offers a compelling opportunity for both investors and owner-occupants in one of San Francisco’s most desirable neighborhoods. The upper unit features three bedrooms, a spacious living room, formal dining area, dedicated laundry area, and a generously sized kitchen. The lower unit offers a similar layout, minus a bedroom, providing flexibility for rental income or future multi-generational living. Additional highlights include a tandem garage with ample storage space and potential to be remodeled into living space (buyer to verify feas
Key facts
- Tandem garage
- Charming backyard
- Six bus lines nearby
Tags
Property features AI
Finance
- Financial info: Two-unit building (duplex)
Exterior
- Parking: 2 parking spaces; Garage with garage door opener
- Utilities: Public water; Public sewer
- Home design: Residential income property; Duplex; Built in 1911
- Exterior features: Back yard; Rectangular lot
Interior
- Flooring: Hardwood floors throughout
- Heating & cooling: Forced air heating; No air conditioning
- Interior features: Built-in storage; Tub with shower over
- Laundry & utility: Laundry located inside
Neighborhood map
What this means for you Summary
Snapshot
- This is a 1×3bd/1ba + 1×?bd/1ba units multifamily listed at $1.70M.
Deal economics
- At list price, monthly cash flow is $-2k ($-26k/yr) — negative. Per door: $-1k/mo.
- To cash-flow at today's rent, offer at most $1.32M (22.4% below list).
- To meet the 1% rule (rent ≥ 1% of price), the offer needs to be $1.00M (41.0% below list).
- Recommended offer: $1.00M (41.0% below list) — sets the bar for 1% rule.
- Cap rate 4.8% vs local median 2.1% in San Francisco — top-decile yield for the area; either an underpriced asset or a hidden risk that comps aren't pricing in. Stress-test before assuming the spread holds.
Location & tenants
- Location reads 76/100 on livability (#90 in CA, #3,143 nationally) — a middle-class / working-renter tenant base. Strengths: amenities A+, commute A+, employment A+; Watch: crime F, cost of living F.
- San Francisco Unified (urban): math 50% / reading 56% proficiency, ranked #322 of 1,400 in CA (top 23%) — acceptable for families but not a draw, mixed tenant base, ~2y average lease.
- Market conditions: Rents rising fast (+17.1%/yr); 50 active listings in the ZIP; 1 comparable units currently listed for rent nearby; high-income renter base; 750 units permitted in San Francisco County in 2024 (688 in 5+ unit buildings).
- At $10,018/mo this rent would consume 73% of the median local household income ($164k/yr) (locally 1780% of renters already pay >50% of income on rent) — very limited rent-growth headroom before tenants either downsize or default.
Forward outlook
- In year one you build about $146k of equity ($12k loan paydown + $135k appreciation (7.9% local appreciation)).
- San Francisco County population projected at +39% by 2050 — long-run rental-demand tailwind backs the buy-and-hold thesis.
- By year 2, paydown + projected appreciation supports a ~$234k cash-out refi (75% LTV) — recoverable capital for the next deal without selling this one.
Negotiation context
- It's been on market 17 days — a 2% lower offer ($1.67M) is reasonable based on typical stale-listing flexibility.
Risks & watch-outs
- Watch-outs: built in 1911 — expect roof / HVAC / electrical / plumbing capex.
Questions for the listing agent
- What do current leases actually rent for vs. the listed asking? Can we see a recent rent roll and the last 12 months of T-12 income?
- Can we see the unit-by-unit rent roll, current vacancy, and any below-market leases? What's the average tenancy length?
- What capital expenditures (roof, boiler, parking lot, exteriors) have been made in the last 5 years, and what's planned in the next 2?
- Built in 1911 — when were the roof, HVAC, electrical panel, plumbing, and water heater last replaced?
- Is there a deadline driving the sale (1031 exchange, divorce, estate, relocation)? That informs how much negotiation room exists.
- Schools are B-rated — typically a magnet for longer-tenancy family renters. What's the average tenant stay here, and is there a school-zone premium baked into asking?
- Crime grade is F in this area — have there been break-ins, vandalism, or insurance claims at this property in the last 3 years? What carrier currently insures it and at what premium?
- The area grade is low — what's the realistic commute time and amenity access for the typical tenant pool here? Any planned neighborhood developments (good or bad) we should know about?
- What's the average days-on-market for RENTAL listings here right now (not sales)? A rising rental-DOM trend means longer vacancies and softer asking-rent achievability than the comps imply.
- What's the recent tenant-quality profile in this submarket — average credit score on applications, eviction rate, late-payment / NSF rate, and stable-employment percentage? A property-management company in the area should have these aggregated.
- How much new apartment / multifamily construction is in the pipeline within 1–3 miles? Heavy new supply (>2% of stock underway) typically softens rents 12–24 months out; light construction supports rent growth.
Investment metrics
- 1% rule
- 0.59% ✗
- Cap rate
- 4.77%
- Cash-on-cash
- -5.44%
- DSCR
- 0.76
- GRM
- 14.1
CMA / ARV
- ARV (on-the-fly)
- $1,980,160
- Comps found
- 12
Show comp detail 12 sales within ~0.75 mi
| Address | Dist | Beds/Ba | Sqft | Sold | Price | $/sf | Match |
|---|---|---|---|---|---|---|---|
| 674 10th Ave | 0.08mi | 4/2.0 | 2,800 (-4%) | 2mo | $1,038,000 | $371 | 88 |
| 445-447 Lincoln Way | 0.66mi | 4/2.0 | 2,991 (+3%) | 1mo | $2,035,000 | $680 | 64 |
| 704 Arguello Blvd | 0.48mi | 4/2.0 | 2,650 (-9%) | 1mo | $2,500,000 | $943 | 61 |
| 258-260 5th Ave | 0.64mi | 8/4.0 | 2,930 (+1%) | 2mo | $2,208,000 | $754 | 59 |
| 1614-1618 Balboa St | 0.54mi | 5/2.0 | 3,263 (+12%) | 1mo | $1,600,000 | $490 | 54 |
| 167-169 11th Ave | 0.73mi | 5/2.0 | 3,098 (+6%) | 2mo | $2,910,000 | $939 | 54 |
| 443-445 19th Ave | 0.71mi | —/— | 2,730 (-6%) | 4mo | $1,538,000 | $563 | 53 |
| 1027 Lincoln Way | 0.66mi | 5/4.0 | 3,037 (+4%) | 2mo | $2,513,000 | $827 | 53 |
| 563-565 20th Ave | 0.71mi | 4/2.0 | 3,210 (+10%) | 3mo | $1,300,000 | $405 | 48 |
| 1533-35 Clement St | 0.70mi | 4/2.0 | 2,550 (-12%) | 2mo | $1,252,000 | $491 | 45 |
| 1231-1233 4th Ave | 0.72mi | 6/3.0 | 3,200 (+10%) | 4mo | $2,865,000 | $895 | 43 |
| 1215-1217 3rd Ave | 0.72mi | 4/4.0 | 3,260 (+12%) | 4mo | $1,900,000 | $583 | 35 |
Match score weights: distance 35% · size 25% · config 20% · recency 20%. Top-matched comps best support the ARV.
Projected returns pro-forma
7.92% appreciation · 8.0% rent growth · sell at horizon
- IRR
- 17.0%
- Equity multiple
- 2.27×
- Total profit
- $605,673
- Equity at exit
- $1,281,309
- IRR
- 17.4%
- Equity multiple
- 5.18×
- Total profit
- $1,990,730
- Equity at exit
- $2,534,409
Cash invested: $475,720 (down + closing). Projections, not guarantees.
Landlord ↔ Tenant lean methodology
- Overall (CITY)
- 0 Strongly Tenant-Friendly
- State California
- 18 Strongly Tenant-Friendly · D+13
- County
- — inherits STATE
- City San Francisco
- 0 Strongly Tenant-Friendly · D+57
ZIP-level market 94118
- Home prices YoY
- 3.3%
- Rents YoY
- 17.1%
- Active inventory
- 50
- Price-to-rent
- 23.4×
Monthly cashflow live
- Estimated rent
- $10,018 high interval (Pro) →
- Mortgage (P&I)
- −$8,910
- Tax from tax record
- −$454 /mo · $5,444/yr
- Insurance
- −$708
- HOA
- −$0
- Vacancy / Maint / Mgmt
- −$2,104
- Net cashflow
- $-2,157
Break-even live
2-unit breakdown (identical units grouped — click to expand)
| Units | Beds | Baths | Est. rent |
|---|---|---|---|
| 1× unit | 3 | 1 | $6,046 |
| 1× unit | 0 | 1 | $3,973 |
| Total (2 units) | $10,018 | ||
UW: 25.0% down · 7.5% · 30yr · 1.5% tax · 5.0% vac · 8.0% maint · 8.0% mgmt
Financing live
Cash to close
- Down payment
- $424,750
- Closing costs
- $50,970
- Reserves months
- —
- Total cash needed
- —
Loan-product check · same deal, 3 products live
Conventional
25% down · 7.5% · 30yr
- Down + closing
- —
- Monthly P&I
- —
- Monthly cashflow
- —
- DSCR
- —
- Eligible?
- —
Personal DTI + credit; lowest rate.
DSCR
20% down · 8.5% · 30yr
- Down + closing
- —
- Monthly P&I
- —
- Monthly cashflow
- —
- DSCR
- —
- Eligible?
- —
No personal income docs; deal must DSCR.
Hard money
10% down · 12.0% · 12mo
- Down + closing
- —
- Monthly P&I
- —
- Monthly cashflow
- —
- DSCR
- —
- Eligible?
- —
Short-term bridge; refi at stabilization.
Rent comps 1 comps
| Address | Beds | Baths | Sqft | Rent | $/sqft | DOM | Units | Dist |
|---|---|---|---|---|---|---|---|---|
| 1265 Stanyan St San Francisco, CA | 3.0 | 2.0 | 2005 | $13,900 | $6.93 | 7d | 1 | 1.30mi |
Listing history 13 events
-
2026-06-18days on market $1,699,000 Active 17 DOM
-
2026-06-17days on market $1,699,000 Active 16 DOM
-
2026-06-16days on market $1,699,000 Active 15 DOM
-
2026-06-15days on market $1,699,000 Active 14 DOM
-
2026-06-13days on market $1,699,000 Active 12 DOM
-
2026-06-13days on market $1,699,000 Active 11 DOM
-
2026-06-09days on market $1,699,000 Active 8 DOM
-
2026-06-08days on market $1,699,000 Active 7 DOM
-
2026-06-07days on market $1,699,000 Active 6 DOM
-
2026-06-04days on market $1,699,000 Active 3 DOM
-
2026-06-03days on market $1,699,000 Active 2 DOM
-
2026-06-02remarks 693-char remark
-
2026-06-02$1,699,000 Active 1 DOM
ⓘ Source: listings_history table (triggers on properties + properties_extension) + one-shot
backfill from property_details.listing_events for pre-trigger history.
Tax reassessment forecast CA · Resets to sale price
- Current annual tax
- $5,444 · $454/mo
- Projected year-2 tax
- $12,912 · $1,076/mo
- Expected delta
- +$7,468/yr (+$622/mo · 137.2%)
ⓘ Screening estimate from a state-policy table — verify with the county assessor before closing.
Climate risk First Street
- Flood 1/10 Low FEMA zone X (unshaded) · 0% chance over 30 yrs
- Wildfire 1/10 Low
- Heat 2/10 Low 7 d/yr ≥76°F today · 17 d/yr by 30 yrs out
- Wind 1/10 Low
- Air quality 7/10 Severe 13 unhealthy d/yr today · 13 by 30 yrs out
Nearby sold comps map
Loading sold comps map…
Walkable amenities ~0.75 mi
Loading nearby amenities…
Taxation est. · year 1
- Rental income
- $120,216
- − Mortgage interest
- −$95,170
- − Property taxes
- −$5,444
- − Insurance
- −$8,495
- − Repairs & maintenance
- −$9,617
- − Management
- −$9,617
- − Depreciation
- −$49,425
- Taxable loss
- −$57,553
- Est. tax savings @ 24.0%
- +$13,813
- After-tax cash flow
- $-12,072/yr
For passive investors: Depreciation is non-cash, so a rental often shows a tax loss while cash-flowing — sheltering income. Rental losses are passive: they offset passive income freely, and up to $25,000/yr can offset ordinary (W-2) income if you actively participate and your MAGI is under $100k (phasing out to $0 by $150k); unused losses carry forward. On sale, claimed depreciation is recaptured at up to 25%, and gains may owe capital-gains tax (a 1031 exchange can defer both). Figures are a year-1 estimate at your 24.0% rate — not tax advice; consult a CPA.
Schools (NCES district)
- District
- San Francisco Unified
- NCES district ID
- 0634410
- Math proficiency
- 50% ▬ 0.00%
- Reading proficiency
- 56% ▲ 1.00%
- Median HH income
- $81,249
- Composite
- 50.14/100
- National rank
- #4088
- State rank
- #322 of 1400 in CA
Livability — San Francisco
- Score
- 76/100
- State rank
- #90
- US rank
- #3143
Category grades
Schools grade is shown separately in the Schools card above.
Census & demographics
- Census place
- San Francisco, CA
- County
- San Francisco County · 827,552 people
- City population
- 827,552
- Metro
- San Francisco-Oakland-Berkeley, CA
- Population (ZIP)
- 39,130
- Household income
- $163,995
- Rent vs Own
- Severe rent burden
- 1780.0
Population outlook (San Francisco County) Hauer SSP2
- Today (2025)
- 1,030,936 people
- By 2030
- 1,110,409 · +7.7%
- By 2040
- 1,270,010 · +23.2%
- By 2050
- 1,435,001 · +39.2%
- By 2075
- 1,779,074 · +72.6%
- By 2100
- 1,966,767 · +90.8%
Race, ethnicity, and origin ACS 2023
- Neighborhood character
- Diverse neighborhood (Simpson 0.64)
- Race & ethnicity
- White 49% Asian 32% Two or more races 10% Hispanic / Latino 10% Black 1%
- Hispanic origin (detail)
- Mexican 6%
- Common ancestry
- Romanian 3% Italian 3% Scotch-Irish 2%
- Foreign-born
- 25% · China, Canada, South Korea
- Languages at home
- 65% English-only · Chinese 15% Spanish 6% Other Indo-European 3%
Political lean MEDSL · San Francisco
- 2024 margin
- Solid D (+64.8) · D 80.3% · R 15.5% · Other 4.1%
- 2008→2024 swing
- -5.7pp toward R · 2008: 70.5pp · 2024: 64.8pp
- All cycles
- 2024: D+64.8 2020: D+72.5 2016: D+76.1 2012: D+70.2 2008: D+70.5
Not yet ingested
- Civics
- —
Market trends
- HPI YoY
- ▲ 7.92%
- Current HPI
- 250.5205
- Rent YoY
- ▲ 17.14%
- Metro
- San Francisco-Oakland-Berkeley, CA
- State GDP YoY
- ▲ 3.21%
- F500 in state
- 116
Industry mix (Fortune 500 HQ in CA)
| Industry | F500 HQs | Revenue |
|---|---|---|
| Technology | 27 | $1,492B |
|
||
| Financial Services | 3 | $174B |
|
||
| Retail | 3 | $44B |
|
||
| Insurance | 3 | $26B |
|
||
| Media / Entertainment | 2 | $115B |
|
||
| Pharmaceuticals / Biotech | 2 | $62B |
|
||
Price history
1 event — show timeline
- 2026-06-01 Listed $1,699,000 bridgeMLS, Bay East AOR, or Contra Costa AOR
Property tax history
+8.5%/yrLatest (2025): $5,444 · +2.9% YoY. Source: county tax records.
Cash-flow waterfall
monthlySold comps — $/sqft
last 12 mo · ≤1 miLoading sold comps…