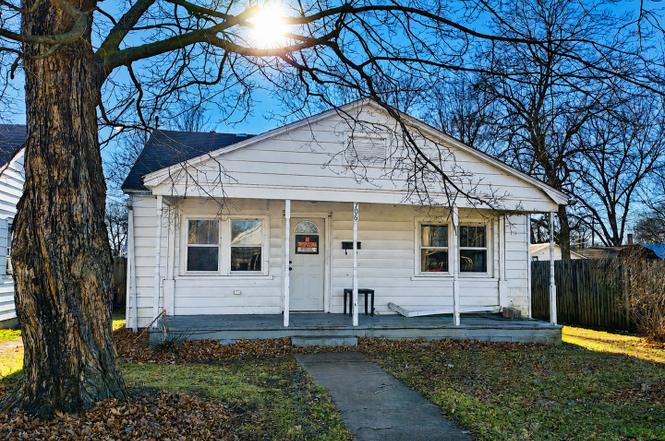
706 E 8th St · Metropolis, IL
Flood risk 1/10 · Minimal
- FEMA flood zone
- X
- Chance of flooding over 30 yrs
- 0.0%
- Est. flood insurance / yr
- $507 – $1,088
Fire risk 3/10 · Minor
- Est. fire insurance / yr
- $804 – $1,492
Heat risk 6/10 · Moderate
- Hot days now (above 108°F)
- 7 days/yr
- Hot days in 30 yrs
- 20 days/yr
Wind risk 3/10 · Minor
- Chance of severe wind over 30 yrs
- 6.0%
Air-quality risk 2/10 · Minimal
- Unhealthy air days now
- 1 days/yr
- Unhealthy air days in 30 yrs
- 2 days/yr
Risk factors via First Street. Map © Google.
Why this score? — see what drove the B- grade
The composite is a weighted blend of 9 inputs, each scored 0–100. Each bar is that input's sub-score; the figure is the points it added to the 100-point composite (weight × sub-score).
- Cash flow +30.0/30.0
- 1% rule +10.0/10.0
- DSCR +10.0/10.0
- ARV discount +7.5/15.0
- Livability +3.8/5.0
- Rent growth +2.5/5.0
- Condition / age +2.5/5.0
- Schools +2.2/10.0
- Appreciation +0.0/10.0
$45,000
🖨 Deal sheet (PDF) 📄 Offer letter ✓ Due diligence
Listing remarks
Perfect for investors, flippers, or buyers ready to create something from the ground up-bring your vision and make this one shine! This 2-bedroom, 1-bath bungalow is a true blank canvas with the rehab already underway! Mechanical systems are of unknown condition. Attic space with the potential to become a 3rd bedroom with the addition of a permanent staircase. Detached garage with alley access. Check out the photos at the end that show the potential of this little gem!
Key facts
- Alley access
- Detached garage
- 5,662 sq ft lot
Tags
Property features AI
Finance
- HOA & community: No master association fee required
Exterior
- Parking: Detached garage (2 garage spaces); Total parking for 4 vehicles
- Utilities: Public water; Public sewer; 100 amp electric service
- Home design: Detached single-family home; One-story; Fee simple ownership; Estimated living area
- Construction: Built approximately 61–70 years ago; Aluminum and wood siding; Asphalt roof; Finished/unfinished total finished area approximately 840
- Exterior features: Level lot; Lot dimensions approximately 40 x 150
Interior
- Kitchen: Kitchen on main level
- Bedrooms: 2 bedrooms (both on main level); Master bedroom on main level
- Flooring: Hardwood flooring in living areas, kitchen, and bedrooms; Linoleum in laundry room
- Bathrooms: 1 full bathroom
- Heating & cooling: Natural gas and electric heating
- Interior features: Finished and unfinished attic; 4 total rooms
- Laundry & utility: Main-level laundry room (12 x 7) with linoleum flooring
Neighborhood map
What this means for you Summary
Snapshot
- This is a 2-bed/1.0-bath other listed at $45k.
Deal economics
- At list price, monthly cash flow is $383 ($5k/yr) — positive.
- The deal already cash-flows at list — no discount required.
- Meets the 1% rule at list price ($853 rent vs $45k).
- Recommended offer: $40k (12.0% below list) — sets the bar for market timing.
- Cap rate 16.5% vs local median 5.3% in Metropolis — top-decile yield for the area; either an underpriced asset or a hidden risk that comps aren't pricing in. Stress-test before assuming the spread holds.
Location & tenants
- Location reads 75/100 on livability (#217 in IL, #4,091 nationally) — a middle-class / working-renter tenant base. Strengths: cost of living A+, housing A+, health & safety A+; Watch: commute F, employment D-.
- Massac UD 1 (rural): math 24% / reading 28% proficiency, ranked #318 of 620 in IL (top 51%) — low school quality limits family demand, transient renter base, plan for 1-2y turnover.
- Zoned schools: Metropolis Elem School (math 11% / reading 15%, grade F, #1,362 of 2,056 statewide, top 66%, 484 students, 0% FRL); Massac Jr High School (math 25% / reading 36%, grade F, #241 of 665 statewide, top 37%, 244 students, 0% FRL); Massac County High School (math 12% / reading 27%, grade F, #397 of 693 statewide, top 61%, 583 students, 0% FRL) — zoned schools average 0% FRL vs 52% district-wide (52 pts lower); this property's tenant base skews higher-income than the district average.
- Market conditions: 72 active listings in the ZIP; 5 units permitted in Massac County in 2024 (0 in 5+ unit buildings).
Forward outlook
- Local home prices are declining (-3.0%/yr); year-one equity from $311 of loan paydown is wiped out by about $1k of value loss. Plan a longer hold.
- Massac County population projected at -28% by 2050 — secular population decline; favor cash flow + early exit over multi-decade hold.
- At projected returns (-3.0% appreciation + 3.0% rent growth), your $13k cash investment doubles in ~4 years — after that, you're playing with house money.
Negotiation context
- It's been on market 158 days — a 12% lower offer ($40k) is reasonable based on typical stale-listing flexibility.
Risks & watch-outs
- Climate carrying-cost: extreme-heat days projected 7→20/yr by 2055 (HVAC capex compounding) — expect insurance premiums to compound above CPI over the hold.
Questions for the listing agent
- It's been on market 158 days. Have you received any prior offers? Is the seller open to a 12% concession, seller financing, or rate buy-down credit?
- Why hasn't it sold? Are there any deal-killer items the seller is aware of (foundation, flood, title, zoning, code violations)?
- Is there a deadline driving the sale (1031 exchange, divorce, estate, relocation)? That informs how much negotiation room exists.
- Schools are D-rated, which usually means shorter tenancies and higher turnover. Who's the typical renter profile here, and what's been the actual vacancy rate?
- What's the average days-on-market for RENTAL listings here right now (not sales)? A rising rental-DOM trend means longer vacancies and softer asking-rent achievability than the comps imply.
- What's the recent tenant-quality profile in this submarket — average credit score on applications, eviction rate, late-payment / NSF rate, and stable-employment percentage? A property-management company in the area should have these aggregated.
- How much new for-sale + rental construction is in the pipeline within 1–3 miles? Heavy new supply typically softens prices + rents 12–24 months out; constrained supply supports both.
Investment metrics
- 1% rule
- 1.90% ✓
- Cap rate
- 16.51%
- Cash-on-cash
- 36.47%
- DSCR
- 2.62
- GRM
- 4.4
CMA / ARV
No comps found within radius.
Projected returns pro-forma
-3.0% appreciation · 3.0% rent growth · sell at horizon
- IRR
- 32.3%
- Equity multiple
- 2.36×
- Total profit
- $17,100
- Equity at exit
- $6,710
- IRR
- 39.3%
- Equity multiple
- 4.67×
- Total profit
- $46,302
- Equity at exit
- $3,891
Cash invested: $12,600 (down + closing). Projections, not guarantees.
Landlord ↔ Tenant lean methodology
- Overall (STATE)
- 43 Moderately Tenant-Leaning
- State Illinois
- 43 Moderately Tenant-Leaning · D+7
- County
- — inherits STATE
- City
- — inherits STATE
ZIP-level market 62960
- Home prices YoY
- -19.6%
- Active inventory
- 72
- Price-to-rent
- 4.4×
Monthly cashflow live
- Estimated rent
- $853 medium interval (Pro) →
- Mortgage (P&I)
- −$236
- Tax from tax record
- −$36 /mo · $436/yr
- Insurance
- −$19
- HOA
- −$0
- Vacancy / Maint / Mgmt
- −$179
- Net cashflow
- $383
Break-even live
Sensitivity live
| Price | -10% $408 | -5% $396 | +0% $383 | +5% $370 | +10% $357 |
|---|---|---|---|---|---|
| Rent | -10% $316 | -5% $349 | +0% $383 | +5% $417 | +10% $450 |
| Rate | -1.0pp $406 | -0.5pp $394 | base $383 | +0.5pp $371 | +1.0pp $359 |
UW: 25.0% down · 7.5% · 30yr · 1.5% tax · 5.0% vac · 8.0% maint · 8.0% mgmt
Financing live
Cash to close
- Down payment
- $11,250
- Closing costs
- $1,350
- Reserves months
- —
- Total cash needed
- —
Loan-product check · same deal, 3 products live
Conventional
25% down · 7.5% · 30yr
- Down + closing
- —
- Monthly P&I
- —
- Monthly cashflow
- —
- DSCR
- —
- Eligible?
- —
Personal DTI + credit; lowest rate.
DSCR
20% down · 8.5% · 30yr
- Down + closing
- —
- Monthly P&I
- —
- Monthly cashflow
- —
- DSCR
- —
- Eligible?
- —
No personal income docs; deal must DSCR.
Hard money
10% down · 12.0% · 12mo
- Down + closing
- —
- Monthly P&I
- —
- Monthly cashflow
- —
- DSCR
- —
- Eligible?
- —
Short-term bridge; refi at stabilization.
Listing history 19 events
-
2026-06-22days on market $45,000 Active 158 DOM
-
2026-06-21days on market $45,000 Active 157 DOM
-
2026-06-21days on market $45,000 Active 156 DOM
-
2026-06-18days on market $45,000 Active 154 DOM
-
2026-06-17days on market $45,000 Active 153 DOM
-
2026-06-16days on market $45,000 Active 152 DOM
-
2026-06-15days on market $45,000 Active 151 DOM
-
2026-06-13days on market $45,000 Active 149 DOM
-
2026-06-12days on market $45,000 Active 148 DOM
-
2026-06-09days on market $45,000 Active 145 DOM
-
2026-06-08days on market $45,000 Active 144 DOM
-
2026-06-07days on market $45,000 Active 143 DOM
-
2026-06-05days on market $45,000 Active 141 DOM
-
2026-06-04days on market $45,000 Active 139 DOM
-
2026-06-02days on market $45,000 Active 138 DOM
-
2026-06-01days on market $45,000 Active 137 DOM
-
2026-05-31days on market $45,000 Active 136 DOM
-
2026-05-31days on market $45,000 Active 135 DOM
-
2026-01-13$45,000 Active
ⓘ Source: listings_history table (triggers on properties + properties_extension) + one-shot
backfill from property_details.listing_events for pre-trigger history.
Tax reassessment forecast IL · Partial reset (capped growth)
- Current annual tax
- $436 · $36/mo
- Projected year-2 tax
- $729 · $61/mo
- Expected delta
- +$293/yr (+$24/mo · 67.1%)
ⓘ Screening estimate from a state-policy table — verify with the county assessor before closing.
Climate risk First Street
- Flood 1/10 Low FEMA zone X · 0% chance over 30 yrs
- Wildfire 3/10 Moderate
- Heat 6/10 Major 7 d/yr ≥108°F today · 20 d/yr by 30 yrs out
- Wind 3/10 Moderate 6% chance of damaging wind over 30 yrs
- Air quality 2/10 Low 1 unhealthy d/yr today · 2 by 30 yrs out
Nearby sold comps map
Loading sold comps map…
Walkable amenities ~0.75 mi
Loading nearby amenities…
Taxation est. · year 1
- Rental income
- $10,239
- − Mortgage interest
- −$2,521
- − Property taxes
- −$436
- − Insurance
- −$225
- − Repairs & maintenance
- −$819
- − Management
- −$819
- − Depreciation
- −$1,309
- Taxable income
- $4,110
- Est. tax owed @ 24.0%
- −$986
- After-tax cash flow
- $3,609/yr
For passive investors: Depreciation is non-cash, so a rental often shows a tax loss while cash-flowing — sheltering income. Rental losses are passive: they offset passive income freely, and up to $25,000/yr can offset ordinary (W-2) income if you actively participate and your MAGI is under $100k (phasing out to $0 by $150k); unused losses carry forward. On sale, claimed depreciation is recaptured at up to 25%, and gains may owe capital-gains tax (a 1031 exchange can defer both). Figures are a year-1 estimate at your 24.0% rate — not tax advice; consult a CPA.
Schools (NCES district)
- District
- Massac UD 1
- NCES district ID
- 1725000
- Math proficiency
- 24% ▼ -13.00%
- Reading proficiency
- 28% ▼ -13.00%
- Median HH income
- $41,431
- Composite
- 22.06/100
- National rank
- #8192
- State rank
- #318 of 620 in IL
Livability — Metropolis
- Score
- 75/100
- State rank
- #217
- US rank
- #4091
Category grades
Schools grade is shown separately in the Schools card above.
Census & demographics
- Census place
- Metropolis, IL
- Population (ZIP)
- 10,823
Population outlook (Massac County) Hauer SSP2
- Today (2025)
- 13,461 people
- By 2030
- 12,675 · -5.8%
- By 2040
- 11,124 · -17.4%
- By 2050
- 9,711 · -27.9%
- By 2075
- 7,253 · -46.1%
- By 2100
- 5,666 · -57.9%
Race, ethnicity, and origin ACS 2023
- Neighborhood character
- Predominantly White (86%)
- Race & ethnicity
- White 86% Black 7% Two or more races 5% Hispanic / Latino 3%
- Common ancestry
- Romanian 2% Serbian 2% Lithuanian 2%
- Foreign-born
- 2% · Canada
- Languages at home
- 97% English-only · Spanish 2%
Political lean MEDSL · Massac
- 2024 margin
- Solid R (+48.8) · D 25.2% · R 74.0%
- 2008→2024 swing
- -25.4pp toward R · 2008: -23.4pp · 2024: -48.8pp
- All cycles
- 2024: R+48.8 2020: R+48.0 2016: R+49.6 2012: R+33.7 2008: R+23.4
Not yet ingested
- Civics
- —
Market trends
- HPI YoY
- ▼ -33.38%
- Current HPI
- 137.0772
- Rent YoY
- —
- Metro
- —
- State GDP YoY
- ▲ 1.59%
- F500 in state
- 60
Industry mix (Fortune 500 HQ in IL)
| Industry | F500 HQs | Revenue |
|---|---|---|
| Insurance | 4 | $201B |
|
||
| Consumer Goods | 4 | $87B |
|
||
| Industrial Machinery | 3 | $64B |
|
||
| Healthcare | 2 | $55B |
|
||
| Retail / Pharmacy | 1 | $148B |
|
||
| Agriculture / Food | 1 | $86B |
|
||
Price history
1 event — show timeline
- 2026-01-13 Listed $45,000 MRED as Distributed by MLS Grid
Property tax history
-4.4%/yrLatest (2024): $436 · -4.5% YoY. Source: county tax records.
Cash-flow waterfall
monthlySold comps — $/sqft
last 12 mo · ≤1 miLoading sold comps…