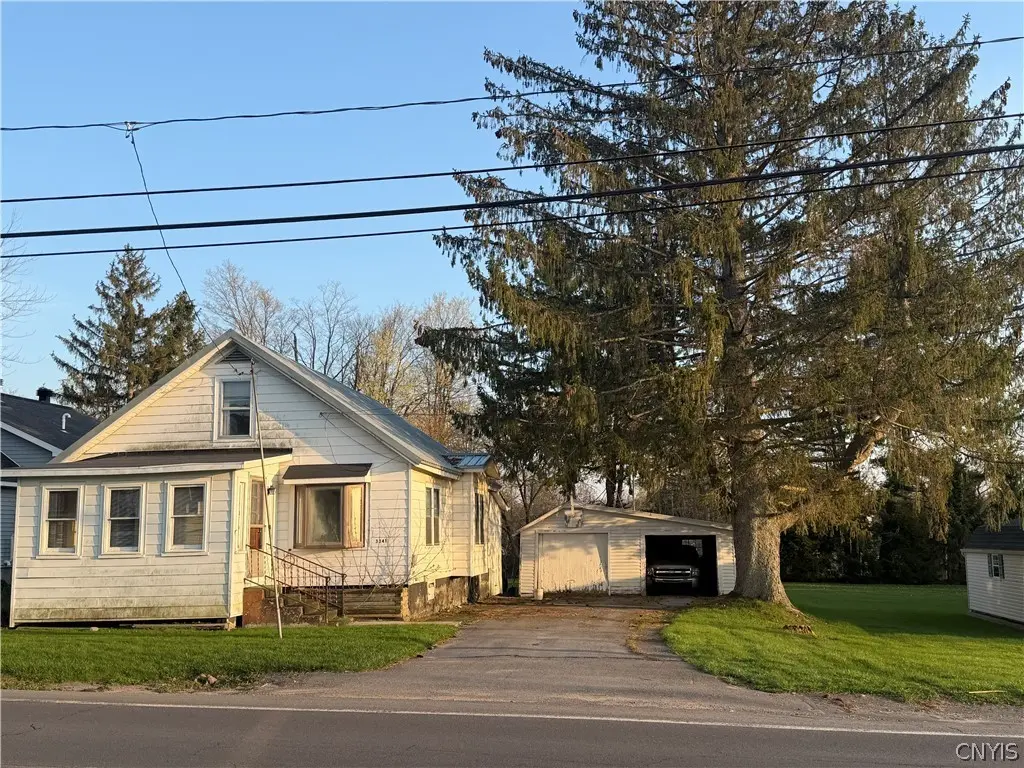
3341 Maple Ave · Pulaski, NY
Flood risk 1/10 · Minimal
- FEMA flood zone
- X (unshaded)
- Chance of flooding over 30 yrs
- 0.0%
- Est. flood insurance / yr
- $473 – $860
Fire risk 2/10 · Minimal
- Est. fire insurance / yr
- $691 – $1,283
Heat risk 2/10 · Minimal
- Hot days now (above 91°F)
- 7 days/yr
- Hot days in 30 yrs
- 18 days/yr
Wind risk 1/10 · Minimal
- Chance of severe wind over 30 yrs
- 0.0%
Air-quality risk 3/10 · Minor
- Unhealthy air days now
- 3 days/yr
- Unhealthy air days in 30 yrs
- 4 days/yr
Risk factors via First Street. Map © Google.
Why this score? — see what drove the C grade
The composite is a weighted blend of 9 inputs, each scored 0–100. Each bar is that input's sub-score; the figure is the points it added to the 100-point composite (weight × sub-score).
- ARV discount +15.0/15.0
- Cash flow +13.4/30.0
- Appreciation +9.1/10.0
- 1% rule +4.5/10.0
- Schools +4.3/10.0
- DSCR +4.0/10.0
- Livability +3.7/5.0
- Rent growth +2.5/5.0
- Condition / age +2.5/5.0
$135,000
🖨 Deal sheet (PDF) 📄 Offer letter ✓ Due diligence
Listing remarks
Welcome home to 3341 Maple Ave in the Village of Pulaski! This home offers 3 bedrooms, 1 full bath, a spacious floor plan and first floor laundry. Step outside to enjoy a concrete patio that overlooks a large, beautifully sized backyard—perfect for relaxing, entertaining, or future landscaping ideas. A detached garage with additional workspace adds both practicality and versatility. Inside, you’ll find great potential to make the home your own, with opportunities for updates and personalization throughout. The living room and kitchen are large with lots of windows and natural light. The newer roof provides peace of mind, while the full attic-with stair access—offers the p
Key facts
- Large backyard
- Concrete patio
- Full attic
Tags
Property features AI
Exterior
- Parking: Detached 2-car garage
- Utilities: Electricity connected (fuses); Public water connected; Sewer connected
- Home design: Single-story; Resale property; Existing structure
- Construction: Aluminum siding; Metal roof; Block foundation
- Exterior features: Concrete driveway; Rectangular lot; Main thoroughfare frontage; Lot dimensions approximately 60 x 266
Interior
- Kitchen: Electric oven; Electric range; Freezer
- Bedrooms: 3 main-level bedrooms
- Flooring: Carpet; Varies
- Bathrooms: 1 full bathroom (main level)
- Heating & cooling: Gas heating; Baseboard heating; Has heating
- Interior features: Eat-in kitchen; Country kitchen; Convertible bedroom; Bath in primary bedroom; Main level primary; See remarks; Other
- Laundry & utility: Main-level laundry; Washer; Dryer; Electric water heater
Neighborhood map
What this means for you Summary
Snapshot
- This is a 2-bed/1.0-bath single-family listed at $135k.
Deal economics
- At list price, monthly cash flow is $2 ($19/yr) — positive.
- The deal already cash-flows at list — no discount required.
- To meet the 1% rule (rent ≥ 1% of price), the offer needs to be $129k (4.6% below list).
- Recommended offer: $129k (4.6% below list) — sets the bar for 1% rule.
- Cap rate 6.3% vs local median 4.3% in Pulaski — top-decile yield for the area; either an underpriced asset or a hidden risk that comps aren't pricing in. Stress-test before assuming the spread holds.
Location & tenants
- Location reads 74/100 on livability (#302 in NY, #4,860 nationally) — a middle-class / working-renter tenant base. Strengths: housing A+, health & safety A+, crime A; Watch: amenities D-, commute F.
- Pulaski Central School District (rural): math 44% / reading 58% proficiency, ranked #377 of 590 in NY (top 64%) — acceptable for families but not a draw, mixed tenant base, ~2y average lease.
- Zoned schools: Pulaski Elementary School (math 42% / reading 52%, grade D-, #1,195 of 2,108 statewide, top 60%, 427 students, 54% FRL); Pulaski Middle-High School (math 46% / reading 63%, grade C-, #912 of 1,100 statewide, top 85%, 517 students, 46% FRL).
- Market conditions: 64 active listings in the ZIP; 172 units permitted in Oswego County in 2024 (27 in 5+ unit buildings).
Forward outlook
- In year one you build about $12k of equity ($933 loan paydown + $11k appreciation (8.1% local appreciation)).
- Oswego County population projected at -23% by 2050 — secular population decline; favor cash flow + early exit over multi-decade hold.
- At projected returns (8.1% appreciation + 3.0% rent growth), your $38k cash investment doubles in ~3 years — after that, you're playing with house money.
- By year 4, paydown + projected appreciation supports a ~$41k cash-out refi (75% LTV) — recoverable capital for the next deal without selling this one.
Negotiation context
- It's been on market 54 days — a 3% lower offer ($131k) is reasonable based on typical stale-listing flexibility.
Risks & watch-outs
- Watch-outs: built in 1920 — expect roof / HVAC / electrical / plumbing capex.
Questions for the listing agent
- It's been on market 54 days. Have you received any prior offers? Is the seller open to a 5% concession, seller financing, or rate buy-down credit?
- Built in 1920 — when were the roof, HVAC, electrical panel, plumbing, and water heater last replaced?
- Is there a deadline driving the sale (1031 exchange, divorce, estate, relocation)? That informs how much negotiation room exists.
- What's the average days-on-market for RENTAL listings here right now (not sales)? A rising rental-DOM trend means longer vacancies and softer asking-rent achievability than the comps imply.
- What's the recent tenant-quality profile in this submarket — average credit score on applications, eviction rate, late-payment / NSF rate, and stable-employment percentage? A property-management company in the area should have these aggregated.
- How much new for-sale + rental construction is in the pipeline within 1–3 miles? Heavy new supply typically softens prices + rents 12–24 months out; constrained supply supports both.
Investment metrics
- 1% rule
- 0.95% ✗
- Cap rate
- 6.31%
- Cash-on-cash
- 0.05%
- DSCR
- 1.00
- GRM
- 8.7
CMA / ARV
- ARV (median comp)
- $209,790
- List price
- $135,000
- Delta
- -35.65%
- Verdict
- UNDERPRICED
- Comps
- 20 within 1.0 mi
Show comp detail 4 sales within ~0.75 mi
| Address | Dist | Beds/Ba | Sqft | Sold | Price | $/sf | Match |
|---|---|---|---|---|---|---|---|
| 31 Pine St | 0.37mi | 2/2.0 | 1,688 (+6%) | 23mo | $158,000 | $94 | 50 |
| 4961 N Jefferson St | 0.58mi | 3/1.5 (+1) | 1,716 (+8%) | 7mo | $240,900 | $140 | 47 |
| 4933 N Jefferson St | 0.51mi | 3/1.0 (+1) | 1,408 (-12%) | 7mo | $115,000 | $82 | 45 |
| 80 Delano St | 0.35mi | 3/2.0 (+1) | 1,822 (+14%) | 22mo | $240,000 | $132 | 33 |
Match score weights: distance 35% · size 25% · config 20% · recency 20%. Top-matched comps best support the ARV.
Projected returns pro-forma
8.13% appreciation · 3.0% rent growth · sell at horizon
- IRR
- 20.3%
- Equity multiple
- 2.51×
- Total profit
- $56,941
- Equity at exit
- $103,794
- IRR
- 18.9%
- Equity multiple
- 5.37×
- Total profit
- $165,326
- Equity at exit
- $207,214
Cash invested: $37,800 (down + closing). Projections, not guarantees.
Landlord ↔ Tenant lean methodology
- Overall (STATE)
- 15 Strongly Tenant-Friendly
- State New York
- 15 Strongly Tenant-Friendly · D+10
- County
- — inherits STATE
- City
- — inherits STATE
ZIP-level market 13142
- Home prices YoY
- 2.8%
- Active inventory
- 64
- Price-to-rent
- 8.7×
Monthly cashflow live
- Estimated rent
- $1,287 medium interval (Pro) →
- Mortgage (P&I)
- −$708
- Tax from tax record
- −$251 /mo · $3,014/yr
- Insurance
- −$56
- HOA
- −$0
- Vacancy / Maint / Mgmt
- −$270
- Net cashflow
- $2
Break-even live
Sensitivity live
| Price | -10% $78 | -5% $40 | +0% $2 | +5% $-37 | +10% $-75 |
|---|---|---|---|---|---|
| Rent | -10% $-100 | -5% $-49 | +0% $2 | +5% $52 | +10% $103 |
| Rate | -1.0pp $70 | -0.5pp $36 | base $2 | +0.5pp $-33 | +1.0pp $-69 |
UW: 25.0% down · 7.5% · 30yr · 1.5% tax · 5.0% vac · 8.0% maint · 8.0% mgmt
Financing live
Cash to close
- Down payment
- $33,750
- Closing costs
- $4,050
- Reserves months
- —
- Total cash needed
- —
Loan-product check · same deal, 3 products live
Conventional
25% down · 7.5% · 30yr
- Down + closing
- —
- Monthly P&I
- —
- Monthly cashflow
- —
- DSCR
- —
- Eligible?
- —
Personal DTI + credit; lowest rate.
DSCR
20% down · 8.5% · 30yr
- Down + closing
- —
- Monthly P&I
- —
- Monthly cashflow
- —
- DSCR
- —
- Eligible?
- —
No personal income docs; deal must DSCR.
Hard money
10% down · 12.0% · 12mo
- Down + closing
- —
- Monthly P&I
- —
- Monthly cashflow
- —
- DSCR
- —
- Eligible?
- —
Short-term bridge; refi at stabilization.
Listing history 14 events
-
2026-06-17status $135,000 Pending 54 DOM
-
2026-06-16days on market $135,000 Active Under Contract 54 DOM
-
2026-06-15days on market $135,000 Active Under Contract 53 DOM
-
2026-06-13days on market $135,000 Active Under Contract 51 DOM
-
2026-06-12days on market $135,000 Active Under Contract 50 DOM
-
2026-06-09days on market $135,000 Active Under Contract 47 DOM
-
2026-06-08days on market $135,000 Active Under Contract 46 DOM
-
2026-06-07statusdays on market $135,000 Active Under Contract 45 DOM
-
2026-06-05days on market $135,000 Active 43 DOM
-
2026-06-04days on market $135,000 Active 41 DOM
-
2026-06-02days on market $135,000 Active 40 DOM
-
2026-06-01days on market $135,000 Active 39 DOM
-
2026-05-31days on market $135,000 Active 38 DOM
-
2026-04-23$135,000 Active 873-char remark
ⓘ Source: listings_history table (triggers on properties + properties_extension) + one-shot
backfill from property_details.listing_events for pre-trigger history.
Tax reassessment forecast NY · Partial reset (capped growth)
- Current annual tax
- $3,014 · $251/mo
- Projected year-2 tax
- $3,014 · $251/mo
- Expected delta
- $0/yr ($0/mo · 0.0%)
ⓘ Screening estimate from a state-policy table — verify with the county assessor before closing.
Climate risk First Street
- Flood 1/10 Low FEMA zone X (unshaded) · 0% chance over 30 yrs
- Wildfire 2/10 Low
- Heat 2/10 Low 7 d/yr ≥91°F today · 18 d/yr by 30 yrs out
- Wind 1/10 Low 0% chance of damaging wind over 30 yrs
- Air quality 3/10 Moderate 3 unhealthy d/yr today · 4 by 30 yrs out
Nearby sold comps map
Loading sold comps map…
Walkable amenities ~0.75 mi
Loading nearby amenities…
Taxation est. · year 1
- Rental income
- $15,448
- − Mortgage interest
- −$7,562
- − Property taxes
- −$3,014
- − Insurance
- −$675
- − Repairs & maintenance
- −$1,236
- − Management
- −$1,236
- − Depreciation
- −$3,927
- Taxable loss
- −$2,202
- Est. tax savings @ 24.0%
- +$529
- After-tax cash flow
- $548/yr
For passive investors: Depreciation is non-cash, so a rental often shows a tax loss while cash-flowing — sheltering income. Rental losses are passive: they offset passive income freely, and up to $25,000/yr can offset ordinary (W-2) income if you actively participate and your MAGI is under $100k (phasing out to $0 by $150k); unused losses carry forward. On sale, claimed depreciation is recaptured at up to 25%, and gains may owe capital-gains tax (a 1031 exchange can defer both). Figures are a year-1 estimate at your 24.0% rate — not tax advice; consult a CPA.
Schools (NCES district)
- District
- Pulaski Central School District
- NCES district ID
- 3623880
- Math proficiency
- 44% ▼ -1.00%
- Reading proficiency
- 58% ▲ 13.00%
- Median HH income
- $44,689
- Composite
- 43.06/100
- National rank
- #3095
- State rank
- #377 of 590 in NY
Livability — Pulaski
- Score
- 74/100
- State rank
- #302
- US rank
- #4860
Category grades
Schools grade is shown separately in the Schools card above.
Census & demographics
- Census place
- Pulaski, NY
- City population
- 6,568
- Population (ZIP)
- 6,568
Population outlook (Oswego County) Hauer SSP2
- Today (2025)
- 114,465 people
- By 2030
- 109,968 · -3.9%
- By 2040
- 99,205 · -13.3%
- By 2050
- 87,979 · -23.1%
- By 2075
- 65,100 · -43.1%
- By 2100
- 47,117 · -58.8%
Race, ethnicity, and origin ACS 2023
- Neighborhood character
- Predominantly White (93%)
- Race & ethnicity
- White 93% Two or more races 4%
- Common ancestry
- Lithuanian 5% Romanian 3% Italian 3%
- Foreign-born
- 1%
- Languages at home
- 98% English-only · German/W. Germanic 1% Arabic 1%
Political lean MEDSL · Oswego
- 2024 margin
- Strong R (+24.2) · D 37.9% · R 62.1%
- 2008→2024 swing
- -26.6pp toward R · 2008: 2.5pp · 2024: -24.2pp
- All cycles
- 2024: R+24.2 2020: R+20.2 2016: R+23.2 2012: D+7.9 2008: D+2.5
Not yet ingested
- Civics
- —
Market trends
- HPI YoY
- ▲ 8.13%
- Current HPI
- 294.1918
- Rent YoY
- —
- Metro
- —
- State GDP YoY
- ▲ 2.60%
- F500 in state
- 92
Industry mix (Fortune 500 HQ in NY)
| Industry | F500 HQs | Revenue |
|---|---|---|
| Financial Services | 10 | $950B |
|
||
| Consumer Goods | 9 | $162B |
|
||
| Insurance | 4 | $225B |
|
||
| Telecommunications | 2 | $144B |
|
||
| Pharmaceuticals | 2 | $112B |
|
||
| Media / Entertainment | 2 | $69B |
|
||
Price history
3 events — show timeline
- 2026-06-16 Pending — CNYIS
- 2026-06-05 Contingent — CNYIS
- 2026-04-23 Listed $135,000 CNYIS
Property tax history
+10.1%/yrLatest (2025): $3,014 · +18.3% YoY. Source: county tax records.
Cash-flow waterfall
monthlySold comps — $/sqft
last 12 mo · ≤1 miLoading sold comps…