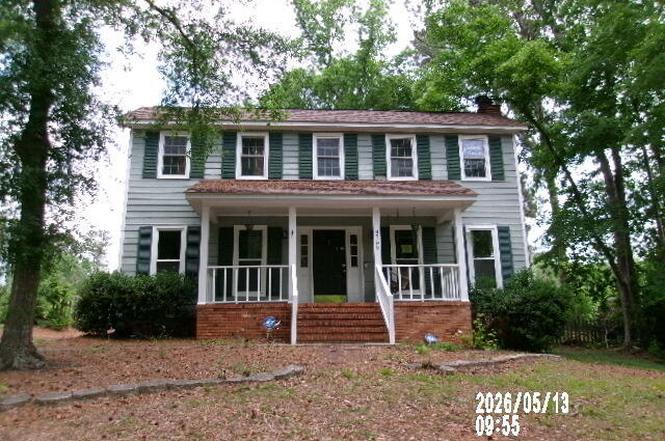
4755 Maple Spring Ct · Evans, GA
Flood risk 1/10 · Minimal
- FEMA flood zone
- X (unshaded)
- Chance of flooding over 30 yrs
- 0.0%
- Est. flood insurance / yr
- $507 – $1,088
Fire risk 3/10 · Minor
- Est. fire insurance / yr
- $963 – $1,789
Heat risk 6/10 · Moderate
- Hot days now (above 105°F)
- 7 days/yr
- Hot days in 30 yrs
- 17 days/yr
Wind risk 6/10 · Moderate
- Chance of severe wind over 30 yrs
- 66.0%
Air-quality risk 3/10 · Minor
- Unhealthy air days now
- 2 days/yr
- Unhealthy air days in 30 yrs
- 3 days/yr
Risk factors via First Street. Map © Google.
Why this score? — see what drove the C grade
The composite is a weighted blend of 9 inputs, each scored 0–100. Each bar is that input's sub-score; the figure is the points it added to the 100-point composite (weight × sub-score).
- Cash flow +17.8/30.0
- ARV discount +15.0/15.0
- DSCR +5.6/10.0
- 1% rule +4.8/10.0
- Schools +4.5/10.0
- Livability +3.9/5.0
- Rent growth +2.8/5.0
- Condition / age +2.5/5.0
- Appreciation +0.0/10.0
$182,000
🖨 Deal sheet (PDF) 📄 Offer letter ✓ Due diligence
Listing remarks MLS
CHARMING WITH MANY EXTRAS, LAMINATE IN THE GREATROOM AND DINING ROOM, FIREPLACE, ROCKING CHAIR FRONT PORCH, NEW WINDOWS IN FRONT ROOMS, BEAUTIFUL INSIDE COLORS. GREAT LOCATION TO FT. GORDON. PRICE REDUCED.
Key facts
- 0.36 acre lot
- Built 1982
- Listed 42 days
Property features AI
Exterior
- Parking: Concrete parking pad
- Security: Smoke detectors
- Utilities: Public water; Public sewer
- Home design: Single-family residence; Two levels / 2 stories
- Construction: Brick and wood siding exterior; Composition roof; Crawl space foundation; Built as a residential single family home
- Exterior features: Patio; Front porch; Outbuilding; Lot features: see remarks; Lot dimensions approximately 85 x 181 x 80 x 181 (0.36 acres)
Interior
- Kitchen: Refrigerator; Range; Dishwasher
- Bedrooms: Total rooms: 6 (includes bedrooms and other living spaces)
- Flooring: Carpet; Vinyl; Ceramic tile; Hardwood; See remarks
- Bathrooms: 2 full bathrooms; 1 half bathroom
- Heating & cooling: Central air; Ceiling fans; Forced air heating; Electric heating; Natural gas heating; Fireplace(s)
- Interior features: Walk-in closets; Window coverings; See remarks (additional interior details)
- Laundry & utility: Washer hookup; Gas water heater
Neighborhood map
What this means for you Summary
Snapshot
- This is a 3-bed/2.0-bath other listed at $182k.
Deal economics
- At list price, monthly cash flow is $149 ($2k/yr) — positive.
- The deal already cash-flows at list — no discount required.
- To meet the 1% rule (rent ≥ 1% of price), the offer needs to be $178k (2.2% below list).
- Recommended offer: $177k (3.0% below list) — sets the bar for market timing.
- Cap rate 7.3% vs local median 3.8% in Evans — top-decile yield for the area; either an underpriced asset or a hidden risk that comps aren't pricing in. Stress-test before assuming the spread holds.
Location & tenants
- Location reads 77/100 on livability (#20 in GA, #3,058 nationally) — a middle-class / working-renter tenant base. Strengths: crime A+, employment A+, housing A+; Watch: amenities D+, commute F.
- Columbia County (suburban): math 49% / reading 52% proficiency, ranked #13 of 174 in GA (top 8%) — acceptable for families but not a draw, mixed tenant base, ~2y average lease.
- Zoned schools: Columbia Middle School (math 37% / reading 48%, grade D-, #122 of 470 statewide, top 26%, 993 students, 33% FRL); Evans High School (math 12% / reading 31%, grade F, #218 of 424 statewide, top 53%, 1,887 students, 30% FRL).
- Zoned-school proficiency averages 32% at this address vs 50% district-wide (-18 pts) — the specific schools serving this property underperform the Columbia County average; the district grade overstates school quality for this exact location.
- Market conditions: Rents rising (+1.1%/yr); 336 active listings in the ZIP; 18 comparable units currently listed for rent nearby; rentals at typical pace (median 26d on market — plan ~3-4 weeks tenant-placement turnaround); 44% of comp listings sitting > 30 days — soft ceiling on asking rent; solid renter incomes; 1,213 units permitted in Columbia County in 2024 (0 in 5+ unit buildings).
Forward outlook
- Local home prices are declining (-3.0%/yr); year-one equity from $1k of loan paydown is wiped out by about $5k of value loss. Plan a longer hold.
- Columbia County population projected at +62% by 2050 — long-run rental-demand tailwind backs the buy-and-hold thesis.
Negotiation context
- It's been on market 42 days — a 3% lower offer ($177k) is reasonable based on typical stale-listing flexibility.
- 17 sale attempts since 24y ago; this cycle's ask has dropped $53k (23%) from the opening price — seller is motivated, your offer sets the floor, not the list.
- Current owner paid $130k; 40% above their basis — modest negotiation headroom, anchor on the comps not their cost.
Risks & watch-outs
- Climate carrying-cost: major wind risk, 66% chance of damaging wind over 30y; extreme-heat days projected 7→17/yr by 2055 (HVAC capex compounding) — expect insurance premiums to compound above CPI over the hold.
Questions for the listing agent
- It's been on market 42 days. Have you received any prior offers? Is the seller open to a 3% concession, seller financing, or rate buy-down credit?
- Is there a deadline driving the sale (1031 exchange, divorce, estate, relocation)? That informs how much negotiation room exists.
- Schools are B-rated — typically a magnet for longer-tenancy family renters. What's the average tenant stay here, and is there a school-zone premium baked into asking?
- What's the average days-on-market for RENTAL listings here right now (not sales)? A rising rental-DOM trend means longer vacancies and softer asking-rent achievability than the comps imply.
- What's the recent tenant-quality profile in this submarket — average credit score on applications, eviction rate, late-payment / NSF rate, and stable-employment percentage? A property-management company in the area should have these aggregated.
- How much new for-sale + rental construction is in the pipeline within 1–3 miles? Heavy new supply typically softens prices + rents 12–24 months out; constrained supply supports both.
Investment metrics
- 1% rule
- 0.98% ✗
- Cap rate
- 7.27%
- Cash-on-cash
- 3.50%
- DSCR
- 1.16
- GRM
- 8.5
CMA / ARV
- ARV (median comp)
- $272,808
- List price
- $182,000
- Delta
- -33.29%
- Verdict
- UNDERPRICED
- Comps
- 20 within 1.0 mi
Projected returns pro-forma
-3.0% appreciation · 1.12% rent growth · sell at horizon
- IRR
- -12.9%
- Equity multiple
- 0.54×
- Total profit
- $-23,292
- Equity at exit
- $27,137
- IRR
- -7.1%
- Equity multiple
- 0.59×
- Total profit
- $-21,031
- Equity at exit
- $15,736
Cash invested: $50,960 (down + closing). Projections, not guarantees.
Landlord ↔ Tenant lean methodology
- Overall (STATE)
- 90 Strongly Landlord-Friendly
- State Georgia
- 90 Strongly Landlord-Friendly · R+3
- County
- — inherits STATE
- City
- — inherits STATE
ZIP-level market 30907
- Rents YoY
- 1.1%
- Active inventory
- 336
- Price-to-rent
- 8.5×
Monthly cashflow live
- Estimated rent
- $1,780 high interval (Pro) →
- Mortgage (P&I)
- −$954
- Tax est. 1.5%
- −$228 /mo · $2,730/yr
- Insurance
- −$76
- HOA
- −$0
- Lot rent
- −$0
- Vacancy / Maint / Mgmt
- −$374
- Net cashflow
- $149
Break-even live
Sensitivity live
| Price | -10% $275 | -5% $212 | +0% $149 | +5% $86 | +10% $23 |
|---|---|---|---|---|---|
| Rent | -10% $8 | -5% $79 | +0% $149 | +5% $219 | +10% $289 |
| Rate | -1.0pp $240 | -0.5pp $195 | base $149 | +0.5pp $102 | +1.0pp $54 |
UW: 25.0% down · 7.5% · 30yr · 1.5% tax · 5.0% vac · 8.0% maint · 8.0% mgmt
Financing live
Cash to close
- Down payment
- $45,500
- Closing costs
- $5,460
- Reserves months
- —
- Total cash needed
- —
Loan-product check · same deal, 3 products live
Conventional
25% down · 7.5% · 30yr
- Down + closing
- —
- Monthly P&I
- —
- Monthly cashflow
- —
- DSCR
- —
- Eligible?
- —
Personal DTI + credit; lowest rate.
DSCR
20% down · 8.5% · 30yr
- Down + closing
- —
- Monthly P&I
- —
- Monthly cashflow
- —
- DSCR
- —
- Eligible?
- —
No personal income docs; deal must DSCR.
Hard money
10% down · 12.0% · 12mo
- Down + closing
- —
- Monthly P&I
- —
- Monthly cashflow
- —
- DSCR
- —
- Eligible?
- —
Short-term bridge; refi at stabilization.
Rent comps 18 comps
| Address | Beds | Baths | Sqft | Rent | $/sqft | DOM | Units | Dist |
|---|---|---|---|---|---|---|---|---|
| 4680 Brookwood Ln Grovetown, GA | 2.0 | 2.5 | 1192 | $1,300 | $1.09 | 16d | 1 | 0.26mi |
| 807 Bell Springs Ct Grovetown, GA | 3.0 | 2.5 | 1844 | $1,900 | $1.03 | 46d | 1 | 0.57mi |
| 299 Ashbrook Dr Augusta, GA | 4.0 | 2.5 | 2080 | $2,295 | $1.10 | 46d | 1 | 0.64mi |
| 4724 Brookgreen Rd Augusta, GA | 3.0 | 2.0 | 1798 | $2,175 | $1.21 | 16d | 1 | 0.65mi |
| 303 Meadowlake Dr Martinez, GA | 3.0 | 2.0 | 1951 | $1,700 | $0.87 | 16d | 1 | 0.77mi |
| 4537 Shawnee Dr Augusta, GA | 3.0 | 2.0 | 1534 | $1,795 | $1.17 | 26d | 1 | 1.01mi |
| 327 Oak Lake Dr Augusta, GA | 3.0 | 2.0 | 1619 | $1,600 | $0.99 | 26d | 1 | 1.02mi |
| 4565 Rockdale Ct Augusta, GA | 4.0 | 3.0 | 1886 | $1,900 | $1.01 | 46d | 1 | 1.04mi |
| 4565 Rockdale Ct Augusta, GA | 4.0 | 3.0 | 1886 | $1,900 | $1.01 | 26d | 1 | 1.04mi |
| 109 Highview Dr Augusta, GA | 4.0 | 2.0 | 1675 | $1,600 | $0.96 | 16d | 1 | 1.05mi |
| 2173 Sinclair Dr Unit SC56 Grovetown, GA | 3.0 | 3.0 | 2052 | $2,475 | $1.21 | 46d | 1 | 1.10mi |
| 504 Vinings Dr Grovetown, GA | 2.0 | 2.5 | 1439 | $1,800 | $1.25 | 46d | 1 | 1.11mi |
| 1004 Leigh Lake Rd Grovetown, GA | 3.0 | 2.5 | 1358 | $1,700 | $1.25 | 46d | 1 | 1.12mi |
| 4460 Whisperwood Dr Augusta, GA | 3.0 | 2.0 | 1388 | $1,600 | $1.15 | 26d | 1 | 1.29mi |
| 336 Deerwood Ct Augusta, GA | 3.0 | 1.5 | 1064 | $1,525 | $1.43 | 46d | 1 | 1.34mi |
| 210 Foxdale Dr Evans, GA | 3.0 | 2.0 | 1618 | $1,745 | $1.08 | 26d | 1 | 1.45mi |
| 210 Foxdale Dr Evans, GA | 3.0 | 2.0 | 1618 | $1,800 | $1.11 | 46d | 1 | 1.45mi |
| 323 Crawford Mill Ln Grovetown, GA | 2.0 | 2.5 | 1152 | $1,495 | $1.30 | 26d | 1 | 1.48mi |
Listing history 50 events
-
2026-06-23days on market $182,000 Active 42 DOM
-
2026-06-22remarks 556-char remark
-
2026-06-22pricedays on market $182,000 Active 41 DOM
-
2026-06-18days on market $192,000 Active 38 DOM
-
2026-06-17days on market $192,000 Active 37 DOM
-
2026-06-16statusdays on market $192,000 Active 36 DOM
-
2026-06-15days on market $192,000 Active Under Contract 35 DOM
-
2026-06-14days on market $192,000 Active Under Contract 33 DOM
-
2026-06-13days on market $192,000 Active Under Contract 32 DOM
-
2026-06-10days on market $192,000 Active Under Contract 30 DOM
-
2026-06-09days on market $192,000 Active Under Contract 29 DOM
-
2026-06-08days on market $192,000 Active Under Contract 28 DOM
-
2026-06-07days on market $192,000 Active Under Contract 27 DOM
-
2026-06-03days on market $192,000 Active Under Contract 23 DOM
-
2026-06-02days on market $192,000 Active Under Contract 22 DOM
-
2026-06-01days on market $192,000 Active Under Contract 21 DOM
-
2026-05-31days on market $192,000 Active Under Contract 20 DOM
-
2026-05-30days on market $192,000 Active Under Contract 19 DOM
-
2026-05-13price $192,000 544-char remark
-
2026-05-11historical
-
2026-04-20price $202,000
-
2026-03-17price $212,500
-
2026-02-13price $223,500
Show marketing remark (205 chars)
CHARMING WITH MANY EXTRAS, LAMINATE IN THE GREATROOM AND DINING ROOM, FIREPLACE, ROCKING CHAIR FRONT PORCH, NEW WINDOWS IN FRONT ROOMS, BEAUTIFUL INSIDE COLORS. GREAT LOCATION TO FT. GORDON. PRICE REDUCED.
-
2026-02-13price $129,900
Show marketing remark (205 chars)
CHARMING WITH MANY EXTRAS, LAMINATE IN THE GREATROOM AND DINING ROOM, FIREPLACE, ROCKING CHAIR FRONT PORCH, NEW WINDOWS IN FRONT ROOMS, BEAUTIFUL INSIDE COLORS. GREAT LOCATION TO FT. GORDON. PRICE REDUCED.
-
2026-02-13price $109,900
Show marketing remark (205 chars)
CHARMING WITH MANY EXTRAS, LAMINATE IN THE GREATROOM AND DINING ROOM, FIREPLACE, ROCKING CHAIR FRONT PORCH, NEW WINDOWS IN FRONT ROOMS, BEAUTIFUL INSIDE COLORS. GREAT LOCATION TO FT. GORDON. PRICE REDUCED.
-
2026-01-13$235,000 Active
-
2026-01-12$202,000 Active 544-char remark
-
2025-02-28historical
-
2025-02-28historical
-
2024-09-19$238,000
-
2024-09-19$238,000
-
2023-03-24soldstatus $129,900
Show marketing remark (205 chars)
CHARMING WITH MANY EXTRAS, LAMINATE IN THE GREATROOM AND DINING ROOM, FIREPLACE, ROCKING CHAIR FRONT PORCH, NEW WINDOWS IN FRONT ROOMS, BEAUTIFUL INSIDE COLORS. GREAT LOCATION TO FT. GORDON. PRICE REDUCED.
-
2023-02-23$299,000
Show marketing remark (205 chars)
CHARMING WITH MANY EXTRAS, LAMINATE IN THE GREATROOM AND DINING ROOM, FIREPLACE, ROCKING CHAIR FRONT PORCH, NEW WINDOWS IN FRONT ROOMS, BEAUTIFUL INSIDE COLORS. GREAT LOCATION TO FT. GORDON. PRICE REDUCED.
-
2022-12-07soldstatus $229,900
-
2022-12-05soldstatus $229,900
-
2022-12-05soldstatus $229,900
-
2022-08-04$229,900
-
2022-08-04$229,900
-
2021-04-29soldstatus $109,900
-
2021-01-04$140,000
-
2019-07-16soldstatus $167,400
-
2019-07-08soldstatus $167,400
-
2019-07-08soldstatus $167,400
-
2019-05-10$164,900
-
2019-05-10$164,900
-
2018-01-04soldstatus $150,000
-
2017-12-29soldstatus $150,000
-
2017-12-29soldstatus $150,000
-
2017-08-22$155,000
-
2017-08-22$155,000
ⓘ Source: listings_history table (triggers on properties + properties_extension) + one-shot
backfill from property_details.listing_events for pre-trigger history.
Climate risk First Street
- Flood 1/10 Low FEMA zone X (unshaded) · 0% chance over 30 yrs
- Wildfire 3/10 Moderate
- Heat 6/10 Major 7 d/yr ≥105°F today · 17 d/yr by 30 yrs out
- Wind 6/10 Major 66% chance of damaging wind over 30 yrs
- Air quality 3/10 Moderate 2 unhealthy d/yr today · 3 by 30 yrs out
Nearby sold comps map
Loading sold comps map…
Walkable amenities ~0.75 mi
Loading nearby amenities…
Taxation est. · year 1
- Rental income
- $21,366
- − Mortgage interest
- −$10,195
- − Property taxes
- −$2,730
- − Insurance
- −$910
- − Repairs & maintenance
- −$1,709
- − Management
- −$1,709
- − Depreciation
- −$5,295
- Taxable loss
- −$1,182
- Est. tax savings @ 24.0%
- +$284
- After-tax cash flow
- $2,070/yr
For passive investors: Depreciation is non-cash, so a rental often shows a tax loss while cash-flowing — sheltering income. Rental losses are passive: they offset passive income freely, and up to $25,000/yr can offset ordinary (W-2) income if you actively participate and your MAGI is under $100k (phasing out to $0 by $150k); unused losses carry forward. On sale, claimed depreciation is recaptured at up to 25%, and gains may owe capital-gains tax (a 1031 exchange can defer both). Figures are a year-1 estimate at your 24.0% rate — not tax advice; consult a CPA.
Schools (NCES district)
- District
- Columbia County
- NCES district ID
- 1301410
- Math proficiency
- 49% ▼ -6.00%
- Reading proficiency
- 52% ▼ -4.00%
- Median HH income
- $69,358
- Composite
- 45.04/100
- National rank
- #2695
- State rank
- #13 of 174 in GA
Livability — Evans
- Score
- 77/100
- State rank
- #20
- US rank
- #3058
Category grades
Schools grade is shown separately in the Schools card above.
Census & demographics
- County
- Columbia County · 154,184 people
- City population
- 54,743
- Metro
- Augusta-Richmond County, GA-SC
- Population (ZIP)
- 46,975
- Household income
- $81,912
- Rent vs Own
- Severe rent burden
- 983.0
Population outlook (Columbia County) Hauer SSP2
- Today (2025)
- 189,073 people
- By 2030
- 212,277 · +12.3%
- By 2040
- 259,480 · +37.2%
- By 2050
- 306,991 · +62.4%
- By 2075
- 421,213 · +122.8%
- By 2100
- 496,722 · +162.7%
Race, ethnicity, and origin ACS 2023
- Neighborhood character
- Predominantly White (69%)
- Race & ethnicity
- White 69% Black 13% Asian 7% Hispanic / Latino 7% Two or more races 5%
- Hispanic origin (detail)
- Mexican 5% Puerto Rican 1%
- Common ancestry
- Serbian 2% Slovak 2% Lithuanian 2%
- Foreign-born
- 10% · Canada, Vietnam, China
- Languages at home
- 87% English-only · Spanish 5% Other Indo-European 2% Vietnamese 1%
Political lean MEDSL · Columbia
- 2024 margin
- Strong R (+25.6) · D 36.8% · R 62.5%
- 2008→2024 swing
- +17.0pp toward D · 2008: -42.7pp · 2024: -25.6pp
- All cycles
- 2024: R+25.6 2020: R+25.8 2016: R+37.7 2012: R+43.0 2008: R+42.7
Not yet ingested
- Civics
- —
Market trends
- HPI YoY
- ▼ -174.93%
- Current HPI
- 233.5167
- Rent YoY
- ▲ 1.12%
- Metro
- Augusta-Richmond County, GA-SC
- State GDP YoY
- ▲ 2.66%
- F500 in state
- 28
Industry mix (Fortune 500 HQ in GA)
| Industry | F500 HQs | Revenue |
|---|---|---|
| Paper / Packaging | 2 | $29B |
|
||
| Retail | 1 | $160B |
|
||
| Transportation / Logistics | 1 | $91B |
|
||
| Airlines | 1 | $62B |
|
||
| Consumer Goods | 1 | $47B |
|
||
| Utilities | 1 | $25B |
|
||
Price history
+198.0% since first listed50 events — show timeline
- 2026-06-16 Relisted — Hive MLS
- 2026-05-27 Contingent — Hive MLS
- 2026-05-13 Price Changed $192,000 Hive MLS
- 2026-05-11 Listing Removed — Hive MLS
- 2026-04-20 Price Changed $202,000 Hive MLS
- 2026-03-17 Price Changed $212,500 Hive MLS
- 2026-02-13 Price Changed $223,500 Hive MLS
- 2026-02-13 Price Changed $129,900 Hive MLS
- 2026-02-13 Price Changed $109,900 Hive MLS
- 2026-01-13 Listed $235,000 Hive MLS
- 2026-01-12 Listed $202,000 Hive MLS
- 2025-02-28 Listing Removed — Hive MLS
- 2025-02-28 Listing Removed — Hive MLS
- 2024-09-19 Listed $238,000 Hive MLS
- 2024-09-19 Listed $238,000 Hive MLS
- 2023-03-24 Sold (MLS) $129,900 Hive MLS
- 2023-02-23 Listed $299,000 Hive MLS
- 2022-12-07 Sold (Public Records) $229,900 Public Records
- 2022-12-05 Sold (MLS) $229,900 Hive MLS
- 2022-12-05 Sold (MLS) $229,900 Hive MLS
- 2022-08-04 Listed $229,900 Hive MLS
- 2022-08-04 Listed $229,900 Hive MLS
- 2021-04-29 Sold (MLS) $109,900 Hive MLS
- 2021-01-04 Listed $140,000 Hive MLS
- 2019-07-16 Sold (Public Records) $167,400 Public Records
- 2019-07-08 Sold (MLS) $167,400 Hive MLS
- 2019-07-08 Sold (MLS) $167,400 Hive MLS
- 2019-05-10 Listed $164,900 Hive MLS
- 2019-05-10 Listed $164,900 Hive MLS
- 2018-01-04 Sold (Public Records) $150,000 Public Records
- 2017-12-29 Sold (MLS) $150,000 Hive MLS
- 2017-12-29 Sold (MLS) $150,000 Hive MLS
- 2017-08-22 Listed $155,000 Hive MLS
- 2017-08-22 Listed $155,000 Hive MLS
- 2007-11-05 Sold (Public Records) $129,900 Public Records
- 2007-10-30 Sold (MLS) $129,900 Hive MLS
- 2007-10-30 Sold (MLS) $129,900 Hive MLS
- 2007-04-25 Listed $129,900 Hive MLS
- 2004-04-21 Sold (Public Records) $109,900 Public Records
- 2004-04-21 Sold (MLS) $109,900 Hive MLS
- 2004-04-21 Sold (MLS) $109,900 Hive MLS
- 2003-10-06 Listed $109,900 Hive MLS
- 2002-03-19 Listed $86,900 Hive MLS
- 2002-03-19 Listed $86,900 Hive MLS
- 1998-03-04 Sold (Public Records) $100,000 Public Records
- 1998-01-29 Sold (Public Records) $82,000 Public Records
- 1988-12-01 Sold (Public Records) $78,783 Public Records
- 1988-12-01 Sold (Public Records) $79,268 Public Records
- 1987-09-01 Sold (Public Records) $82,900 Public Records
- 1985-07-01 Sold (Public Records) $64,430 Public Records
Property tax history
-24.4%/yrLatest (2025): $60 · +0.0% YoY. Source: county tax records.
Cash-flow waterfall
monthlySold comps — $/sqft
last 12 mo · ≤1 miLoading sold comps…