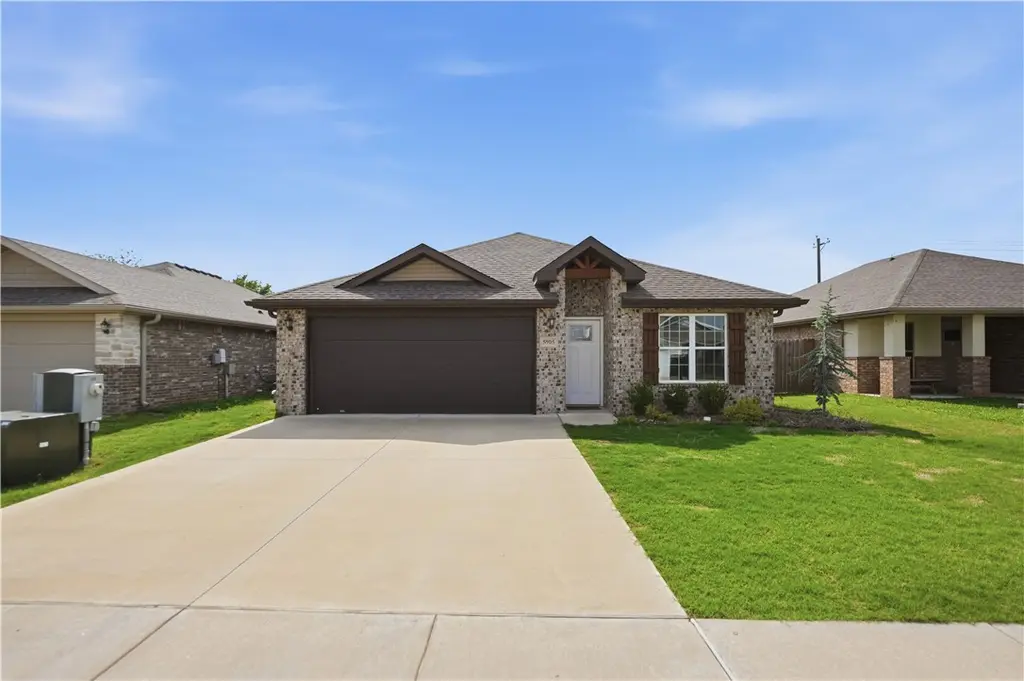
5905 NW Mcclellen St · Highfill, AR
Flood risk 6/10 · Moderate
- FEMA flood zone
- X (unshaded)
- Chance of flooding over 30 yrs
- 0.71%
- Est. flood insurance / yr
- $507 – $1,088
Fire risk 6/10 · Moderate
- Est. fire insurance / yr
- $1,499 – $2,785
Heat risk 5/10 · Moderate
- Hot days now (above 106°F)
- 7 days/yr
- Hot days in 30 yrs
- 20 days/yr
Wind risk 2/10 · Minimal
- Chance of severe wind over 30 yrs
- 3.0%
Air-quality risk 1/10 · Minimal
- Unhealthy air days now
- 0 days/yr
- Unhealthy air days in 30 yrs
- 0 days/yr
Risk factors via First Street. Map © Google.
Why this score? — see what drove the D grade
The composite is a weighted blend of 9 inputs, each scored 0–100. Each bar is that input's sub-score; the figure is the points it added to the 100-point composite (weight × sub-score).
- Appreciation +10.0/10.0
- ARV discount +7.3/15.0
- Cash flow +6.9/30.0
- Schools +5.2/10.0
- Livability +3.4/5.0
- Rent growth +2.6/5.0
- Condition / age +2.5/5.0
- 1% rule +1.3/10.0
- DSCR +1.1/10.0
$280,000
🖨 Deal sheet (PDF) 📄 Offer letter ✓ Due diligence
Listing remarks MLS
Check out this fully bricked 4 Bedroom 2 Bath home just listed. Perfect investment property or first time home buyer property. Open living and kitchen area with spacious dining room. Kitchen has granite countertops, gas cooktop stove, beautiful dark wood cabinetry, double stainless steel sink. Master has a walk in closet, and the bathroom has granite countertops with a double vanity. Secluded 4th bedroom could be perfect for an office or playroom. Fully fenced back yard with a covered patio. This one checks all the boxes!
Key facts
- 5,662 sq ft lot
- Garage
- Built 2019
Property features AI
Finance
- HOA & community: Annual association fee of $200; Community near schools and park
Exterior
- Parking: Attached garage with garage door opener; 2 covered parking spaces
- Security: Smoke detector(s)
- Utilities: Electricity available; Natural gas available; Public water; Public sewer
- Home design: Single-story; Brick construction; Architectural shingle roof; Entry on slab foundation; Residential zoning; Public road frontage; Paved road
- Construction: Brick exterior; Built with slab foundation; Architectural shingle roof
- Exterior features: Concrete driveway; Covered patio
Interior
- Kitchen: Dishwasher; Electric cooktop; Electric range; Disposal; Microwave; Plumbed for ice maker; Granite counters; Pantry
- Flooring: Carpet; Tile
- Bathrooms: 2 full bathrooms
- Heating & cooling: Central heating; Heat pump cooling; Electric cooling
- Interior features: Attic; Ceiling fan(s); Granite counters; Pantry; Storage; Walk-in closet(s)
- Laundry & utility: Washer hookup; Dryer hookup; Electric water heater
Neighborhood map
What this means for you Summary
Snapshot
- This is a 4-bed/2.0-bath single-family listed at $280k.
Deal economics
- At list price, monthly cash flow is $-423 ($-5k/yr) — negative.
- To cash-flow at today's rent, offer at most $205k (26.7% below list).
- To meet the 1% rule (rent ≥ 1% of price), the offer needs to be $175k (37.3% below list).
- Recommended offer: $175k (37.3% below list) — sets the bar for 1% rule.
- Cap rate 4.5% vs local median 2.9% in Highfill — top-decile yield for the area; either an underpriced asset or a hidden risk that comps aren't pricing in. Stress-test before assuming the spread holds.
Location & tenants
- Location reads 67/100 on livability (#97 in AR) — a middle-class / working-renter tenant base. Strengths: crime A+, employment A+, cost of living A+; Watch: schools F, amenities F, commute F.
- Bentonville School District (urban): math 59% / reading 59% proficiency, ranked #3 of 238 in AR (top 1%) — acceptable for families but not a draw, mixed tenant base, ~2y average lease.
- Market conditions: Rents flat; 710 active listings in the ZIP; 37 comparable units currently listed for rent nearby; rentals at typical pace (median 23d on market — plan ~3-4 weeks tenant-placement turnaround); high-income renter base; 4,359 units permitted in Benton County in 2024 (402 in 5+ unit buildings).
- This rent is only 18% of the median local income ($120k/yr) — well below the 30% rent-burden line; pricing power to push rent on renewal without tenant pushback.
Forward outlook
- In year one you build about $30k of equity ($2k loan paydown + $28k appreciation (10.0% local appreciation)).
- Benton County population projected at +56% by 2050 — long-run rental-demand tailwind backs the buy-and-hold thesis.
- By year 2, paydown + projected appreciation supports a ~$48k cash-out refi (75% LTV) — recoverable capital for the next deal without selling this one.
Negotiation context
- It's been on market 37 days — a 3% lower offer ($272k) is reasonable based on typical stale-listing flexibility.
- 4 sale attempts since 7y ago with the ask held roughly flat each time — persistent listings suggest the price (not the market) is what's stuck; bring a comps-based counter.
Risks & watch-outs
- Climate carrying-cost: major flood risk; major wildfire risk; extreme-heat days projected 7→20/yr by 2055 (HVAC capex compounding) — expect insurance premiums to compound above CPI over the hold.
Questions for the listing agent
- What do current leases actually rent for vs. the listed asking? Can we see a recent rent roll and the last 12 months of T-12 income?
- It's been on market 37 days. Have you received any prior offers? Is the seller open to a 37% concession, seller financing, or rate buy-down credit?
- What does the HOA fee cover, when was the last increase, and are there any pending special assessments or reserve-fund shortfalls?
- Is there a deadline driving the sale (1031 exchange, divorce, estate, relocation)? That informs how much negotiation room exists.
- Schools are F-rated, which usually means shorter tenancies and higher turnover. Who's the typical renter profile here, and what's been the actual vacancy rate?
- The area grade is low — what's the realistic commute time and amenity access for the typical tenant pool here? Any planned neighborhood developments (good or bad) we should know about?
- What's the average days-on-market for RENTAL listings here right now (not sales)? A rising rental-DOM trend means longer vacancies and softer asking-rent achievability than the comps imply.
- What's the recent tenant-quality profile in this submarket — average credit score on applications, eviction rate, late-payment / NSF rate, and stable-employment percentage? A property-management company in the area should have these aggregated.
- How much new for-sale + rental construction is in the pipeline within 1–3 miles? Heavy new supply typically softens prices + rents 12–24 months out; constrained supply supports both.
Investment metrics
- 1% rule
- 0.63% ✗
- Cap rate
- 4.48%
- Cash-on-cash
- -6.47%
- DSCR
- 0.71
- GRM
- 13.3
CMA / ARV
- ARV (on-the-fly)
- $278,499
- Comps found
- 12
Show comp detail 12 sales within ~0.75 mi
| Address | Dist | Beds/Ba | Sqft | Sold | Price | $/sf | Match |
|---|---|---|---|---|---|---|---|
| 6009 NW Hancock St | 0.18mi | 4/2.0 | 1,433 (-1%) | 2mo | $285,000 | $199 | 88 |
| 709 NW 64th Ave | 0.27mi | 3/2.0 (-1) | 1,467 (+2%) | 2mo | $277,000 | $189 | 78 |
| 6002 NW Sherman St | 0.10mi | 3/2.0 (-1) | 1,550 (+7%) | 4mo | $300,000 | $194 | 74 |
| 729 NW 64th Ave | 0.29mi | 3/2.0 (-1) | 1,525 (+6%) | 2mo | $304,000 | $199 | 70 |
| 812 NW 64th Ave | 0.34mi | 3/2.0 (-1) | 1,522 (+6%) | 4mo | $285,000 | $187 | 66 |
| 717 NW 69th Ave | 0.52mi | 4/2.0 | 1,514 (+5%) | 3mo | $292,000 | $193 | 65 |
| 6100 NW Mcclellen St | 0.10mi | 3/2.0 (-1) | 1,650 (+14%) | 3mo | $299,500 | $182 | 64 |
| 716 NW 71st Ave | 0.65mi | 3/2.0 (-1) | 1,433 (-1%) | 4mo | $250,000 | $174 | 60 |
| 808 63rd Ave | 0.29mi | 3/2.0 (-1) | 1,610 (+12%) | 4mo | $300,500 | $187 | 58 |
| 817 NW 67th Ave | 0.46mi | 3/2.0 (-1) | 1,311 (-9%) | 1mo | $255,000 | $195 | 57 |
| 813 NW Evans Cir | 0.39mi | 3/2.0 (-1) | 1,243 (-14%) | 3mo | $260,000 | $209 | 52 |
| 6002 Hoover St | 0.36mi | 3/2.0 (-1) | 1,655 (+15%) | 3mo | $318,000 | $192 | 51 |
Match score weights: distance 35% · size 25% · config 20% · recency 20%. Top-matched comps best support the ARV.
Projected returns pro-forma
10.0% appreciation · 0.39% rent growth · sell at horizon
- IRR
- 19.1%
- Equity multiple
- 2.54×
- Total profit
- $121,037
- Equity at exit
- $252,246
- IRR
- 17.2%
- Equity multiple
- 5.71×
- Total profit
- $369,327
- Equity at exit
- $543,978
Cash invested: $78,400 (down + closing). Projections, not guarantees.
Landlord ↔ Tenant lean methodology
- Overall (STATE)
- 92 Strongly Landlord-Friendly
- State Arkansas
- 92 Strongly Landlord-Friendly · R+14
- County
- — inherits STATE
- City
- — inherits STATE
ZIP-level market 72713
- Home prices YoY
- 3.5%
- Rents YoY
- 0.4%
- Active inventory
- 710
- Price-to-rent
- 13.3×
Monthly cashflow live
- Estimated rent
- $1,754 high interval (Pro) →
- Mortgage (P&I)
- −$1,468
- Tax from tax record
- −$206 /mo · $2,477/yr
- Insurance
- −$117
- HOA
- −$17
- Vacancy / Maint / Mgmt
- −$368
- Net cashflow
- $-423
Break-even live
Sensitivity live
| Price | -10% $-264 | -5% $-343 | +0% $-423 | +5% $-502 | +10% $-581 |
|---|---|---|---|---|---|
| Rent | -10% $-561 | -5% $-492 | +0% $-423 | +5% $-353 | +10% $-284 |
| Rate | -1.0pp $-282 | -0.5pp $-351 | base $-423 | +0.5pp $-495 | +1.0pp $-569 |
UW: 25.0% down · 7.5% · 30yr · 1.5% tax · 5.0% vac · 8.0% maint · 8.0% mgmt
Financing live
Cash to close
- Down payment
- $70,000
- Closing costs
- $8,400
- Reserves months
- —
- Total cash needed
- —
Loan-product check · same deal, 3 products live
Conventional
25% down · 7.5% · 30yr
- Down + closing
- —
- Monthly P&I
- —
- Monthly cashflow
- —
- DSCR
- —
- Eligible?
- —
Personal DTI + credit; lowest rate.
DSCR
20% down · 8.5% · 30yr
- Down + closing
- —
- Monthly P&I
- —
- Monthly cashflow
- —
- DSCR
- —
- Eligible?
- —
No personal income docs; deal must DSCR.
Hard money
10% down · 12.0% · 12mo
- Down + closing
- —
- Monthly P&I
- —
- Monthly cashflow
- —
- DSCR
- —
- Eligible?
- —
Short-term bridge; refi at stabilization.
Rent comps 37 comps
| Address | Beds | Baths | Sqft | Rent | $/sqft | DOM | Units | Dist |
|---|---|---|---|---|---|---|---|---|
| 6103 NW McClellen St Bentonville, AR | 4.0 | 2.0 | 1433 | $1,795 | $1.25 | 25d | 1 | 0.09mi |
| 6002 NW Meade St Bentonville, AR | 3.0 | 2.0 | 1860 | $1,825 | $0.98 | 25d | 1 | 0.17mi |
| 6005 NW Hoover St Bentonville, AR | 4.0 | 2.0 | 1433 | $1,595 | $1.11 | 16d | 1 | 0.36mi |
| 864 NW Evans Cir Bentonville, AR | 4.0 | 2.0 | 1497 | $1,650 | $1.10 | 25d | 1 | 0.39mi |
| 424 NW 59 Ave Bentonville, AR | 3.0 | 2.0 | 1782 | $2,150 | $1.21 | 15d | 1 | 0.39mi |
| 817 NW 67th Ave Bentonville, AR | 3.0 | 2.0 | 1311 | $1,595 | $1.22 | 25d | 1 | 0.43mi |
| 523 NW 68th Ave Bentonville, AR | 3.0 | 2.0 | 1300 | $1,495 | $1.15 | 16d | 1 | 0.46mi |
| 511 NW 68th Ave Bentonville, AR | 3.0 | 2.0 | 1300 | $1,495 | $1.15 | 23d | 1 | 0.48mi |
| 6807 NW Toby St Bentonville, AR | 3.0 | 2.0 | 1300 | $1,495 | $1.15 | 16d | 1 | 0.48mi |
| 6813 NW Toby St Bentonville, AR | 3.0 | 2.0 | 1300 | $1,495 | $1.15 | 16d | 1 | 0.50mi |
| 500 NW 69th Ave Unit 6810 Bentonville, AR | 3.0 | 2.0 | 1300 | $1,450 | $1.12 | 25d | 1 | 0.50mi |
| 500 NW 69th Ave Unit 6812 Bentonville, AR | 3.0 | 2.0 | 1300 | $1,495 | $1.15 | 23d | 1 | 0.50mi |
| 613 NW 69th Ave Bentonville, AR | 3.0 | 2.0 | 1300 | $1,495 | $1.15 | 16d | 1 | 0.51mi |
| 617 NW 69th Ave Bentonville, AR | 3.0 | 2.0 | 1300 | $1,450 | $1.12 | 25d | 1 | 0.52mi |
| 615 NW 69th Ave Highfill, AR | 3.0 | 2.0 | 1300 | $1,450 | $1.12 | 25d | 1 | 0.52mi |
| 535 NW 69th Ave Bentonville, AR | 3.0 | 2.0 | 1300 | $1,495 | $1.15 | 23d | 1 | 0.52mi |
| 514 NW 69th Ave Bentonville, AR | 3.0 | 2.0 | 1300 | $1,395 | $1.07 | 25d | 1 | 0.53mi |
| 525 NW 69th Ave Bentonville, AR | 3.0 | 2.0 | 1300 | $1,495 | $1.15 | 16d | 1 | 0.53mi |
| 521 NW 69th Ave Bentonville, AR | 3.0 | 2.0 | 1300 | $1,450 | $1.12 | 25d | 1 | 0.54mi |
| 632 NW 69th Ave Bentonville, AR | 3.0 | 2.0 | 1300 | $1,395 | $1.07 | 25d | 1 | 0.54mi |
| 523 NW 69th Ave Highfill, AR | 3.0 | 2.0 | 1300 | $1,495 | $1.15 | 16d | 1 | 0.54mi |
| 6810 NW Trevy St Bentonville, AR | 3.0 | 2.0 | 1300 | $1,495 | $1.15 | 16d | 1 | 0.56mi |
| 500 NW 69th Ave Bentonville, AR | 3.0 | 2.0 | 1300 | $1,445 | $1.11 | 15d | 8 | 0.60mi |
| 500 NW 69th Ave Bentonville, AR | 3.0 | 2.0 | 1300 | $1,395 | $1.07 | 23d | 1 | 0.60mi |
| 313 NW 65th Ave Bentonville, AR | 3.0 | 2.0 | 1250 | $1,450 | $1.16 | 25d | 1 | 0.62mi |
| 6603 NW Altus St Bentonville, AR | 3.0 | 2.0 | 1251 | $1,495 | $1.20 | 25d | 1 | 0.64mi |
| 6607 NW Altus St Bentonville, AR | 3.0 | 2.0 | 1256 | $1,450 | $1.15 | 25d | 1 | 0.65mi |
| 6600 NW Altus St Highfill, AR | 4.0 | 2.0 | 1454 | $1,595 | $1.10 | 16d | 1 | 0.67mi |
| 6619 NW Altus St Bentonville, AR | 3.0 | 2.0 | 1256 | $1,495 | $1.19 | 25d | 1 | 0.68mi |
| 6605 NW Vandergriff St Bentonville, AR | 4.0 | 2.0 | 1454 | $1,595 | $1.10 | 16d | 1 | 0.70mi |
| 6608 NW Vandergriff St Highfill, AR | 4.0 | 2.0 | 1454 | $1,595 | $1.10 | 16d | 1 | 0.73mi |
| 111 NW 63rd Ave Bentonville, AR | 2.0–4.0 | 2.0 | 1116 | $1,725 | $1.55 | 15d | 19 | 0.80mi |
| 210 NW 67th Ave Bentonville, AR | 4.0 | 2.0 | 1454 | $1,595 | $1.10 | 16d | 1 | 0.81mi |
| 6307 NW Kathleen St Bentonville, AR | 3.0 | 2.0 | 1256 | $1,495 | $1.19 | 25d | 1 | 0.82mi |
| 6503 NW Kathleen St Bentonville, AR | 3.0 | 2.0 | 1256 | $1,495 | $1.19 | 25d | 1 | 0.83mi |
| 6500 NW Kathleen St Bentonville, AR | 3.0 | 2.0 | 1250 | $1,450 | $1.16 | 25d | 1 | 0.85mi |
| 6502 NW Kathleen St Bentonville, AR | 3.0 | 2.0 | 1250 | $1,495 | $1.20 | 25d | 1 | 0.86mi |
HOA detail
- Monthly dues
- $17 · $204/yr
- Likely covers
- gas
Listing history 17 events
-
2026-06-22statusdays on market $280,000 Pending 37 DOM
-
2026-06-18days on market $280,000 Active 36 DOM
-
2026-06-17days on market $280,000 Active 35 DOM
-
2026-06-16days on market $280,000 Active 34 DOM
-
2026-06-15days on market $280,000 Active 33 DOM
-
2026-06-14days on market $280,000 Active 31 DOM
-
2026-06-10days on market $280,000 Active 28 DOM
-
2026-06-09days on market $280,000 Active 27 DOM
-
2026-06-08days on market $280,000 Active 26 DOM
-
2026-06-07days on market $280,000 Active 25 DOM
-
2026-06-05days on market $280,000 Active 22 DOM
-
2026-06-03days on market $280,000 Active 21 DOM
-
2026-06-02days on market $280,000 Active 20 DOM
-
2026-06-01days on market $280,000 Active 19 DOM
-
2026-05-31days on market $280,000 Active 18 DOM
-
2026-05-31remarks 323-char remark
-
2026-05-31$280,000 Active 17 DOM
ⓘ Source: listings_history table (triggers on properties + properties_extension) + one-shot
backfill from property_details.listing_events for pre-trigger history.
Tax reassessment forecast AR · Resets to sale price
- Current annual tax
- $2,477 · $206/mo
- Projected year-2 tax
- $2,477 · $206/mo
- Expected delta
- $0/yr ($0/mo · 0.0%)
ⓘ Screening estimate from a state-policy table — verify with the county assessor before closing.
Climate risk First Street
- Flood 6/10 Major FEMA zone X (unshaded) · 71% chance over 30 yrs
- Wildfire 6/10 Major
- Heat 5/10 Major 7 d/yr ≥106°F today · 20 d/yr by 30 yrs out
- Wind 2/10 Low 3% chance of damaging wind over 30 yrs
- Air quality 1/10 Low 0 unhealthy d/yr today · 0 by 30 yrs out
Nearby sold comps map
Loading sold comps map…
Walkable amenities ~0.75 mi
Loading nearby amenities…
Taxation est. · year 1
- Rental income
- $21,051
- − Mortgage interest
- −$15,684
- − Property taxes
- −$2,477
- − Insurance
- −$1,400
- − Repairs & maintenance
- −$1,684
- − Management
- −$1,684
- − HOA
- −$204
- − Depreciation
- −$8,145
- Taxable loss
- −$10,228
- Est. tax savings @ 24.0%
- +$2,455
- After-tax cash flow
- $-2,617/yr
For passive investors: Depreciation is non-cash, so a rental often shows a tax loss while cash-flowing — sheltering income. Rental losses are passive: they offset passive income freely, and up to $25,000/yr can offset ordinary (W-2) income if you actively participate and your MAGI is under $100k (phasing out to $0 by $150k); unused losses carry forward. On sale, claimed depreciation is recaptured at up to 25%, and gains may owe capital-gains tax (a 1031 exchange can defer both). Figures are a year-1 estimate at your 24.0% rate — not tax advice; consult a CPA.
Schools (NCES district)
- District
- Bentonville School District
- NCES district ID
- 0503060
- Math proficiency
- 59% ▼ -8.00%
- Reading proficiency
- 59% ▼ -6.00%
- Median HH income
- $66,721
- Composite
- 51.85/100
- National rank
- #1661
- State rank
- #3 of 238 in AR
Livability — Highfill
- Score
- 67/100
- State rank
- #97
- US rank
- #10302
Category grades
Schools grade is shown separately in the Schools card above.
Census & demographics
- Census place
- Highfill, AR
- County
- Benton County · 259,241 people
- Metro
- Fayetteville-Springdale-Rogers, AR
- Population (ZIP)
- 28,999
- Household income
- $119,853
- Rent vs Own
- Severe rent burden
- 508.0
Population outlook (Benton County) Hauer SSP2
- Today (2025)
- 318,683 people
- By 2030
- 353,481 · +10.9%
- By 2040
- 425,280 · +33.4%
- By 2050
- 497,239 · +56.0%
- By 2075
- 662,114 · +107.8%
- By 2100
- 776,431 · +143.6%
Race, ethnicity, and origin ACS 2023
- Neighborhood character
- Diverse neighborhood (Simpson 0.66)
- Race & ethnicity
- White 54% Asian 20% Two or more races 16% Hispanic / Latino 11% Black 3%
- Hispanic origin (detail)
- Mexican 8%
- Common ancestry
- Italian 2% Slovak 2% Romanian 1%
- Foreign-born
- 22% · Canada, China, Vietnam
- Languages at home
- 79% English-only · Other Asian/Pacific 8% Spanish 6% Other Indo-European 5%
Political lean MEDSL · Benton
- 2024 margin
- Strong R (+27.0) · D 35.2% · R 62.1% · Other 2.7%
- 2008→2024 swing
- +9.6pp toward D · 2008: -36.5pp · 2024: -27.0pp
- All cycles
- 2024: R+27.0 2020: R+26.4 2016: R+34.9 2012: R+40.4 2008: R+36.5
Not yet ingested
- Civics
- —
Market trends
- HPI YoY
- ▲ 10.77%
- Current HPI
- 319.3081
- Rent YoY
- ▲ 0.39%
- Metro
- Fayetteville-Springdale-Rogers, AR
- State GDP YoY
- ▲ 3.80%
- F500 in state
- 10
Industry mix (Fortune 500 HQ in AR)
| Industry | F500 HQs | Revenue |
|---|---|---|
| Retail | 1 | $681B |
|
||
| Food / Agriculture | 1 | $53B |
|
||
| Retail / Energy | 1 | $22B |
|
||
| Transportation / Logistics | 1 | $12B |
|
||
| Energy | 1 | $4B |
|
||
Price history
+67.1% since first listed10 events — show timeline
- 2026-05-30 Relisted — NWARMLS
- 2026-05-16 Delisted — NWARMLS
- 2026-04-28 Listed $280,000 NWARMLS
- 2026-02-09 Price Changed $275,000 NWARMLS
- 2022-09-23 Sold (Public Records) $265,000 Public Records
- 2022-09-22 Sold (MLS) $265,000 NWARMLS
- 2022-08-22 Pending — NWARMLS
- 2022-08-19 Listed $265,000 NWARMLS
- 2020-01-03 Sold (MLS) $173,087 NWARMLS
- 2019-09-26 Listed $167,587 NWARMLS
Property tax history
+6.4%/yrLatest (2025): $2,477 · +10.5% YoY. Source: county tax records.
Cash-flow waterfall
monthlySold comps — $/sqft
last 12 mo · ≤1 miLoading sold comps…