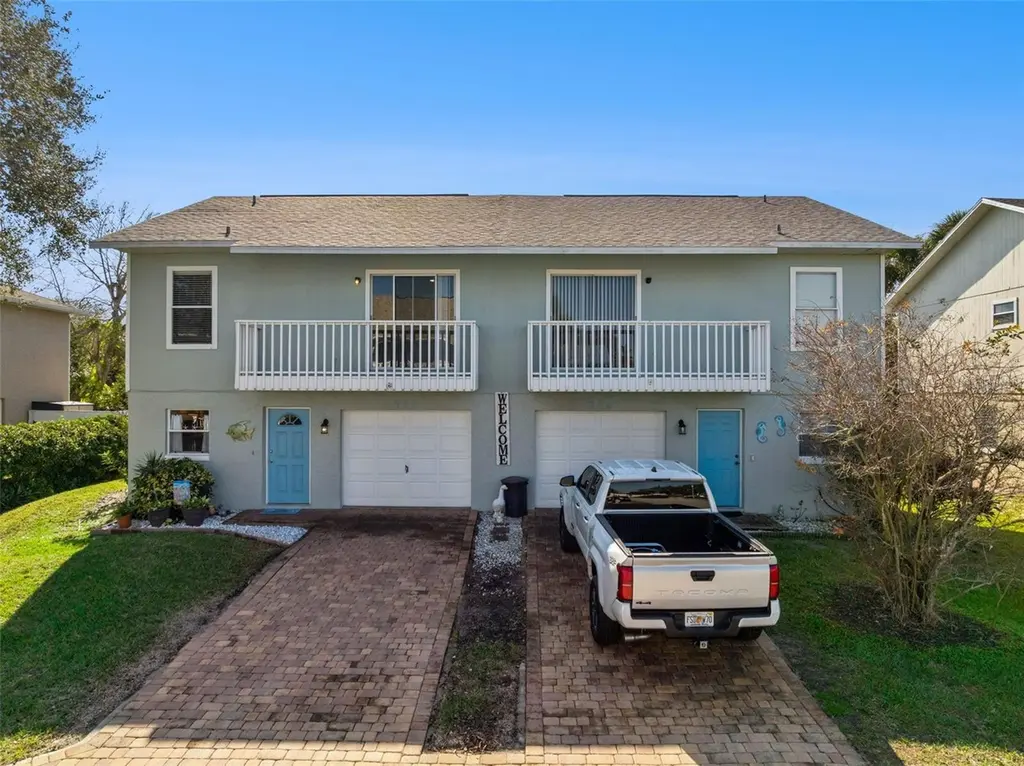
721 Laurel Bay Cir · New Smyrna Beach, FL
Flood risk 9/10 · Severe
- FEMA flood zone
- X (shaded)
- Chance of flooding over 30 yrs
- 0.99%
- Est. flood insurance / yr
- $507 – $1,088
Fire risk 4/10 · Minor
- Est. fire insurance / yr
- $947 – $1,759
Heat risk 9/10 · Severe
- Hot days now (above 105°F)
- 7 days/yr
- Hot days in 30 yrs
- 20 days/yr
Wind risk 10/10 · Severe
- Chance of severe wind over 30 yrs
- 99.0%
Air-quality risk 2/10 · Minimal
- Unhealthy air days now
- 1 days/yr
- Unhealthy air days in 30 yrs
- 1 days/yr
Risk factors via First Street. Map © Google.
Why this score? — see what drove the D- grade
The composite is a weighted blend of 9 inputs, each scored 0–100. Each bar is that input's sub-score; the figure is the points it added to the 100-point composite (weight × sub-score).
- Cash flow +10.1/30.0
- ARV discount +7.5/15.0
- Schools +3.9/10.0
- Rent growth +3.8/5.0
- Livability +3.5/5.0
- DSCR +2.9/10.0
- 1% rule +2.6/10.0
- Condition / age +2.5/5.0
- Appreciation +0.0/10.0
$345,000
🖨 Deal sheet 📄 Offer letter ✓ Due diligence
Listing remarks MLS
Welcome Home to 721 Laurel Bay St! Just two blocks from the Atlantic Ocean and The Beach, this beautifully maintained, move-in-ready end unit townhome offers the perfect blend of coastal living and everyday convenience. Enjoy easy walking access to the scenic Indian River Preserve Park and come home to a peaceful, park-like setting ideal for a primary residence or a relaxing vacation getaway. This home has been thoughtfully updated for peace of mind, including a new roof (2021), HVAC system (2024), hot water heater (2017), and fresh interior paint. The chef in the family will appreciate the spacious, well-lit kitchen featuring stainless steel appliances, ample counter space, and a breakfast bar that opens seamlessly to the family room. Upstairs, you’ll find three generously sized bedrooms. The primary suite offers an ensuite bath and a private balcony—perfect for morning coffee or evening breezes. The second bedroom also features its own private balcony, adding even more charm and outdoor enjoyment. Homes this close to the ocean and packed with updates don’t come along often. Schedule your private showing today—this one will not last.
Key facts
- Updated hvac system
- Walking access
- Park-like setting
Tags
Neighborhood map
What this means for you Summary
Snapshot
- This is a 3-bed/2.5-bath single-family listed at $345k.
Deal economics
- At list price, monthly cash flow is $-266 ($-3k/yr) — negative.
- To cash-flow at today's rent, offer at most $298k (13.6% below list).
- To meet the 1% rule (rent ≥ 1% of price), the offer needs to be $263k (23.9% below list).
- Recommended offer: $263k (23.9% below list) — sets the bar for 1% rule.
Location & tenants
- Location reads 69/100 on livability (#474 in FL) — a middle-class / working-renter tenant base. Strengths: crime A+, housing A+, employment B; Watch: amenities F, commute F, health & safety D-.
- Volusia (suburban): math 44% / reading 49% proficiency, ranked #47 of 73 in FL (top 64%) — families likely to look elsewhere, expect single-tenant / working-renter base with shorter leases.
- Market conditions: Rents rising fast (+5.2%/yr); 539 active listings in the ZIP; 8 comparable units currently listed for rent nearby; rentals at typical pace (median 23d on market — plan ~3-4 weeks tenant-placement turnaround); high-income renter base; 3,402 units permitted in Volusia County in 2024 (681 in 5+ unit buildings).
Forward outlook
- Local home prices are declining (-3.0%/yr); year-one equity from $2k of loan paydown is wiped out by about $10k of value loss. Plan a longer hold.
- Volusia County population projected at +19% by 2050 — long-run rental-demand tailwind backs the buy-and-hold thesis.
Negotiation context
- It's been on market 142 days — a 12% lower offer ($304k) is reasonable based on typical stale-listing flexibility.
- 10 sale attempts since 26y ago with the ask held roughly flat each time — persistent listings suggest the price (not the market) is what's stuck; bring a comps-based counter.
- Current owner paid $175k; list at $345k implies a 97% gain — meaningful room to come down on a strong offer.
Risks & watch-outs
- Watch-outs: flood insurance adds $66/mo.
- Climate carrying-cost: severe flood risk; severe wind risk, 99% chance of damaging wind over 30y; extreme-heat days projected 7→20/yr by 2055 (HVAC capex compounding) — expect insurance premiums to compound above CPI over the hold.
Questions for the listing agent
- What do current leases actually rent for vs. the listed asking? Can we see a recent rent roll and the last 12 months of T-12 income?
- It's been on market 142 days. Have you received any prior offers? Is the seller open to a 24% concession, seller financing, or rate buy-down credit?
- What's the actual annual flood-insurance premium (NFIP or private), and is the property in a SFHA with mandatory coverage?
- What does the HOA fee cover, when was the last increase, and are there any pending special assessments or reserve-fund shortfalls?
- Why hasn't it sold? Are there any deal-killer items the seller is aware of (foundation, flood, title, zoning, code violations)?
- Is there a deadline driving the sale (1031 exchange, divorce, estate, relocation)? That informs how much negotiation room exists.
- Schools are B-rated — typically a magnet for longer-tenancy family renters. What's the average tenant stay here, and is there a school-zone premium baked into asking?
- The area grade is low — what's the realistic commute time and amenity access for the typical tenant pool here? Any planned neighborhood developments (good or bad) we should know about?
- What's the average days-on-market for RENTAL listings here right now (not sales)? A rising rental-DOM trend means longer vacancies and softer asking-rent achievability than the comps imply.
- What's the recent tenant-quality profile in this submarket — average credit score on applications, eviction rate, late-payment / NSF rate, and stable-employment percentage? A property-management company in the area should have these aggregated.
- How much new for-sale + rental construction is in the pipeline within 1–3 miles? Heavy new supply typically softens prices + rents 12–24 months out; constrained supply supports both.
Investment metrics
- 1% rule
- 0.76% ✗
- Cap rate
- 5.60%
- Cash-on-cash
- -2.47%
- DSCR
- 0.89
- GRM
- 10.9
CMA / ARV
No comps found within radius.
Projected returns pro-forma
-3.0% appreciation · 5.17% rent growth · sell at horizon
- IRR
- -19.5%
- Equity multiple
- 0.31×
- Total profit
- $-66,948
- Equity at exit
- $51,441
- IRR
- -8.3%
- Equity multiple
- 0.43×
- Total profit
- $-54,895
- Equity at exit
- $29,829
Cash invested: $96,600 (down + closing). Projections, not guarantees.
Landlord ↔ Tenant lean methodology
- Overall (STATE)
- 87 Strongly Landlord-Friendly
- State Florida
- 87 Strongly Landlord-Friendly · R+3
- County
- — inherits STATE
- City
- — inherits STATE
ZIP-level market 32169
- Rents YoY
- 5.2%
- Active inventory
- 539
- Price-to-rent
- 10.9×
Monthly cashflow live
- Estimated rent
- $2,626 high interval (Pro) →
- Mortgage (P&I)
- −$1,809
- Tax from tax record
- −$181 /mo · $2,171/yr
- Insurance
- −$144
- Flood insurance flood zone
- −$66 /mo · $798/yr
- HOA
- −$140
- Vacancy / Maint / Mgmt
- −$552
- Net cashflow
- $-266
Break-even live
UW: 25.0% down · 7.5% · 30yr · 1.5% tax · 5.0% vac · 8.0% maint · 8.0% mgmt
Financing live
Cash to close
- Down payment
- $86,250
- Closing costs
- $10,350
- Reserves months
- —
- Total cash needed
- —
Loan-product check · same deal, 3 products live
Conventional
25% down · 7.5% · 30yr
- Down + closing
- —
- Monthly P&I
- —
- Monthly cashflow
- —
- DSCR
- —
- Eligible?
- —
Personal DTI + credit; lowest rate.
DSCR
20% down · 8.5% · 30yr
- Down + closing
- —
- Monthly P&I
- —
- Monthly cashflow
- —
- DSCR
- —
- Eligible?
- —
No personal income docs; deal must DSCR.
Hard money
10% down · 12.0% · 12mo
- Down + closing
- —
- Monthly P&I
- —
- Monthly cashflow
- —
- DSCR
- —
- Eligible?
- —
Short-term bridge; refi at stabilization.
Rent comps 8 comps
| Address | Beds | Baths | Sqft | Rent | $/sqft | DOM | Units | Dist |
|---|---|---|---|---|---|---|---|---|
| 3800 Saxon Dr New Smyrna Beach, FL | 2.0 | 1.5 | 838 | $2,100 | $2.51 | 23d | 1 | 0.05mi |
| 3800 Saxon Dr Unit 1545928P New Smyrna Beach, FL | 2.0 | 1.0 | 893 | $2,185 | $2.45 | 14d | 1 | 0.05mi |
| 3307 Saxon Dr New Smyrna Beach, FL | 2.0 | 1.0 | 854 | $1,975 | $2.31 | 23d | 1 | 0.34mi |
| 834 E 25th Ave New Smyrna Beach, FL | 2.0 | 2.0 | 1007 | $2,600 | $2.58 | 14d | 1 | 0.42mi |
| 3801 S Atlantic Ave Unit 107 New Smyrna Beach, FL | 2.0 | 2.0 | 912 | $6,000 | $6.58 | 23d | 1 | 0.43mi |
| 4175 S Atlantic Ave #3160 New Smyrna Beach, FL | 2.0 | 1.0 | 788 | $3,000 | $3.81 | 23d | 1 | 0.61mi |
| 906 11th Ave New Smyrna Beach, FL | 2.0 | 2.0 | 1000 | $3,500 | $3.50 | 23d | 1 | 1.25mi |
| 814 E 10th Ave New Smyrna Beach, FL | 2.0 | 1.0 | 970 | $2,600 | $2.68 | 23d | 1 | 1.28mi |
HOA detail
- Monthly dues
- $140 · $1,680/yr
- Likely covers
- water
Listing history 33 events
-
2026-05-31statusdays on market $345,000 Pending 142 DOM
-
2026-03-17price $345,000 1177-char remark
Show marketing remark (1177 chars)
Welcome Home to 721 Laurel Bay St! Just two blocks from the Atlantic Ocean and The Beach, this beautifully maintained, move-in-ready end unit townhome offers the perfect blend of coastal living and everyday convenience. Enjoy easy walking access to the scenic Indian River Preserve Park and come home to a peaceful, park-like setting ideal for a primary residence or a relaxing vacation getaway. This home has been thoughtfully updated for peace of mind, including a new roof (2021), HVAC system (2024), hot water heater (2017), and fresh interior paint. The chef in the family will appreciate the spacious, well-lit kitchen featuring stainless steel appliances, ample counter space, and a breakfast bar that opens seamlessly to the family room. Upstairs, you’ll find three generously sized bedrooms. The primary suite offers an ensuite bath and a private balcony—perfect for morning coffee or evening breezes. The second bedroom also features its own private balcony, adding even more charm and outdoor enjoyment. Homes this close to the ocean and packed with updates don’t come along often. Schedule your private showing today—this one will not last.
-
2026-01-08$350,000 Active 1177-char remark
Show marketing remark (1177 chars)
Welcome Home to 721 Laurel Bay St! Just two blocks from the Atlantic Ocean and The Beach, this beautifully maintained, move-in-ready end unit townhome offers the perfect blend of coastal living and everyday convenience. Enjoy easy walking access to the scenic Indian River Preserve Park and come home to a peaceful, park-like setting ideal for a primary residence or a relaxing vacation getaway. This home has been thoughtfully updated for peace of mind, including a new roof (2021), HVAC system (2024), hot water heater (2017), and fresh interior paint. The chef in the family will appreciate the spacious, well-lit kitchen featuring stainless steel appliances, ample counter space, and a breakfast bar that opens seamlessly to the family room. Upstairs, you’ll find three generously sized bedrooms. The primary suite offers an ensuite bath and a private balcony—perfect for morning coffee or evening breezes. The second bedroom also features its own private balcony, adding even more charm and outdoor enjoyment. Homes this close to the ocean and packed with updates don’t come along often. Schedule your private showing today—this one will not last.
-
2025-09-28historical
-
2025-09-03price $374,999
-
2025-09-03price $374,999
-
2025-07-24price $375,999
-
2025-07-23price $375,999
-
2025-06-19price $379,999
-
2025-06-19price $379,999
-
2025-06-02$385,000 Active
-
2025-05-02price $385,000
-
2025-04-17status Active
-
2025-04-14historical
-
2025-04-14status Pending
-
2025-03-28$387,000 Active
-
2017-08-18soldstatus $174,950
-
2017-08-17soldstatus $174,950 Closed
-
2017-08-17soldstatus $174,950
-
2017-06-22historical Contingent
-
2017-06-14$179,900 Active
-
2017-06-13$179,900
-
2003-10-03soldstatus $125,000
-
2003-09-30soldstatus $125,000
-
2003-09-30soldstatus $125,000
-
2003-08-20$129,900
-
2003-08-20$129,900
-
2000-11-20soldstatus $77,500
-
2000-11-20soldstatus $77,500
-
2000-11-15historical
-
2000-08-09$79,900
-
2000-08-09$79,900
-
1990-09-01soldstatus $20,000
ⓘ Source: listings_history table (triggers on properties + properties_extension) + one-shot
backfill from property_details.listing_events for pre-trigger history.
Tax reassessment forecast FL · Resets to sale price
- Current annual tax
- $2,171 · $181/mo
- Projected year-2 tax
- $2,864 · $239/mo
- Expected delta
- +$693/yr (+$58/mo · 31.9%)
ⓘ Screening estimate from a state-policy table — verify with the county assessor before closing.
Climate risk First Street
- Flood 9/10 Extreme FEMA zone X (shaded) · 99% chance over 30 yrs
- Wildfire 4/10 Moderate
- Heat 9/10 Extreme 7 d/yr ≥105°F today · 20 d/yr by 30 yrs out
- Wind 10/10 Extreme 99% chance of damaging wind over 30 yrs
- Air quality 2/10 Low 1 unhealthy d/yr today · 1 by 30 yrs out
Nearby sold comps map
Loading sold comps map…
Walkable amenities ~0.75 mi
Loading nearby amenities…
Taxation est. · year 1
- Rental income
- $31,515
- − Mortgage interest
- −$19,325
- − Property taxes
- −$2,171
- − Insurance
- −$2,522
- − Repairs & maintenance
- −$2,521
- − Management
- −$2,521
- − HOA
- −$1,680
- − Depreciation
- −$10,036
- Taxable loss
- −$9,262
- Est. tax savings @ 24.0%
- +$2,223
- After-tax cash flow
- $-964/yr
For passive investors: Depreciation is non-cash, so a rental often shows a tax loss while cash-flowing — sheltering income. Rental losses are passive: they offset passive income freely, and up to $25,000/yr can offset ordinary (W-2) income if you actively participate and your MAGI is under $100k (phasing out to $0 by $150k); unused losses carry forward. On sale, claimed depreciation is recaptured at up to 25%, and gains may owe capital-gains tax (a 1031 exchange can defer both). Figures are a year-1 estimate at your 24.0% rate — not tax advice; consult a CPA.
Schools (NCES district)
- District
- Volusia
- NCES district ID
- 1201920
- Math proficiency
- 44% ▼ -9.00%
- Reading proficiency
- 49% ▼ -3.00%
- Median HH income
- $42,946
- Composite
- 39.2/100
- National rank
- #4019
- State rank
- #47 of 73 in FL
Livability — New Smyrna Beach
- Score
- 69/100
- State rank
- #474
- US rank
- #8577
Category grades
Schools grade is shown separately in the Schools card above.
Census & demographics
- Census place
- New Smyrna Beach, FL
- County
- Volusia County · 556,871 people
- City population
- 42,039
- Metro
- Deltona-Daytona Beach-Ormond Beach, FL
- Population (ZIP)
- 10,192
- Household income
- $110,968
- Rent vs Own
- Severe rent burden
- 145.0
Population outlook (Volusia County) Hauer SSP2
- Today (2025)
- 572,749 people
- By 2030
- 598,695 · +4.5%
- By 2040
- 644,880 · +12.6%
- By 2050
- 681,451 · +19.0%
- By 2075
- 759,957 · +32.7%
- By 2100
- 778,902 · +36.0%
Race, ethnicity, and origin ACS 2023
- Neighborhood character
- Predominantly White (91%)
- Race & ethnicity
- White 91% Two or more races 5% Hispanic / Latino 5% Asian 1%
- Hispanic origin (detail)
- Common ancestry
- Romanian 4% Lithuanian 4% Italian 3%
- Foreign-born
- 7% · Canada, South Korea
- Languages at home
- 96% English-only · Spanish 2% Other Indo-European 1%
Political lean MEDSL · Volusia
- 2024 margin
- Strong R (+21.8) · D 38.7% · R 60.5%
- 2008→2024 swing
- -27.4pp toward R · 2008: 5.7pp · 2024: -21.8pp
- All cycles
- 2024: R+21.8 2020: R+14.1 2016: R+13.1 2012: R+1.2 2008: D+5.7
Not yet ingested
- Civics
- —
Market trends
- HPI YoY
- ▼ -297.06%
- Current HPI
- 345.3555
- Rent YoY
- ▲ 5.17%
- Metro
- Deltona-Daytona Beach-Ormond Beach, FL
- State GDP YoY
- ▲ 3.28%
- F500 in state
- 36
Industry mix (Fortune 500 HQ in FL)
| Industry | F500 HQs | Revenue |
|---|---|---|
| Industrial Technology | 2 | $29B |
|
||
| Insurance | 2 | $17B |
|
||
| Retail | 1 | $60B |
|
||
| Technology Distribution | 1 | $58B |
|
||
| Homebuilding | 1 | $35B |
|
||
| Technology Manufacturing | 1 | $35B |
|
||
Price history
+1625.0% since first listed32 events — show timeline
- 2026-03-17 Price Changed $345,000 Stellar MLS as Distributed by MLS Grid
- 2026-01-08 Listed $350,000 Stellar MLS as Distributed by MLS Grid
- 2025-09-28 Listing Removed — Stellar MLS as Distributed by MLS Grid
- 2025-09-03 Price Changed $374,999 Stellar MLS as Distributed by MLS Grid
- 2025-09-03 Price Changed $374,999 Daytona MLS
- 2025-07-24 Price Changed $375,999 Stellar MLS as Distributed by MLS Grid
- 2025-07-23 Price Changed $375,999 Daytona MLS
- 2025-06-19 Price Changed $379,999 Stellar MLS as Distributed by MLS Grid
- 2025-06-19 Price Changed $379,999 Daytona MLS
- 2025-06-02 Listed $385,000 Stellar MLS as Distributed by MLS Grid
- 2025-05-02 Price Changed $385,000 Daytona MLS
- 2025-04-17 Relisted — Daytona MLS
- 2025-04-14 Listing Removed — Daytona MLS
- 2025-04-14 Pending — Daytona MLS
- 2025-03-28 Listed $387,000 Daytona MLS
- 2017-08-18 Sold (Public Records) $174,950 Public Records
- 2017-08-17 Sold (MLS) $174,950 Stellar MLS as Distributed by MLS Grid
- 2017-08-17 Sold (MLS) $174,950 NSBMLS
- 2017-06-22 Contingent — NSBMLS
- 2017-06-14 Listed $179,900 NSBMLS
- 2017-06-13 Listed $179,900 Stellar MLS as Distributed by MLS Grid
- 2003-10-03 Sold (Public Records) $125,000 Public Records
- 2003-09-30 Sold (MLS) $125,000 NSBMLS
- 2003-09-30 Sold (MLS) $125,000 Stellar MLS as Distributed by MLS Grid
- 2003-08-20 Listed $129,900 NSBMLS
- 2003-08-20 Listed $129,900 Stellar MLS as Distributed by MLS Grid
- 2000-11-20 Sold (MLS) $77,500 NSBMLS
- 2000-11-20 Sold (MLS) $77,500 Stellar MLS as Distributed by MLS Grid
- 2000-11-15 Delisted — NSBMLS
- 2000-08-09 Listed $79,900 NSBMLS
- 2000-08-09 Listed $79,900 Stellar MLS as Distributed by MLS Grid
- 1990-09-01 Sold (Public Records) $20,000 Public Records
Property tax history
+1.4%/yrLatest (2025): $2,171 · +1.9% YoY. Source: county tax records.
Cash-flow waterfall
monthlySold comps — $/sqft
last 12 mo · ≤1 miLoading sold comps…