404 N Crestview Ave · Ash Grove, MO
Flood risk 1/10 · Minimal
- FEMA flood zone
- X (unshaded)
- Chance of flooding over 30 yrs
- 0.0%
- Est. flood insurance / yr
- $507 – $1,088
Fire risk 4/10 · Minor
- Est. fire insurance / yr
- $1,054 – $1,958
Heat risk 5/10 · Moderate
- Hot days now (above 106°F)
- 7 days/yr
- Hot days in 30 yrs
- 20 days/yr
Wind risk 2/10 · Minimal
- Chance of severe wind over 30 yrs
- 2.0%
Air-quality risk 2/10 · Minimal
- Unhealthy air days now
- 1 days/yr
- Unhealthy air days in 30 yrs
- 1 days/yr
Risk factors via First Street. Map © Google.
Why this score? — see what drove the C+ grade
The composite is a weighted blend of 9 inputs, each scored 0–100. Each bar is that input's sub-score; the figure is the points it added to the 100-point composite (weight × sub-score).
- Cash flow +28.1/30.0
- DSCR +10.0/10.0
- 1% rule +6.6/10.0
- ARV discount +5.1/15.0
- Schools +3.5/10.0
- Livability +3.1/5.0
- Rent growth +2.5/5.0
- Condition / age +2.5/5.0
- Appreciation +0.0/10.0
$179,900
🖨 Deal sheet (PDF) 📄 Offer letter ✓ Due diligence
Listing remarks
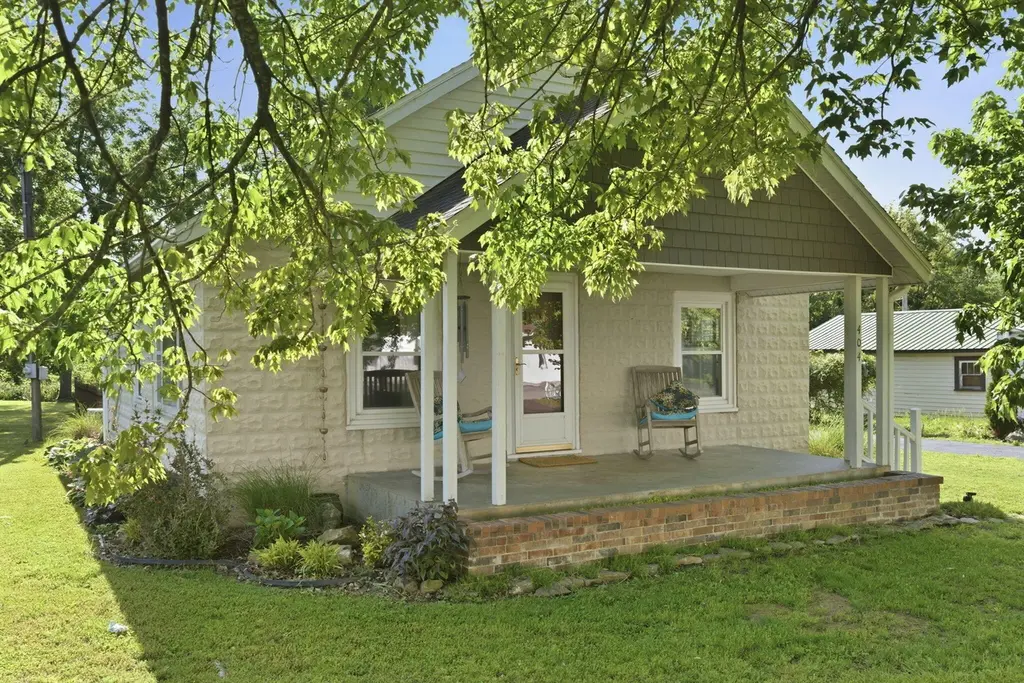
Charming, quaint, filled with character; are only partial expressions to try and manage how this house feels when stepping into it for the first time. This one has been tastefully updated in the kitchen, with new tile backsplash, stainless steel fridge. The wood floors will bring warmth to any occasion, the addition of the sunroom is sure to satisfy those looking for the balance of nature and convenience. Last but certainly not least, the upstairs has been transformed into the ideal sleep over space.
Key facts
- Upstairs transformed
- Wood floors
- New tile backsplash
Tags
Property features AI
Exterior
- Parking: Has garage (1 space); Driveway
- Utilities: Public water; Public sewer
- Home design: Single-family residential home; One level
- Construction: Composition roof
- Exterior features: Composition roof; Outbuilding; Greenhouse; Public-maintained asphalt road access; City street frontage; Has view
Interior
- Flooring: Hardwood; Linoleum; Tile
- Bathrooms: Two full bathrooms and one half bathroom
- Heating & cooling: Natural gas heating; Central heating; Central air conditioning
- Interior features: Includes washer and dryer; Hardwood, linoleum, and tile floors
- Laundry & utility: Main-level laundry (washer and dryer included)
Neighborhood map
What this means for you Summary
Snapshot
- This is a 2-bed/1.0-bath single-family listed at $180k.
Deal economics
- At list price, monthly cash flow is $565 ($7k/yr) — positive.
- The deal already cash-flows at list — no discount required.
- Meets the 1% rule at list price ($2k rent vs $180k).
- Cap rate 10.1% vs local median 5.4% in Ash Grove — top-decile yield for the area; either an underpriced asset or a hidden risk that comps aren't pricing in. Stress-test before assuming the spread holds.
Location & tenants
- Location reads 61/100 on livability (#435 in MO) — a middle-class / working-renter tenant base. Strengths: cost of living A+, housing A+; Watch: crime C-, amenities F, commute F.
- Ash Grove R-IV (rural): math 33% / reading 50% proficiency, ranked #121 of 324 in MO (top 37%) — families likely to look elsewhere, expect single-tenant / working-renter base with shorter leases.
- Zoned schools: Ash Grove Elem. (math 34% / reading 44%, grade F, #537 of 1,115 statewide, top 53%, 259 students, 47% FRL); Bois D'Arc Elem. (math 42% / reading 52%, grade D+, #95 of 391 statewide, top 25%, 144 students, 47% FRL); Ash Grove High (math 22% / reading 52%, grade F, #291 of 521 statewide, top 60%, 329 students, 37% FRL).
- Market conditions: 61 active listings in the ZIP; 1,302 units permitted in Greene County in 2024 (250 in 5+ unit buildings).
Forward outlook
- Local home prices are declining (-3.0%/yr); year-one equity from $1k of loan paydown is wiped out by about $5k of value loss. Plan a longer hold.
- Greene County population projected at +25% by 2050 — long-run rental-demand tailwind backs the buy-and-hold thesis.
- At projected returns (-3.0% appreciation + 3.0% rent growth), your $50k cash investment doubles in ~9 years — after that, you're playing with house money.
Negotiation context
- Only 2 days on market — expect competitive offers; lowballing is unlikely to land.
Risks & watch-outs
- Watch-outs: built in 1938 — expect roof / HVAC / electrical / plumbing capex.
- Climate carrying-cost: extreme-heat days projected 7→20/yr by 2055 (HVAC capex compounding) — expect insurance premiums to compound above CPI over the hold.
Questions for the listing agent
- Built in 1938 — when were the roof, HVAC, electrical panel, plumbing, and water heater last replaced?
- Is there a deadline driving the sale (1031 exchange, divorce, estate, relocation)? That informs how much negotiation room exists.
- What's the average days-on-market for RENTAL listings here right now (not sales)? A rising rental-DOM trend means longer vacancies and softer asking-rent achievability than the comps imply.
- What's the recent tenant-quality profile in this submarket — average credit score on applications, eviction rate, late-payment / NSF rate, and stable-employment percentage? A property-management company in the area should have these aggregated.
- How much new for-sale + rental construction is in the pipeline within 1–3 miles? Heavy new supply typically softens prices + rents 12–24 months out; constrained supply supports both.
Investment metrics
- 1% rule
- 1.16% ✓
- Cap rate
- 10.06%
- Cash-on-cash
- 13.46%
- DSCR
- 1.60
- GRM
- 7.2
CMA / ARV
- ARV (median comp)
- $170,667
- List price
- $179,900
- Delta
- 5.41%
- Verdict
- FAIR
- Comps
- 20 within 1.0 mi
Show comp detail 11 sales within ~0.75 mi
| Address | Dist | Beds/Ba | Sqft | Sold | Price | $/sf | Match |
|---|---|---|---|---|---|---|---|
| 404 N Crestview Ave | 0.00mi | 2/2.5 | 1,104 (0%) | 1mo | $179,900 | $163 | 93 |
| 700 E Prairie Ln | 0.59mi | 2/1.0 | 1,080 (-2%) | 4mo | $159,995 | $148 | 66 |
| 228 N Pringle Ave | 0.16mi | 3/1.0 (+1) | 1,056 (-4%) | 21mo | $159,900 | $151 | 62 |
| 409 E Walker St | 0.54mi | 2/1.0 | 1,036 (-6%) | 5mo | $99,900 | $96 | 60 |
| 206 E College St | 0.11mi | 2/1.0 | 988 (-10%) | 21mo | $179,900 | $182 | 60 |
| 301 W College St | 0.46mi | 2/2.0 | 1,062 (-4%) | 13mo | $149,900 | $141 | 57 |
| 501 E Prairie Ln | 0.57mi | 3/2.0 (+1) | 1,081 (-2%) | 17mo | $192,500 | $178 | 47 |
| 410 N Gordon Ave | 0.45mi | 3/2.0 (+1) | 1,248 (+13%) | 4mo | $215,000 | $172 | 45 |
| 502 W Mill St | 0.74mi | 3/2.0 (+1) | 1,164 (+5%) | 4mo | $199,900 | $172 | 44 |
| 804 E Prairie Ln | 0.64mi | 2/1.5 | 1,239 (+12%) | 14mo | $175,000 | $141 | 36 |
| 604 S Brookside Ave | 0.71mi | 3/1.0 (+1) | 1,268 (+15%) | 9mo | $38,000 | $30 | 29 |
Match score weights: distance 35% · size 25% · config 20% · recency 20%. Top-matched comps best support the ARV.
Projected returns pro-forma
-3.0% appreciation · 3.0% rent growth · sell at horizon
- IRR
- 3.5%
- Equity multiple
- 1.13×
- Total profit
- $6,766
- Equity at exit
- $26,824
- IRR
- 13.0%
- Equity multiple
- 2.03×
- Total profit
- $51,964
- Equity at exit
- $15,554
Cash invested: $50,372 (down + closing). Projections, not guarantees.
Landlord ↔ Tenant lean methodology
- Overall (STATE)
- 81 Strongly Landlord-Friendly
- State Missouri
- 81 Strongly Landlord-Friendly · R+10
- County
- — inherits STATE
- City
- — inherits STATE
ZIP-level market 65604
- Home prices YoY
- -13.1%
- Active inventory
- 61
- Price-to-rent
- 7.2×
Monthly cashflow live
- Estimated rent
- $2,092 medium interval (Pro) →
- Mortgage (P&I)
- −$943
- Tax from tax record
- −$69 /mo · $829/yr
- Insurance
- −$75
- HOA
- −$0
- Vacancy / Maint / Mgmt
- −$439
- Net cashflow
- $565
Break-even live
Sensitivity live
| Price | -10% $667 | -5% $616 | +0% $565 | +5% $514 | +10% $463 |
|---|---|---|---|---|---|
| Rent | -10% $400 | -5% $482 | +0% $565 | +5% $648 | +10% $730 |
| Rate | -1.0pp $656 | -0.5pp $611 | base $565 | +0.5pp $518 | +1.0pp $471 |
UW: 25.0% down · 7.5% · 30yr · 1.5% tax · 5.0% vac · 8.0% maint · 8.0% mgmt
Financing live
Cash to close
- Down payment
- $44,975
- Closing costs
- $5,397
- Reserves months
- —
- Total cash needed
- —
Loan-product check · same deal, 3 products live
Conventional
25% down · 7.5% · 30yr
- Down + closing
- —
- Monthly P&I
- —
- Monthly cashflow
- —
- DSCR
- —
- Eligible?
- —
Personal DTI + credit; lowest rate.
DSCR
20% down · 8.5% · 30yr
- Down + closing
- —
- Monthly P&I
- —
- Monthly cashflow
- —
- DSCR
- —
- Eligible?
- —
No personal income docs; deal must DSCR.
Hard money
10% down · 12.0% · 12mo
- Down + closing
- —
- Monthly P&I
- —
- Monthly cashflow
- —
- DSCR
- —
- Eligible?
- —
Short-term bridge; refi at stabilization.
Listing history 2 events
-
2026-05-03status Pending 505-char remark
-
2026-05-01$179,900 Active 505-char remark
ⓘ Source: listings_history table (triggers on properties + properties_extension) + one-shot
backfill from property_details.listing_events for pre-trigger history.
Tax reassessment forecast MO · Resets to sale price
- Current annual tax
- $829 · $69/mo
- Projected year-2 tax
- $1,745 · $145/mo
- Expected delta
- +$916/yr (+$76/mo · 110.5%)
ⓘ Screening estimate from a state-policy table — verify with the county assessor before closing.
Climate risk First Street
- Flood 1/10 Low FEMA zone X (unshaded) · 0% chance over 30 yrs
- Wildfire 4/10 Moderate
- Heat 5/10 Major 7 d/yr ≥106°F today · 20 d/yr by 30 yrs out
- Wind 2/10 Low 2% chance of damaging wind over 30 yrs
- Air quality 2/10 Low 1 unhealthy d/yr today · 1 by 30 yrs out
Nearby sold comps map
Loading sold comps map…
Walkable amenities ~0.75 mi
Loading nearby amenities…
Taxation est. · year 1
- Rental income
- $25,100
- − Mortgage interest
- −$10,077
- − Property taxes
- −$829
- − Insurance
- −$900
- − Repairs & maintenance
- −$2,008
- − Management
- −$2,008
- − Depreciation
- −$5,233
- Taxable income
- $4,045
- Est. tax owed @ 24.0%
- −$971
- After-tax cash flow
- $5,809/yr
For passive investors: Depreciation is non-cash, so a rental often shows a tax loss while cash-flowing — sheltering income. Rental losses are passive: they offset passive income freely, and up to $25,000/yr can offset ordinary (W-2) income if you actively participate and your MAGI is under $100k (phasing out to $0 by $150k); unused losses carry forward. On sale, claimed depreciation is recaptured at up to 25%, and gains may owe capital-gains tax (a 1031 exchange can defer both). Figures are a year-1 estimate at your 24.0% rate — not tax advice; consult a CPA.
Schools (NCES district)
- District
- Ash Grove R-IV
- NCES district ID
- 2903270
- Math proficiency
- 33% ▼ -7.00%
- Reading proficiency
- 50% ▲ 1.00%
- Median HH income
- $47,679
- Composite
- 35.45/100
- National rank
- #4929
- State rank
- #121 of 324 in MO
Livability — Ash Grove
- Score
- 61/100
- State rank
- #435
- US rank
- #17867
Category grades
Schools grade is shown separately in the Schools card above.
Census & demographics
- Census place
- Ash Grove, MO
- Population (ZIP)
- 3,909
Population outlook (Greene County) Hauer SSP2
- Today (2025)
- 319,054 people
- By 2030
- 335,135 · +5.0%
- By 2040
- 366,186 · +14.8%
- By 2050
- 397,431 · +24.6%
- By 2075
- 477,035 · +49.5%
- By 2100
- 520,828 · +63.2%
Race, ethnicity, and origin ACS 2023
- Neighborhood character
- Predominantly White (91%)
- Race & ethnicity
- White 91% Two or more races 7% Hispanic / Latino 5%
- Hispanic origin (detail)
- Mexican 3% Puerto Rican 2%
- Common ancestry
- Italian 2% Lithuanian 2% Romanian 2%
- Foreign-born
- 0%
- Languages at home
- 98% English-only · Spanish 2%
Political lean MEDSL · Greene
- 2024 margin
- Strong R (+20.8) · D 38.9% · R 59.7% · Other 1.4%
- 2008→2024 swing
- -5.0pp toward R · 2008: -15.8pp · 2024: -20.8pp
- All cycles
- 2024: R+20.8 2020: R+20.1 2016: R+27.4 2012: R+24.4 2008: R+15.8
Not yet ingested
- Civics
- —
Market trends
- HPI YoY
- ▼ -34.86%
- Current HPI
- 231.5643
- Rent YoY
- —
- Metro
- —
- State GDP YoY
- ▲ 1.84%
- F500 in state
- 20
Industry mix (Fortune 500 HQ in MO)
| Industry | F500 HQs | Revenue |
|---|---|---|
| Healthcare | 1 | $163B |
|
||
| Insurance | 1 | $21B |
|
||
| Industrial Technology | 1 | $17B |
|
||
| Retail | 1 | $16B |
|
||
| Industrial Distribution | 1 | $10B |
|
||
| Utilities | 1 | $9B |
|
||
Price history
4 events — show timeline
- 2026-06-03 Sold (Public Records) — Public Records
- 2026-06-02 Sold (MLS) — SOMO
- 2026-05-03 Pending — SOMO
- 2026-05-01 Listed $179,900 SOMO
Property tax history
+4.3%/yrLatest (2025): $829 · +15.7% YoY. Source: county tax records.
Cash-flow waterfall
monthlySold comps — $/sqft
last 12 mo · ≤1 miLoading sold comps…