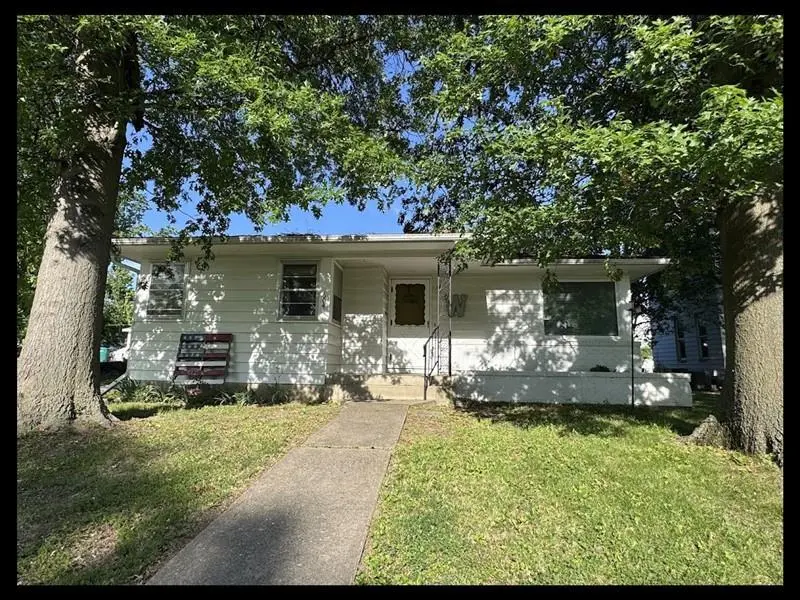
604 N Rutherford St · Macon, MO
Flood risk 1/10 · Minimal
- FEMA flood zone
- X (unshaded)
- Chance of flooding over 30 yrs
- 0.0%
- Est. flood insurance / yr
- $507 – $1,088
Fire risk 4/10 · Minor
- Est. fire insurance / yr
- $1,054 – $1,958
Heat risk 3/10 · Minor
- Hot days now (above 107°F)
- 7 days/yr
- Hot days in 30 yrs
- 16 days/yr
Wind risk 2/10 · Minimal
- Chance of severe wind over 30 yrs
- —
Air-quality risk 1/10 · Minimal
- Unhealthy air days now
- 0 days/yr
- Unhealthy air days in 30 yrs
- 0 days/yr
Risk factors via First Street. Map © Google.
Why this score? — see what drove the C grade
The composite is a weighted blend of 9 inputs, each scored 0–100. Each bar is that input's sub-score; the figure is the points it added to the 100-point composite (weight × sub-score).
- Cash flow +25.0/30.0
- DSCR +8.2/10.0
- ARV discount +7.5/15.0
- 1% rule +5.7/10.0
- Schools +4.1/10.0
- Livability +3.5/5.0
- Rent growth +2.5/5.0
- Condition / age +2.5/5.0
- Appreciation +0.0/10.0
$99,500
🖨 Deal sheet 📄 Offer letter ✓ Due diligence
Listing remarks
Charming corner-lot ranch offering easy living with a 1-car attached garage plus an oversized garage area for extra storage. Side parking and a small yard make maintenance simple and convenient. Inside, you'll find 2 spacious bedrooms, 1 updated bathroom, and a main-floor utility room. The large living room provides flexibility for both living and formal dining space. The kitchen features abundant cabinetry, generous countertop space, and room for a table or large island. The basement offers excellent storage and potential for additional finished living space. A second basement bathroom is in place and could be enclosed for added privacy. With a little TLC, this solid home has great potenti
Key facts
- Attached garage
- Corner-lot ranch
- Large living room
Tags
Property features AI
Exterior
- Parking: 1-car garage; Garage door opener
- Utilities: Public water; Public sewer; Cable available; Natural gas available
- Home design: Single family residence; Residential property; Located in the Hudson subdivision
- Construction: Frame and Masonite construction; Asphalt roof
- Exterior features: Storm door(s)
Interior
- Kitchen: Electric oven; Electric range; Refrigerator
- Flooring: Vinyl
- Bathrooms: 2 full bathrooms
- Heating & cooling: Window unit(s) for cooling
- Interior features: Storm windows; Full basement
- Laundry & utility: Electric water heater
Neighborhood map
What this means for you Summary
Snapshot
- This is a 2-bed/2.0-bath other listed at $100k.
Deal economics
- At list price, monthly cash flow is $217 ($3k/yr) — positive.
- The deal already cash-flows at list — no discount required.
- Meets the 1% rule at list price ($1k rent vs $100k).
Location & tenants
- Location reads 69/100 on livability (#151 in MO) — a middle-class / working-renter tenant base. Strengths: cost of living A+, housing A+, health & safety A-; Watch: amenities F, commute F, employment F.
- Macon County R-I (town): math 49% / reading 50% proficiency, ranked #54 of 324 in MO (top 17%) — families likely to look elsewhere, expect single-tenant / working-renter base with shorter leases.
- Market conditions: 43 active listings in the ZIP; 26 units permitted in Macon County in 2024 (19 in 5+ unit buildings).
Forward outlook
- Local home prices are declining (-3.0%/yr); year-one equity from $688 of loan paydown is wiped out by about $3k of value loss. Plan a longer hold.
- Macon County population projected at -17% by 2050 — secular population decline; favor cash flow + early exit over multi-decade hold.
Negotiation context
- Only 8 days on market — expect competitive offers; lowballing is unlikely to land.
Risks & watch-outs
- Watch-outs: built in 1957 — expect roof / HVAC / electrical / plumbing capex.
Questions for the listing agent
- Built in 1957 — when were the roof, HVAC, electrical panel, plumbing, and water heater last replaced?
- Is there a deadline driving the sale (1031 exchange, divorce, estate, relocation)? That informs how much negotiation room exists.
- Schools are B-rated — typically a magnet for longer-tenancy family renters. What's the average tenant stay here, and is there a school-zone premium baked into asking?
- What's the average days-on-market for RENTAL listings here right now (not sales)? A rising rental-DOM trend means longer vacancies and softer asking-rent achievability than the comps imply.
- What's the recent tenant-quality profile in this submarket — average credit score on applications, eviction rate, late-payment / NSF rate, and stable-employment percentage? A property-management company in the area should have these aggregated.
- How much new for-sale + rental construction is in the pipeline within 1–3 miles? Heavy new supply typically softens prices + rents 12–24 months out; constrained supply supports both.
Investment metrics
- 1% rule
- 1.07% ✓
- Cap rate
- 8.91%
- Cash-on-cash
- 9.36%
- DSCR
- 1.42
- GRM
- 7.8
CMA / ARV
No comps found within radius.
Projected returns pro-forma
-3.0% appreciation · 3.0% rent growth · sell at horizon
- IRR
- -2.2%
- Equity multiple
- 0.92×
- Total profit
- $-2,314
- Equity at exit
- $14,836
- IRR
- 7.5%
- Equity multiple
- 1.56×
- Total profit
- $15,698
- Equity at exit
- $8,603
Cash invested: $27,860 (down + closing). Projections, not guarantees.
Landlord ↔ Tenant lean methodology
- Overall (STATE)
- 81 Strongly Landlord-Friendly
- State Missouri
- 81 Strongly Landlord-Friendly · R+10
- County
- — inherits STATE
- City
- — inherits STATE
ZIP-level market 63552
- Home prices YoY
- -10.9%
- Active inventory
- 43
- Price-to-rent
- 7.8×
Monthly cashflow live
- Estimated rent
- $1,061 medium interval (Pro) →
- Mortgage (P&I)
- −$522
- Tax from tax record
- −$58 /mo · $694/yr
- Insurance
- −$41
- HOA
- −$0
- Vacancy / Maint / Mgmt
- −$223
- Net cashflow
- $217
Break-even live
UW: 25.0% down · 7.5% · 30yr · 1.5% tax · 5.0% vac · 8.0% maint · 8.0% mgmt
Financing live
Cash to close
- Down payment
- $24,875
- Closing costs
- $2,985
- Reserves months
- —
- Total cash needed
- —
Loan-product check · same deal, 3 products live
Conventional
25% down · 7.5% · 30yr
- Down + closing
- —
- Monthly P&I
- —
- Monthly cashflow
- —
- DSCR
- —
- Eligible?
- —
Personal DTI + credit; lowest rate.
DSCR
20% down · 8.5% · 30yr
- Down + closing
- —
- Monthly P&I
- —
- Monthly cashflow
- —
- DSCR
- —
- Eligible?
- —
No personal income docs; deal must DSCR.
Hard money
10% down · 12.0% · 12mo
- Down + closing
- —
- Monthly P&I
- —
- Monthly cashflow
- —
- DSCR
- —
- Eligible?
- —
Short-term bridge; refi at stabilization.
Listing history 7 events
-
2026-06-12statusdays on market $99,500 Pending 8 DOM
-
2026-06-09days on market $99,500 Active 6 DOM
-
2026-06-08days on market $99,500 Active 5 DOM
-
2026-06-07days on market $99,500 Active 4 DOM
-
2026-06-07days on market $99,500 Active 3 DOM
-
2026-06-04remarks 699-char remark
-
2026-06-04$99,500 Active 1 DOM
ⓘ Source: listings_history table (triggers on properties + properties_extension) + one-shot
backfill from property_details.listing_events for pre-trigger history.
Tax reassessment forecast MO · Resets to sale price
- Current annual tax
- $694 · $58/mo
- Projected year-2 tax
- $965 · $80/mo
- Expected delta
- +$271/yr (+$23/mo · 39.1%)
ⓘ Screening estimate from a state-policy table — verify with the county assessor before closing.
Climate risk First Street
- Flood 1/10 Low FEMA zone X (unshaded) · 0% chance over 30 yrs
- Wildfire 4/10 Moderate
- Heat 3/10 Moderate 7 d/yr ≥107°F today · 16 d/yr by 30 yrs out
- Wind 2/10 Low
- Air quality 1/10 Low 0 unhealthy d/yr today · 0 by 30 yrs out
Nearby sold comps map
Loading sold comps map…
Walkable amenities ~0.75 mi
Loading nearby amenities…
Taxation est. · year 1
- Rental income
- $12,733
- − Mortgage interest
- −$5,574
- − Property taxes
- −$694
- − Insurance
- −$498
- − Repairs & maintenance
- −$1,019
- − Management
- −$1,019
- − Depreciation
- −$2,895
- Taxable income
- $1,037
- Est. tax owed @ 24.0%
- −$249
- After-tax cash flow
- $2,358/yr
For passive investors: Depreciation is non-cash, so a rental often shows a tax loss while cash-flowing — sheltering income. Rental losses are passive: they offset passive income freely, and up to $25,000/yr can offset ordinary (W-2) income if you actively participate and your MAGI is under $100k (phasing out to $0 by $150k); unused losses carry forward. On sale, claimed depreciation is recaptured at up to 25%, and gains may owe capital-gains tax (a 1031 exchange can defer both). Figures are a year-1 estimate at your 24.0% rate — not tax advice; consult a CPA.
Schools (NCES district)
- District
- Macon County R-I
- NCES district ID
- 2919410
- Math proficiency
- 49% ▼ -4.00%
- Reading proficiency
- 50% ▲ 1.00%
- Median HH income
- $37,850
- Composite
- 41.21/100
- National rank
- #3539
- State rank
- #54 of 324 in MO
Livability — Macon
- Score
- 69/100
- State rank
- #151
- US rank
- #8551
Category grades
Schools grade is shown separately in the Schools card above.
Census & demographics
- Census place
- Macon, MO
- Population (ZIP)
- 7,383
Population outlook (Macon County) Hauer SSP2
- Today (2025)
- 14,692 people
- By 2030
- 14,209 · -3.3%
- By 2040
- 13,197 · -10.2%
- By 2050
- 12,160 · -17.2%
- By 2075
- 9,745 · -33.7%
- By 2100
- 7,314 · -50.2%
Race, ethnicity, and origin ACS 2023
- Neighborhood character
- Predominantly White (89%)
- Race & ethnicity
- White 89% Two or more races 5% Black 3% Hispanic / Latino 2%
- Common ancestry
- Greek 2% Italian 2% Slovak 2%
- Foreign-born
- 1% · China, Canada
- Languages at home
- 98% English-only · Spanish 1%
Political lean MEDSL · Macon
- 2024 margin
- Solid R (+61.5) · D 18.9% · R 80.4%
- 2008→2024 swing
- -37.4pp toward R · 2008: -24.1pp · 2024: -61.5pp
- All cycles
- 2024: R+61.5 2020: R+56.3 2016: R+56.4 2012: R+33.4 2008: R+24.1
Not yet ingested
- Civics
- —
Market trends
- HPI YoY
- ▼ -21.49%
- Current HPI
- 175.8958
- Rent YoY
- —
- Metro
- —
- State GDP YoY
- ▲ 1.84%
- F500 in state
- 20
Industry mix (Fortune 500 HQ in MO)
| Industry | F500 HQs | Revenue |
|---|---|---|
| Healthcare | 1 | $163B |
|
||
| Insurance | 1 | $21B |
|
||
| Industrial Technology | 1 | $17B |
|
||
| Retail | 1 | $16B |
|
||
| Industrial Distribution | 1 | $10B |
|
||
| Utilities | 1 | $9B |
|
||
Price history
1 event — show timeline
- 2026-06-03 Listed $99,500 NECAR
Property tax history
+2.5%/yrLatest (2025): $694 · +8.7% YoY. Source: county tax records.
Cash-flow waterfall
monthlySold comps — $/sqft
last 12 mo · ≤1 miLoading sold comps…