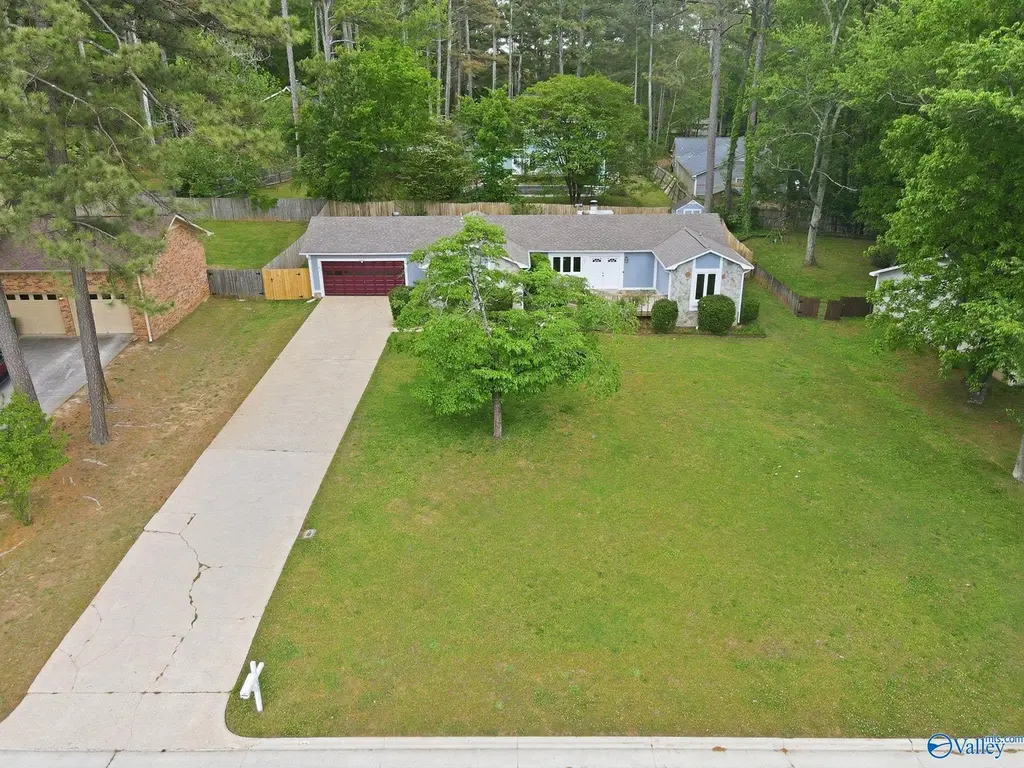
694 Crestview Dr · Madison, AL
Flood risk 1/10 · Minimal
- FEMA flood zone
- X (unshaded)
- Chance of flooding over 30 yrs
- 0.0%
- Est. flood insurance / yr
- $507 – $1,088
Fire risk 1/10 · Minimal
- Est. fire insurance / yr
- $916 – $1,700
Heat risk 5/10 · Moderate
- Hot days now (above 106°F)
- 6 days/yr
- Hot days in 30 yrs
- 16 days/yr
Wind risk 4/10 · Minor
- Chance of severe wind over 30 yrs
- 19.0%
Air-quality risk 2/10 · Minimal
- Unhealthy air days now
- 0 days/yr
- Unhealthy air days in 30 yrs
- 2 days/yr
Risk factors via First Street. Map © Google.
Why this score? — see what drove the D- grade
The composite is a weighted blend of 9 inputs, each scored 0–100. Each bar is that input's sub-score; the figure is the points it added to the 100-point composite (weight × sub-score).
- Appreciation +10.0/10.0
- Cash flow +6.8/30.0
- ARV discount +5.6/15.0
- Schools +5.6/10.0
- Livability +3.8/5.0
- Rent growth +2.9/5.0
- Condition / age +2.5/5.0
- DSCR +1.1/10.0
- 1% rule +0.8/10.0
$299,987
🖨 Deal sheet (PDF) 📄 Offer letter ✓ Due diligence
Listing remarks
Meticulously maintained 3 bedroom, 2 bath ranch home in the heart of Madison City! Conveniently located across from Dublin Park and just minutes to shopping, restaurants, top schools, Research Park and Redstone Arsenal. Spacious living room features vaulted ceiling, natural wood beam and cozy wood burning fireplace. Kitchen offers plenty of storage and opens to dining area. Isolated master suite has vaulted ceiling, wood beam and private bath with double vanity. New windows and doors, newer carpet, updated appliances, recent exterior paint, gutter guards, plus washer, dryer and fridge remain. Private fenced backyard with patio and storage shed. Move in ready and a must see!
Key facts
- Updated appliances
- Ranch home
- 0.34 acre lot
Tags
Neighborhood map
What this means for you Summary
Snapshot
- This is a 3-bed/1.0-bath single-family listed at $300k.
Deal economics
- At list price, monthly cash flow is $-461 ($-6k/yr) — negative.
- To cash-flow at today's rent, offer at most $219k (27.2% below list).
- To meet the 1% rule (rent ≥ 1% of price), the offer needs to be $173k (42.3% below list).
- Recommended offer: $173k (42.3% below list) — sets the bar for 1% rule.
- Cap rate 4.4% vs local median 2.6% in Madison — top-decile yield for the area; either an underpriced asset or a hidden risk that comps aren't pricing in. Stress-test before assuming the spread holds.
Location & tenants
- Location reads 76/100 on livability (#12 in AL, #3,280 nationally) — a middle-class / working-renter tenant base. Strengths: employment A+, housing A+, crime B+; Watch: amenities F, commute F.
- Madison City (suburban): math 51% / reading 71% proficiency, ranked #4 of 129 in AL (top 3%) — acceptable for families but not a draw, mixed tenant base, ~2y average lease; only 17% free/reduced lunch — higher-income household profile.
- Zoned schools: Midtown Elementary School (math 49% / reading 78%, grade B, #46 of 627 statewide, top 8%, 999 students, 26% FRL); Bob Jones High School (math 53% / reading 51%, grade D+, #11 of 305 statewide, top 4%, 1,920 students, 24% FRL).
- Market conditions: Rents rising (+1.6%/yr); 390 active listings in the ZIP; 37 comparable units currently listed for rent nearby; rentals lingering (median 46d on market — plan ~5-8 weeks vacancy on turnover, expect pricing pressure); 54% of comp listings sitting > 30 days — soft ceiling on asking rent; high-income renter base; 4,709 units permitted in Madison County in 2024 (1,186 in 5+ unit buildings).
- This rent is only 18% of the median local income ($117k/yr) — well below the 30% rent-burden line; pricing power to push rent on renewal without tenant pushback.
Forward outlook
- In year one you build about $32k of equity ($2k loan paydown + $30k appreciation (10.0% local appreciation)).
- Madison County population projected at +18% by 2050 — long-run rental-demand tailwind backs the buy-and-hold thesis.
- By year 2, paydown + projected appreciation supports a ~$52k cash-out refi (75% LTV) — recoverable capital for the next deal without selling this one.
Negotiation context
- Only 1 days on market — expect competitive offers; lowballing is unlikely to land.
Risks & watch-outs
- Climate carrying-cost: extreme-heat days projected 6→16/yr by 2055 (HVAC capex compounding) — expect insurance premiums to compound above CPI over the hold.
Questions for the listing agent
- What do current leases actually rent for vs. the listed asking? Can we see a recent rent roll and the last 12 months of T-12 income?
- Is there a deadline driving the sale (1031 exchange, divorce, estate, relocation)? That informs how much negotiation room exists.
- Schools are A-rated — typically a magnet for longer-tenancy family renters. What's the average tenant stay here, and is there a school-zone premium baked into asking?
- The area grade is low — what's the realistic commute time and amenity access for the typical tenant pool here? Any planned neighborhood developments (good or bad) we should know about?
- What's the average days-on-market for RENTAL listings here right now (not sales)? A rising rental-DOM trend means longer vacancies and softer asking-rent achievability than the comps imply.
- What's the recent tenant-quality profile in this submarket — average credit score on applications, eviction rate, late-payment / NSF rate, and stable-employment percentage? A property-management company in the area should have these aggregated.
- How much new for-sale + rental construction is in the pipeline within 1–3 miles? Heavy new supply typically softens prices + rents 12–24 months out; constrained supply supports both.
Investment metrics
- 1% rule
- 0.58% ✗
- Cap rate
- 4.45%
- Cash-on-cash
- -6.59%
- DSCR
- 0.71
- GRM
- 14.4
CMA / ARV
- ARV (on-the-fly)
- $287,956
- Comps found
- 12
Show comp detail 12 sales within ~0.75 mi
| Address | Dist | Beds/Ba | Sqft | Sold | Price | $/sf | Match |
|---|---|---|---|---|---|---|---|
| 694 Crestview Dr | 0.00mi | 3/2.0 | 1,551 (+4%) | 1mo | $299,987 | $193 | 89 |
| 798 Seina Vista Dr | 0.19mi | 3/2.0 | 1,543 (+3%) | 0mo | $290,000 | $188 | 81 |
| 108 Stavemill Cir | 0.08mi | 3/2.0 | 1,629 (+9%) | 1mo | $379,900 | $233 | 76 |
| 120 Betty Williams Dr | 0.32mi | 4/2.0 (+1) | 1,537 (+3%) | 0mo | $290,000 | $189 | 71 |
| 111 Betty Williams Dr | 0.39mi | 3/2.0 | 1,537 (+3%) | 3mo | $296,000 | $193 | 70 |
| 113 Betty Williams Dr | 0.37mi | 4/2.0 (+1) | 1,537 (+3%) | 1mo | $299,425 | $195 | 68 |
| 1005 Wood Cir | 0.30mi | 3/2.0 | 1,618 (+8%) | 2mo | $310,000 | $192 | 67 |
| 107 Betty Williams Dr | 0.41mi | 4/2.0 (+1) | 1,537 (+3%) | 2mo | $280,000 | $182 | 66 |
| 1109 Woodbine Rd | 0.48mi | 3/2.0 | 1,609 (+8%) | 2mo | $225,000 | $140 | 59 |
| 416 Walton Rd | 0.38mi | 3/2.0 | 1,306 (-12%) | 1mo | $263,000 | $201 | 57 |
| 217 Golden Rod Ln | 0.56mi | 3/2.0 | 1,318 (-12%) | 3mo | $266,100 | $202 | 48 |
| 1306 Nolan Ct | 0.61mi | 3/2.0 | 1,280 (-14%) | 2mo | $260,000 | $203 | 42 |
Match score weights: distance 35% · size 25% · config 20% · recency 20%. Top-matched comps best support the ARV.
Projected returns pro-forma
10.0% appreciation · 1.58% rent growth · sell at horizon
- IRR
- 19.3%
- Equity multiple
- 2.56×
- Total profit
- $131,449
- Equity at exit
- $270,252
- IRR
- 17.5%
- Equity multiple
- 5.82×
- Total profit
- $405,276
- Equity at exit
- $582,809
Cash invested: $83,996 (down + closing). Projections, not guarantees.
Landlord ↔ Tenant lean methodology
- Overall (STATE)
- 90 Strongly Landlord-Friendly
- State Alabama
- 90 Strongly Landlord-Friendly · R+15
- County
- — inherits STATE
- City
- — inherits STATE
ZIP-level market 35758
- Home prices YoY
- 4.2%
- Rents YoY
- 1.6%
- Active inventory
- 390
- Price-to-rent
- 14.4×
Monthly cashflow live
- Estimated rent
- $1,732 high interval (Pro) →
- Mortgage (P&I)
- −$1,573
- Tax from tax record
- −$131 /mo · $1,570/yr
- Insurance
- −$125
- HOA
- −$0
- Vacancy / Maint / Mgmt
- −$364
- Net cashflow
- $-461
Break-even live
Sensitivity live
| Price | -10% $-291 | -5% $-376 | +0% $-461 | +5% $-546 | +10% $-631 |
|---|---|---|---|---|---|
| Rent | -10% $-598 | -5% $-530 | +0% $-461 | +5% $-393 | +10% $-324 |
| Rate | -1.0pp $-310 | -0.5pp $-385 | base $-461 | +0.5pp $-539 | +1.0pp $-618 |
UW: 25.0% down · 7.5% · 30yr · 1.5% tax · 5.0% vac · 8.0% maint · 8.0% mgmt
Financing live
Cash to close
- Down payment
- $74,997
- Closing costs
- $9,000
- Reserves months
- —
- Total cash needed
- —
Loan-product check · same deal, 3 products live
Conventional
25% down · 7.5% · 30yr
- Down + closing
- —
- Monthly P&I
- —
- Monthly cashflow
- —
- DSCR
- —
- Eligible?
- —
Personal DTI + credit; lowest rate.
DSCR
20% down · 8.5% · 30yr
- Down + closing
- —
- Monthly P&I
- —
- Monthly cashflow
- —
- DSCR
- —
- Eligible?
- —
No personal income docs; deal must DSCR.
Hard money
10% down · 12.0% · 12mo
- Down + closing
- —
- Monthly P&I
- —
- Monthly cashflow
- —
- DSCR
- —
- Eligible?
- —
Short-term bridge; refi at stabilization.
Rent comps 37 comps
| Address | Beds | Baths | Sqft | Rent | $/sqft | DOM | Units | Dist |
|---|---|---|---|---|---|---|---|---|
| 712 Marion Dr Madison, AL | 3.0 | 1.0 | 1253 | $1,450 | $1.16 | 45d | 1 | 0.27mi |
| 101 Springfield Ln Madison, AL | 3.0 | 2.0 | 1640 | $2,350 | $1.43 | 45d | 1 | 0.31mi |
| 104 Kathy Cir Madison, AL | 3.0 | 2.0 | 1768 | $1,995 | $1.13 | 45d | 1 | 0.31mi |
| 121 Betty Garrett Dr Madison, AL | 4.0 | 2.0 | 1841 | $2,000 | $1.09 | 45d | 1 | 0.32mi |
| 115 Betty Garrett Dr Madison, AL | 4.0 | 2.0 | 1841 | $2,090 | $1.14 | 25d | 1 | 0.36mi |
| 112 Betty Garrett Dr Madison, AL | 4.0 | 2.0 | 1841 | $2,049 | $1.11 | 45d | 1 | 0.38mi |
| 200 Millstone Ln Madison, AL | 3.0 | 2.0 | 1425 | $2,000 | $1.40 | 45d | 1 | 0.38mi |
| 210 Waters Edge Ln #6 Madison, AL | 2.0 | 2.0 | 1060 | $1,075 | $1.01 | 45d | 1 | 0.39mi |
| 349 Waters Edge Ln Unit n/a Madison, AL | 2.0 | 2.0 | 1055 | $1,050 | $1.00 | 45d | 1 | 0.39mi |
| 262 Waters Edge Ln Unit 262 Madison, AL | 2.0 | 2.0 | 1055 | $1,175 | $1.11 | 45d | 1 | 0.40mi |
| 416 Walton Rd Madison, AL | 3.0 | 2.0 | 1306 | $1,795 | $1.37 | 15d | 1 | 0.40mi |
| 1105 Woodbine Rd Madison, AL | 3.0 | 1.5 | 1254 | $1,500 | $1.20 | 25d | 1 | 0.42mi |
| 510 Clift Dr Madison, AL | 3.0 | 2.0 | 1197 | $1,600 | $1.34 | 45d | 1 | 0.43mi |
| 103 Betty Garrett Dr Madison, AL | 4.0 | 2.0 | 1537 | $2,600 | $1.69 | 45d | 1 | 0.44mi |
| 245 Pineridge Rd Madison, AL | 3.0 | 2.0 | 1812 | $2,000 | $1.10 | 45d | 1 | 0.57mi |
| 180 Hughes Rd Madison, AL | 1.0–4.0 | 1.0–3.5 | 1373 | $2,250 | $1.64 | 15d | 45 | 0.77mi |
| 403 Oakland Rd Madison, AL | 2.0 | 2.5 | 1165 | $1,295 | $1.11 | 45d | 1 | 0.79mi |
| 104 Westscott Dr Madison, AL | 2.0 | 2.0 | 975 | $995 | $1.02 | 45d | 1 | 0.80mi |
| 7900 Old Madison Pike Madison, AL | 2.0–4.0 | 1.0–2.5 | 1313 | $1,445 | $1.10 | 15d | 11 | 0.80mi |
| 111 Westscott Dr Madison, AL | 2.0 | 2.0 | 975 | $995 | $1.02 | 45d | 1 | 0.80mi |
| 124 Westscott Dr Madison, AL | 2.0 | 2.0 | 994 | $1,025 | $1.03 | 23d | 1 | 0.83mi |
| 194 Shelton Rd Madison, AL | 2.0 | 1.0–2.0 | 729 | $1,149 | $1.58 | 15d | 9 | 0.97mi |
| 425 Falls PT SW Unit 1 Madison, AL | 3.0 | 3.0 | 1375 | $1,615 | $1.17 | 45d | 1 | 1.04mi |
| 2002 Flagstone Dr Madison, AL | 1.0–3.0 | 1.0–2.0 | 973 | $1,544 | $1.59 | 15d | 77 | 1.08mi |
| 105 Browns Ridge Ln Unit 1 Madison, AL | 2.0 | 2.0 | 984 | $1,250 | $1.27 | 25d | 1 | 1.16mi |
| 105 Whisperbrook Cir Madison, AL | 3.0 | 2.0 | 1608 | $1,800 | $1.12 | 25d | 1 | 1.16mi |
| 134 Michli Rd Madison, AL | 2.0 | 2.5 | 1564 | $1,595 | $1.02 | 45d | 1 | 1.17mi |
| 128 Michli Rd Madison, AL | 2.0 | 3.0 | 1564 | $1,550 | $0.99 | 45d | 1 | 1.17mi |
| 202 High Rd Madison, AL | 3.0 | 2.5 | 1759 | $2,375 | $1.35 | 25d | 1 | 1.19mi |
| 2300 Colonial Lake Dr Madison, AL | 1.0–3.0 | 1.0–2.0 | 1083 | $1,338 | $1.23 | 15d | 39 | 1.23mi |
| 100 Arch St Pl Madison, AL | 1.0–2.0 | 1.0–2.0 | 838 | $1,706 | $2.03 | 15d | 20 | 1.24mi |
| 4286 Sullivan St Madison, AL | 3.0 | 2.0 | 1815 | $2,100 | $1.16 | 23d | 1 | 1.25mi |
| 90 High St Unit 100A Madison, AL | 2.0 | 1.0 | 900 | $995 | $1.11 | 45d | 1 | 1.27mi |
| 114 Telluride Dr Madison, AL | 3.0 | 2.0 | 1578 | $1,795 | $1.14 | 45d | 1 | 1.28mi |
| 1 Madison Park Dr Madison, AL | 1.0–3.0 | 1.0–2.0 | 1149 | $2,157 | $1.88 | 15d | 18 | 1.34mi |
| 286 Slaughter Rd NW Madison, AL | 1.0–3.0 | 1.0–3.0 | 1385 | $2,199 | $1.59 | 15d | 31 | 1.35mi |
| 240 Stadium Way Madison, AL | 1.0–2.0 | 1.0–2.0 | 995 | $1,690 | $1.70 | 15d | 29 | 1.47mi |
Listing history 2 events
-
2026-04-25status Pending
-
2026-04-23$299,987 Active
ⓘ Source: listings_history table (triggers on properties + properties_extension) + one-shot
backfill from property_details.listing_events for pre-trigger history.
Tax reassessment forecast AL · Resets to sale price
- Current annual tax
- $1,570 · $131/mo
- Projected year-2 tax
- $1,570 · $131/mo
- Expected delta
- $0/yr ($0/mo · 0.0%)
ⓘ Screening estimate from a state-policy table — verify with the county assessor before closing.
Climate risk First Street
- Flood 1/10 Low FEMA zone X (unshaded) · 0% chance over 30 yrs
- Wildfire 1/10 Low
- Heat 5/10 Major 6 d/yr ≥106°F today · 16 d/yr by 30 yrs out
- Wind 4/10 Moderate 19% chance of damaging wind over 30 yrs
- Air quality 2/10 Low 0 unhealthy d/yr today · 2 by 30 yrs out
Nearby sold comps map
Loading sold comps map…
Walkable amenities ~0.75 mi
Loading nearby amenities…
Taxation est. · year 1
- Rental income
- $20,778
- − Mortgage interest
- −$16,804
- − Property taxes
- −$1,570
- − Insurance
- −$1,500
- − Repairs & maintenance
- −$1,662
- − Management
- −$1,662
- − Depreciation
- −$8,727
- Taxable loss
- −$11,147
- Est. tax savings @ 24.0%
- +$2,675
- After-tax cash flow
- $-2,858/yr
For passive investors: Depreciation is non-cash, so a rental often shows a tax loss while cash-flowing — sheltering income. Rental losses are passive: they offset passive income freely, and up to $25,000/yr can offset ordinary (W-2) income if you actively participate and your MAGI is under $100k (phasing out to $0 by $150k); unused losses carry forward. On sale, claimed depreciation is recaptured at up to 25%, and gains may owe capital-gains tax (a 1031 exchange can defer both). Figures are a year-1 estimate at your 24.0% rate — not tax advice; consult a CPA.
Schools (NCES district)
- District
- Madison City
- NCES district ID
- 0100008
- Math proficiency
- 51% ▼ -25.00%
- Reading proficiency
- 71% ▼ -2.00%
- Median HH income
- $89,091
- Composite
- 55.56/100
- National rank
- #1238
- State rank
- #4 of 129 in AL
Livability — Madison
- Score
- 76/100
- State rank
- #12
- US rank
- #3280
Category grades
Schools grade is shown separately in the Schools card above.
Census & demographics
- Census place
- Madison, AL
- County
- Madison County · 380,832 people
- City population
- 93,742
- Metro
- Huntsville, AL
- Population (ZIP)
- 50,266
- Household income
- $117,380
- Rent vs Own
- Severe rent burden
- 875.0
Population outlook (Madison County) Hauer SSP2
- Today (2025)
- 392,086 people
- By 2030
- 409,788 · +4.5%
- By 2040
- 440,557 · +12.4%
- By 2050
- 460,990 · +17.6%
- By 2075
- 502,872 · +28.3%
- By 2100
- 513,623 · +31.0%
Race, ethnicity, and origin ACS 2023
- Neighborhood character
- Predominantly White (68%)
- Race & ethnicity
- White 68% Black 14% Hispanic / Latino 8% Asian 7% Two or more races 7%
- Hispanic origin (detail)
- Mexican 3% Puerto Rican 2%
- Common ancestry
- Slovak 3% Italian 2% Lithuanian 2%
- Foreign-born
- 9% · Canada, South Korea, Vietnam
- Languages at home
- 87% English-only · Spanish 5% Other Asian/Pacific 2% Chinese 1%
Political lean MEDSL · Madison
- 2024 margin
- Lean R (+9.0) · D 44.7% · R 53.7% · Other 1.6%
- 2008→2024 swing
- +6.0pp toward D · 2008: -14.9pp · 2024: -9.0pp
- All cycles
- 2024: R+9.0 2020: R+8.0 2016: R+16.8 2012: R+18.7 2008: R+14.9
Not yet ingested
- Civics
- —
Market trends
- HPI YoY
- ▲ 14.46%
- Current HPI
- 355.2784
- Rent YoY
- ▲ 1.58%
- Metro
- Huntsville, AL
- State GDP YoY
- ▲ 2.94%
- F500 in state
- 4
Industry mix (Fortune 500 HQ in AL)
| Industry | F500 HQs | Revenue |
|---|---|---|
| Financial Services | 1 | $8B |
|
||
| Healthcare | 1 | $5B |
|
||
Price history
2 events — show timeline
- 2026-04-25 Pending — VMLS
- 2026-04-23 Listed $299,987 VMLS
Property tax history
+7.1%/yrLatest (2024): $1,570 · +6.0% YoY. Source: county tax records.
Cash-flow waterfall
monthlySold comps — $/sqft
last 12 mo · ≤1 miLoading sold comps…