W11461 Carter St · Mentor, WI
Flood risk 1/10 · Minimal
- FEMA flood zone
- X (unshaded)
- Chance of flooding over 30 yrs
- 0.0%
- Est. flood insurance / yr
- $473 – $860
Fire risk 3/10 · Minor
- Est. fire insurance / yr
- $636 – $1,182
Heat risk 2/10 · Minimal
- Hot days now (above 97°F)
- 7 days/yr
- Hot days in 30 yrs
- 14 days/yr
Wind risk 2/10 · Minimal
- Chance of severe wind over 30 yrs
- —
Air-quality risk 1/10 · Minimal
- Unhealthy air days now
- 0 days/yr
- Unhealthy air days in 30 yrs
- 0 days/yr
Risk factors via First Street. Map © Google.
Why this score? — see what drove the B grade
The composite is a weighted blend of 9 inputs, each scored 0–100. Each bar is that input's sub-score; the figure is the points it added to the 100-point composite (weight × sub-score).
- Cash flow +30.0/30.0
- DSCR +10.0/10.0
- Appreciation +9.0/10.0
- 1% rule +8.3/10.0
- ARV discount +7.5/15.0
- Schools +2.6/10.0
- Rent growth +2.5/5.0
- Livability +2.5/5.0
- Condition / age +2.5/5.0
$69,900
🖨 Deal sheet 📄 Offer letter ✓ Due diligence
Listing remarks
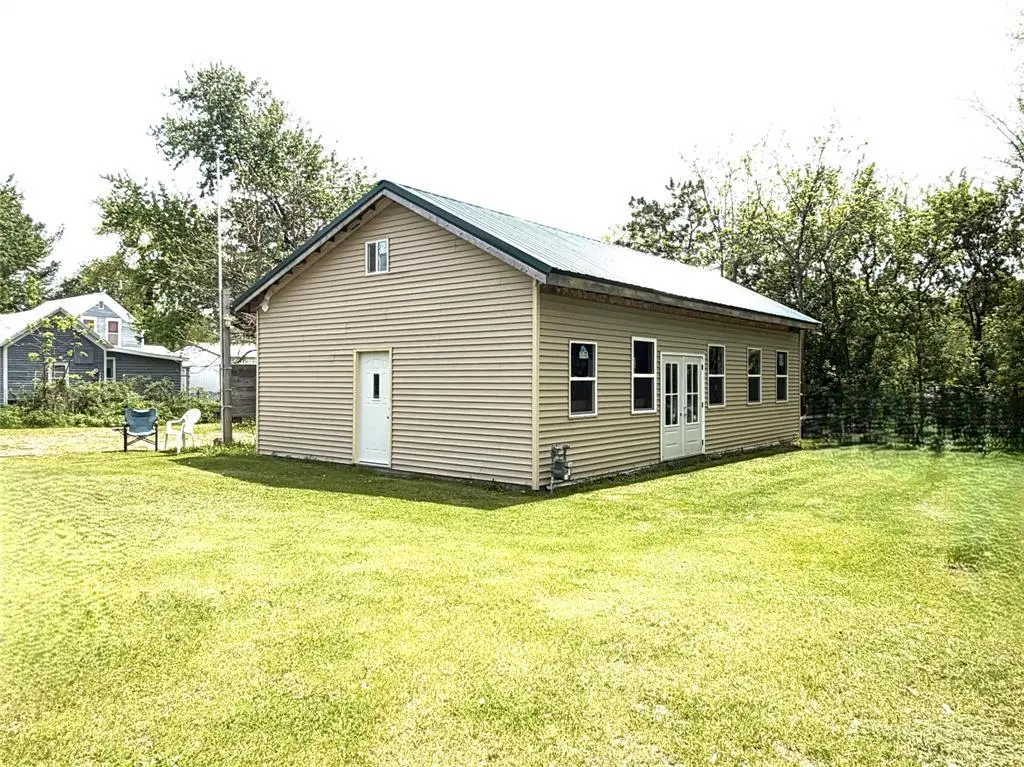
The possibilities are endless for this new home construction that has all of the expensive structural components completed, ready for you to finish with your vision! Thinking of a home? vacation rental? hunting basecamp? weekend getaway? You can see Emerson Lake from your back yard, 2 minute walk and in a great recreation area, UTV hub with routes and trails in every direction! This 24x40 slab home construction began in 2020 and features 10' sidewalls, screwed steel roof, 2x12 rafters 16"apart, cathedral ceilings w/ enough room to add a loft, new vinyl windows, doors and more! The home is set up for NG in floor heat and plumbed for 2 baths. There is a drilled well, conventional septi
Key facts
- Drilled well
- Conventional septic
- Emerson lake view
Tags
Property features AI
Finance
- Other: Sellers' personal property excluded
Exterior
- Utilities: Well water; Private septic system; Other utilities (see remarks)
- Home design: Single-family, 1-story home; Residential zoning
- Construction: Guest house on property; Less than 1/2 acre
- Exterior features: Vinyl and wood exterior; Located on Emerson Lake; Lakefront
Interior
- Bathrooms: 2 full bathrooms
- Heating & cooling: In-floor radiant heating; Lp gas and natural gas available
- Interior features: No basement (slab)
Neighborhood map
What this means for you Summary
Snapshot
- This is a 2-bed/2.0-bath single-family listed at $70k.
Deal economics
- At list price, monthly cash flow is $295 ($4k/yr) — positive.
- The deal already cash-flows at list — no discount required.
- Meets the 1% rule at list price ($928 rent vs $70k).
- Recommended offer: $69k (1.5% below list) — sets the bar for market timing.
Location & tenants
- Location reads: area grade B — affects rentability + tenant quality, not the cash-flow math above.
- Alma Center School District (rural): math 33% / reading 29% proficiency, ranked #273 of 342 in WI (top 80%) — families likely to look elsewhere, expect single-tenant / working-renter base with shorter leases.
- Market conditions: 1 active listings in the ZIP; 76 units permitted in Clark County in 2024 (0 in 5+ unit buildings).
Forward outlook
- In year one you build about $6k of equity ($483 loan paydown + $6k appreciation (8.0% local appreciation)).
- Clark County population projected at -21% by 2050 — secular population decline; favor cash flow + early exit over multi-decade hold.
- At projected returns (8.0% appreciation + 3.0% rent growth), your $20k cash investment doubles in ~2 years — after that, you're playing with house money.
- By year 6, paydown + projected appreciation supports a ~$34k cash-out refi (75% LTV) — recoverable capital for the next deal without selling this one.
Negotiation context
- It's been on market 27 days — a 2% lower offer ($69k) is reasonable based on typical stale-listing flexibility.
Questions for the listing agent
- Is there a deadline driving the sale (1031 exchange, divorce, estate, relocation)? That informs how much negotiation room exists.
- What's the average days-on-market for RENTAL listings here right now (not sales)? A rising rental-DOM trend means longer vacancies and softer asking-rent achievability than the comps imply.
- What's the recent tenant-quality profile in this submarket — average credit score on applications, eviction rate, late-payment / NSF rate, and stable-employment percentage? A property-management company in the area should have these aggregated.
- How much new for-sale + rental construction is in the pipeline within 1–3 miles? Heavy new supply typically softens prices + rents 12–24 months out; constrained supply supports both.
Investment metrics
- 1% rule
- 1.33% ✓
- Cap rate
- 11.35%
- Cash-on-cash
- 18.06%
- DSCR
- 1.80
- GRM
- 6.3
CMA / ARV
No comps found within radius.
Projected returns pro-forma
7.96% appreciation · 3.0% rent growth · sell at horizon
- IRR
- 34.1%
- Equity multiple
- 3.42×
- Total profit
- $47,372
- Equity at exit
- $52,928
- IRR
- 30.4%
- Equity multiple
- 7.31×
- Total profit
- $123,476
- Equity at exit
- $104,893
Cash invested: $19,572 (down + closing). Projections, not guarantees.
Landlord ↔ Tenant lean methodology
- Overall (STATE)
- 73 Landlord-Friendly
- State Wisconsin
- 73 Landlord-Friendly · R+2
- County
- — inherits STATE
- City
- — inherits STATE
ZIP-level market 54746
- Home prices YoY
- 4.5%
- Active inventory
- 1
- Price-to-rent
- 6.3×
Monthly cashflow live
- Estimated rent
- $928 medium interval (Pro) →
- Mortgage (P&I)
- −$367
- Tax from tax record
- −$43 /mo · $516/yr
- Insurance
- −$29
- HOA
- −$0
- Vacancy / Maint / Mgmt
- −$195
- Net cashflow
- $295
Break-even live
UW: 25.0% down · 7.5% · 30yr · 1.5% tax · 5.0% vac · 8.0% maint · 8.0% mgmt
Financing live
Cash to close
- Down payment
- $17,475
- Closing costs
- $2,097
- Reserves months
- —
- Total cash needed
- —
Loan-product check · same deal, 3 products live
Conventional
25% down · 7.5% · 30yr
- Down + closing
- —
- Monthly P&I
- —
- Monthly cashflow
- —
- DSCR
- —
- Eligible?
- —
Personal DTI + credit; lowest rate.
DSCR
20% down · 8.5% · 30yr
- Down + closing
- —
- Monthly P&I
- —
- Monthly cashflow
- —
- DSCR
- —
- Eligible?
- —
No personal income docs; deal must DSCR.
Hard money
10% down · 12.0% · 12mo
- Down + closing
- —
- Monthly P&I
- —
- Monthly cashflow
- —
- DSCR
- —
- Eligible?
- —
Short-term bridge; refi at stabilization.
Listing history 17 events
-
2026-06-18days on market $69,900 Active 27 DOM
-
2026-06-17days on market $69,900 Active 26 DOM
-
2026-06-16days on market $69,900 Active 25 DOM
-
2026-06-16price $69,900 Active 24 DOM
-
2026-06-15days on market $79,900 Active 24 DOM
-
2026-06-15days on market $79,900 Active 23 DOM
-
2026-06-13days on market $79,900 Active 22 DOM
-
2026-06-12days on market $79,900 Active 21 DOM
-
2026-06-09days on market $79,900 Active 18 DOM
-
2026-06-08days on market $79,900 Active 17 DOM
-
2026-06-08days on market $79,900 Active 16 DOM
-
2026-06-05days on market $79,900 Active 14 DOM
-
2026-06-03days on market $79,900 Active 12 DOM
-
2026-06-02days on market $79,900 Active 11 DOM
-
2026-06-01days on market $79,900 Active 10 DOM
-
2026-05-31days on market $79,900 Active 9 DOM
-
2026-05-21$79,900 Active
ⓘ Source: listings_history table (triggers on properties + properties_extension) + one-shot
backfill from property_details.listing_events for pre-trigger history.
Tax reassessment forecast WI · Partial reset (capped growth)
- Current annual tax
- $516 · $43/mo
- Projected year-2 tax
- $905 · $75/mo
- Expected delta
- +$389/yr (+$32/mo · 75.3%)
ⓘ Screening estimate from a state-policy table — verify with the county assessor before closing.
Climate risk First Street
- Flood 1/10 Low FEMA zone X (unshaded) · 0% chance over 30 yrs
- Wildfire 3/10 Moderate
- Heat 2/10 Low 7 d/yr ≥97°F today · 14 d/yr by 30 yrs out
- Wind 2/10 Low
- Air quality 1/10 Low 0 unhealthy d/yr today · 0 by 30 yrs out
Nearby sold comps map
Loading sold comps map…
Walkable amenities ~0.75 mi
Loading nearby amenities…
Taxation est. · year 1
- Rental income
- $11,137
- − Mortgage interest
- −$3,915
- − Property taxes
- −$516
- − Insurance
- −$350
- − Repairs & maintenance
- −$891
- − Management
- −$891
- − Depreciation
- −$2,033
- Taxable income
- $2,541
- Est. tax owed @ 24.0%
- −$610
- After-tax cash flow
- $2,924/yr
For passive investors: Depreciation is non-cash, so a rental often shows a tax loss while cash-flowing — sheltering income. Rental losses are passive: they offset passive income freely, and up to $25,000/yr can offset ordinary (W-2) income if you actively participate and your MAGI is under $100k (phasing out to $0 by $150k); unused losses carry forward. On sale, claimed depreciation is recaptured at up to 25%, and gains may owe capital-gains tax (a 1031 exchange can defer both). Figures are a year-1 estimate at your 24.0% rate — not tax advice; consult a CPA.
Schools (NCES district)
- District
- Alma Center School District
- NCES district ID
- 5500210
- Math proficiency
- 33% ▼ -4.00%
- Reading proficiency
- 29% ▼ -9.00%
- Median HH income
- $43,049
- Composite
- 26.39/100
- National rank
- #7231
- State rank
- #273 of 342 in WI
Livability — Mentor
No livability data for this city. (Only ~50 U.S. cities are tracked.)
Census & demographics
- Census place
- Humbird, WI
- Population (ZIP)
- 666
Population outlook (Clark County) Hauer SSP2
- Today (2025)
- 32,111 people
- By 2030
- 30,727 · -4.3%
- By 2040
- 28,092 · -12.5%
- By 2050
- 25,512 · -20.6%
- By 2075
- 20,054 · -37.5%
- By 2100
- 15,753 · -50.9%
Race, ethnicity, and origin ACS 2023
- Neighborhood character
- Predominantly White (89%)
- Race & ethnicity
- White 89% Hispanic / Latino 8% Two or more races 5% Native American 3%
- Hispanic origin (detail)
- Mexican 4%
- Common ancestry
- Portuguese 17% Lithuanian 5% Romanian 4%
- Foreign-born
- 4% · Canada
- Languages at home
- 94% English-only · Spanish 6%
Political lean MEDSL · Clark
- 2024 margin
- Solid R (+39.0) · D 29.4% · R 68.4% · Other 2.1%
- 2008→2024 swing
- -46.5pp toward R · 2008: 7.5pp · 2024: -39.0pp
- All cycles
- 2024: R+39.0 2020: R+36.8 2016: R+32.6 2012: R+8.9 2008: D+7.5
Not yet ingested
- Civics
- —
Market trends
- HPI YoY
- ▲ 7.96%
- Current HPI
- 184.49
- Rent YoY
- —
- Metro
- —
- State GDP YoY
- ▲ 2.10%
- F500 in state
- 20
Industry mix (Fortune 500 HQ in WI)
| Industry | F500 HQs | Revenue |
|---|---|---|
| Industrial Machinery | 4 | $23B |
|
||
| Industrial Technology | 2 | $36B |
|
||
| Insurance | 1 | $36B |
|
||
| Professional Services | 1 | $19B |
|
||
| Utilities | 1 | $9B |
|
||
| Consumer Goods | 1 | $3B |
|
||
Price history
1 event — show timeline
- 2026-05-21 Listed $79,900 RANWW
Property tax history
+10.3%/yrLatest (2025): $516 · -31.7% YoY. Source: county tax records.
Cash-flow waterfall
monthlySold comps — $/sqft
last 12 mo · ≤1 miLoading sold comps…