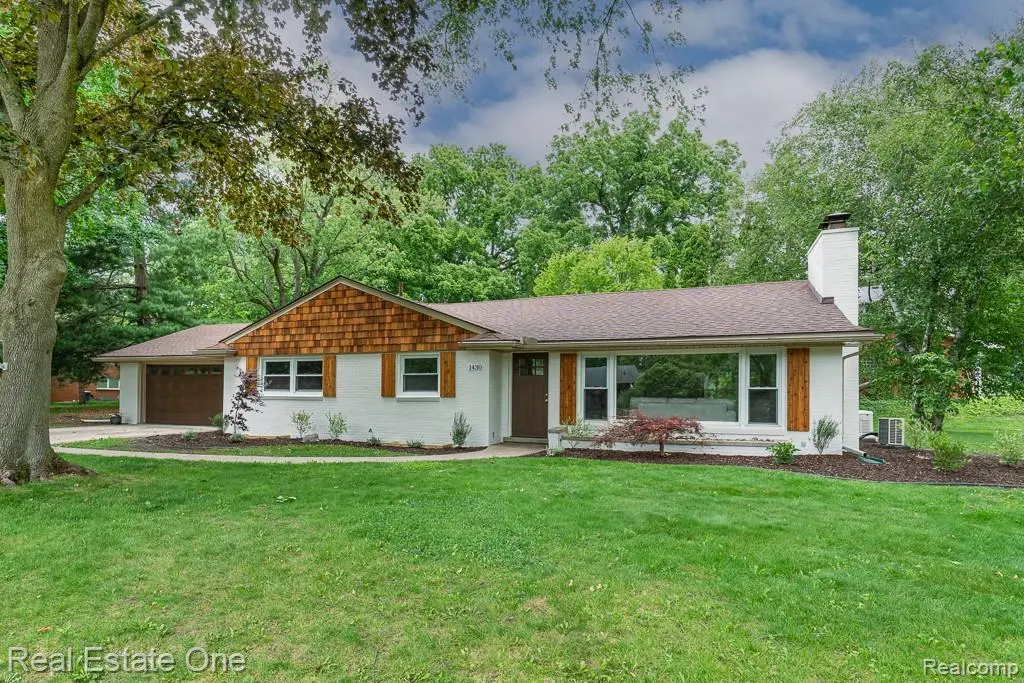
1430 Stockport Dr · Rochester Hills, MI
Flood risk 1/10 · Minimal
- FEMA flood zone
- X (unshaded)
- Chance of flooding over 30 yrs
- 0.0%
- Est. flood insurance / yr
- $473 – $860
Fire risk 1/10 · Minimal
- Est. fire insurance / yr
- $784 – $1,456
Heat risk 2/10 · Minimal
- Hot days now (above 97°F)
- 7 days/yr
- Hot days in 30 yrs
- 15 days/yr
Wind risk 2/10 · Minimal
- Chance of severe wind over 30 yrs
- —
Air-quality risk 3/10 · Minor
- Unhealthy air days now
- 2 days/yr
- Unhealthy air days in 30 yrs
- 5 days/yr
Risk factors via First Street. Map © Google.
Why this score? — see what drove the D+ grade
The composite is a weighted blend of 9 inputs, each scored 0–100. Each bar is that input's sub-score; the figure is the points it added to the 100-point composite (weight × sub-score).
- Cash flow +13.0/30.0
- ARV discount +11.0/15.0
- Schools +5.9/10.0
- DSCR +3.9/10.0
- Livability +3.9/5.0
- 1% rule +3.1/10.0
- Rent growth +2.5/5.0
- Condition / age +2.5/5.0
- Appreciation +0.0/10.0
$449,900
🖨 Deal sheet (PDF) 📄 Offer letter ✓ Due diligence
Listing remarks MLS
* Showings are now open! * WOW! Don't miss this GORGEOUS 2026 REMODELED RANCH in the HIGHLY SOUGHT-AFTER ROCHDALE SUBDIVISION, offering an unbeatable location just a SHORT WALK to shopping, restaurants, and schools, with DOWNTOWN ROCHESTER only minutes away. This MOVE-IN-READY HOME features BEAUTIFULLY REFINISHED HARDWOOD FLOORS throughout, a BRAND-NEW A/C, WHOLE-HOUSE GENERATOR, and NEW CEDAR SHAKE ACCENTS with NEW CEDAR SHUTTERS that enhance the home's curb appeal. The FIRST-FLOOR FULL BATHROOM has been COMPLETELY REMODELED with a NEW TUB, TILE, VANITY, and LIGHTING. The kitchen showcases NEW QUARTZ COUNTERTOPS, STAINLESS STEEL APPLIANCES, and a NEW MICROWAVE (2025). The FULLY FINISHED BASEMENT provides exceptional additional living space with a FIREPLACE, BAR AREA, and a NEWLY INSTALLED FULL BATHROOM (2026). This is a great opportunity to own an extensively updated ranch in one of Rochester Hills' most desirable neighborhoods. Call me to schedule your private showing today!
Key facts
- Completely remodeled
- Remodeled ranch
- Cedar shutters
Tags
Property features AI
Finance
- HOA & community: Homeowners association with $135 annual fee (about $11.25/month)
Exterior
- Parking: Attached 2-car garage
- Utilities: Public water; Public sewer
- Home design: Single-family residence; One level (with finished lower level); Ground-level entry with steps; Brick and wood siding exterior
- Construction: Asphalt roof; Block foundation; Built with brick and wood siding
- Exterior features: Patio; Paved road access; Pets allowed
Interior
- Kitchen: Built-in electric oven; Microwave; Disposal; Free-standing refrigerator
- Bathrooms: 2 full bathrooms
- Heating & cooling: Baseboard heating; Hot water heating; Natural gas heating; Wall cooling unit(s); ENERGY STAR qualified equipment
- Interior features: Entrance foyer; High-speed internet; Finished basement; Fireplace in living room (gas)
- Laundry & utility: Washer; Dryer; Gas water heater
Neighborhood map
What this means for you Summary
Snapshot
- This is a 3-bed/1.5-bath single-family listed at $450k.
Deal economics
- At list price, monthly cash flow is $-28 ($-332/yr) — negative.
- To cash-flow at today's rent, offer at most $445k (1.1% below list).
- To meet the 1% rule (rent ≥ 1% of price), the offer needs to be $365k (19.0% below list).
- Recommended offer: $365k (19.0% below list) — sets the bar for 1% rule.
- Cap rate 6.2% vs local median 2.8% in Rochester Hills — top-decile yield for the area; either an underpriced asset or a hidden risk that comps aren't pricing in. Stress-test before assuming the spread holds.
Location & tenants
- Location reads 77/100 on livability (#127 in MI, #3,163 nationally) — a middle-class / working-renter tenant base. Strengths: crime A+, employment A+, housing A+; Watch: health & safety D, amenities F, commute F.
- Rochester Community School District (suburban): math 60% / reading 69% proficiency, ranked #21 of 540 in MI (top 4%) — acceptable for families but not a draw, mixed tenant base, ~2y average lease; only 10% free/reduced lunch — higher-income household profile.
- Zoned schools: University Hills Elem School (math 67% / reading 62%, grade B, #132 of 1,397 statewide, top 11%, 397 students, 12% FRL); West Middle School (math 54% / reading 70%, grade B-, #58 of 713 statewide, top 9%, 843 students, 15% FRL); Rochester High School (math 54% / reading 73%, grade B-, #55 of 713 statewide, top 8%, 1,690 students, 23% FRL).
- Market conditions: 155 active listings in the ZIP; 4 comparable units currently listed for rent nearby; rentals at typical pace (median 26d on market — plan ~3-4 weeks tenant-placement turnaround); 2,614 units permitted in Oakland County in 2024 (721 in 5+ unit buildings).
Forward outlook
- Local home prices are declining (-3.0%/yr); year-one equity from $3k of loan paydown is wiped out by about $13k of value loss. Plan a longer hold.
- Oakland County population projected at +10% by 2050 — modest demand growth; plan on rents tracking national, not racing it.
Negotiation context
- Only 1 days on market — expect competitive offers; lowballing is unlikely to land.
- 6 sale attempts since 9y ago with the ask held roughly flat each time — persistent listings suggest the price (not the market) is what's stuck; bring a comps-based counter.
- Current owner paid $329k; 37% above their basis — modest negotiation headroom, anchor on the comps not their cost.
Risks & watch-outs
- Watch-outs: built in 1954 — expect roof / HVAC / electrical / plumbing capex.
Questions for the listing agent
- What do current leases actually rent for vs. the listed asking? Can we see a recent rent roll and the last 12 months of T-12 income?
- Built in 1954 — when were the roof, HVAC, electrical panel, plumbing, and water heater last replaced?
- What does the HOA fee cover, when was the last increase, and are there any pending special assessments or reserve-fund shortfalls?
- Is there a deadline driving the sale (1031 exchange, divorce, estate, relocation)? That informs how much negotiation room exists.
- Schools are A-rated — typically a magnet for longer-tenancy family renters. What's the average tenant stay here, and is there a school-zone premium baked into asking?
- The area grade is low — what's the realistic commute time and amenity access for the typical tenant pool here? Any planned neighborhood developments (good or bad) we should know about?
- What's the average days-on-market for RENTAL listings here right now (not sales)? A rising rental-DOM trend means longer vacancies and softer asking-rent achievability than the comps imply.
- What's the recent tenant-quality profile in this submarket — average credit score on applications, eviction rate, late-payment / NSF rate, and stable-employment percentage? A property-management company in the area should have these aggregated.
- How much new for-sale + rental construction is in the pipeline within 1–3 miles? Heavy new supply typically softens prices + rents 12–24 months out; constrained supply supports both.
Investment metrics
- 1% rule
- 0.81% ✗
- Cap rate
- 6.22%
- Cash-on-cash
- -0.26%
- DSCR
- 0.99
- GRM
- 10.3
CMA / ARV
- ARV (on-the-fly)
- $487,620
- Comps found
- 12
Show comp detail 12 sales within ~0.75 mi
| Address | Dist | Beds/Ba | Sqft | Sold | Price | $/sf | Match |
|---|---|---|---|---|---|---|---|
| 1726 Black Maple Dr | 0.42mi | 3/2.5 | 2,244 (-1%) | 10mo | $540,000 | $241 | 66 |
| 1811 Ansal Dr | 0.54mi | 3/2.5 | 2,361 (+4%) | 6mo | $471,000 | $199 | 59 |
| 184 Shagbark Dr | 0.41mi | 3/2.0 | 2,008 (-12%) | 4mo | $340,000 | $169 | 57 |
| 902 Roselawn Dr | 0.74mi | 3/2.0 | 2,177 (-4%) | 0mo | $350,000 | $161 | 57 |
| 421 Nesbit Ln | 0.47mi | 3/1.5 | 2,599 (+15%) | 1mo | $299,500 | $115 | 53 |
| 277 Grosse Pines Dr | 0.71mi | 3/2.5 | 2,233 (-2%) | 9mo | $499,995 | $224 | 52 |
| 800 Ravine Terrace Dr | 0.71mi | 4/2.5 (+1) | 2,340 (+3%) | 1mo | $538,000 | $230 | 52 |
| 448 Streamview Ct | 0.58mi | 3/2.5 | 2,120 (-6%) | 8mo | $515,000 | $243 | 52 |
| 758 Lake Forest Rd | 0.72mi | 3/2.5 | 2,183 (-4%) | 6mo | $470,000 | $215 | 51 |
| 887 Ravine Terrace Dr | 0.70mi | 4/2.5 (+1) | 2,078 (-8%) | 10mo | $495,000 | $238 | 36 |
| 541 Lake Forest Rd | 0.52mi | 4/2.5 (+1) | 2,586 (+14%) | 9mo | $475,000 | $184 | 36 |
| 307 Old Perch Rd | 0.67mi | 4/2.5 (+1) | 2,608 (+15%) | 0mo | $510,000 | $196 | 35 |
Match score weights: distance 35% · size 25% · config 20% · recency 20%. Top-matched comps best support the ARV.
Projected returns pro-forma
-3.0% appreciation · 3.0% rent growth · sell at horizon
- IRR
- -16.8%
- Equity multiple
- 0.41×
- Total profit
- $-74,734
- Equity at exit
- $67,082
- IRR
- -8.6%
- Equity multiple
- 0.46×
- Total profit
- $-67,625
- Equity at exit
- $38,899
Cash invested: $125,972 (down + closing). Projections, not guarantees.
Landlord ↔ Tenant lean methodology
- Overall (STATE)
- 62 Landlord-Friendly
- State Michigan
- 62 Landlord-Friendly · EVEN
- County
- — inherits STATE
- City
- — inherits STATE
ZIP-level market 48309
- Active inventory
- 155
- Price-to-rent
- 10.3×
Monthly cashflow live
- Estimated rent
- $3,645 medium interval (Pro) →
- Mortgage (P&I)
- −$2,359
- Tax from tax record
- −$350 /mo · $4,197/yr
- Insurance
- −$187
- HOA
- −$11
- Vacancy / Maint / Mgmt
- −$766
- Net cashflow
- $-28
Break-even live
Sensitivity live
| Price | -10% $227 | -5% $100 | +0% $-28 | +5% $-155 | +10% $-282 |
|---|---|---|---|---|---|
| Rent | -10% $-316 | -5% $-172 | +0% $-28 | +5% $116 | +10% $260 |
| Rate | -1.0pp $199 | -0.5pp $87 | base $-28 | +0.5pp $-144 | +1.0pp $-263 |
UW: 25.0% down · 7.5% · 30yr · 1.5% tax · 5.0% vac · 8.0% maint · 8.0% mgmt
Financing live
Cash to close
- Down payment
- $112,475
- Closing costs
- $13,497
- Reserves months
- —
- Total cash needed
- —
Loan-product check · same deal, 3 products live
Conventional
25% down · 7.5% · 30yr
- Down + closing
- —
- Monthly P&I
- —
- Monthly cashflow
- —
- DSCR
- —
- Eligible?
- —
Personal DTI + credit; lowest rate.
DSCR
20% down · 8.5% · 30yr
- Down + closing
- —
- Monthly P&I
- —
- Monthly cashflow
- —
- DSCR
- —
- Eligible?
- —
No personal income docs; deal must DSCR.
Hard money
10% down · 12.0% · 12mo
- Down + closing
- —
- Monthly P&I
- —
- Monthly cashflow
- —
- DSCR
- —
- Eligible?
- —
Short-term bridge; refi at stabilization.
Rent comps 4 comps
| Address | Beds | Baths | Sqft | Rent | $/sqft | DOM | Units | Dist |
|---|---|---|---|---|---|---|---|---|
| 1467 Rochdale Pond Ct Rochester Hills, MI | 4.0 | 3.0 | 2510 | $4,375 | $1.74 | 25d | 1 | 0.38mi |
| 295 Nesbit Ln Rochester Hills, MI | 3.0 | 3.0 | 1601 | $3,000 | $1.87 | 1d | 1 | 0.46mi |
| 266 Mill St Rochester, MI | 2.0 | 2.5 | 1594 | $3,000 | $1.88 | 26d | 1 | 1.35mi |
| 709 Denham Ln Rochester Hills, MI | 3.0 | 2.5 | 2252 | $3,000 | $1.33 | 26d | 1 | 1.49mi |
HOA detail
- Monthly dues
- $11 · $132/yr
Listing history 2 events
-
2026-06-21remarks 693-char remark
-
2026-06-21$449,900 Active 1 DOM
ⓘ Source: listings_history table (triggers on properties + properties_extension) + one-shot
backfill from property_details.listing_events for pre-trigger history.
Tax reassessment forecast MI · Partial reset (capped growth)
- Current annual tax
- $4,197 · $350/mo
- Projected year-2 tax
- $5,563 · $464/mo
- Expected delta
- +$1,366/yr (+$114/mo · 32.5%)
ⓘ Screening estimate from a state-policy table — verify with the county assessor before closing.
Climate risk First Street
- Flood 1/10 Low FEMA zone X (unshaded) · 0% chance over 30 yrs
- Wildfire 1/10 Low
- Heat 2/10 Low 7 d/yr ≥97°F today · 15 d/yr by 30 yrs out
- Wind 2/10 Low
- Air quality 3/10 Moderate 2 unhealthy d/yr today · 5 by 30 yrs out
Nearby sold comps map
Loading sold comps map…
Walkable amenities ~0.75 mi
Loading nearby amenities…
Taxation est. · year 1
- Rental income
- $43,745
- − Mortgage interest
- −$25,201
- − Property taxes
- −$4,197
- − Insurance
- −$2,250
- − Repairs & maintenance
- −$3,500
- − Management
- −$3,500
- − HOA
- −$132
- − Depreciation
- −$13,088
- Taxable loss
- −$8,122
- Est. tax savings @ 24.0%
- +$1,949
- After-tax cash flow
- $1,617/yr
For passive investors: Depreciation is non-cash, so a rental often shows a tax loss while cash-flowing — sheltering income. Rental losses are passive: they offset passive income freely, and up to $25,000/yr can offset ordinary (W-2) income if you actively participate and your MAGI is under $100k (phasing out to $0 by $150k); unused losses carry forward. On sale, claimed depreciation is recaptured at up to 25%, and gains may owe capital-gains tax (a 1031 exchange can defer both). Figures are a year-1 estimate at your 24.0% rate — not tax advice; consult a CPA.
Schools (NCES district)
- District
- Rochester Community School District
- NCES district ID
- 2629940
- Math proficiency
- 60% ▼ -9.00%
- Reading proficiency
- 69% ▼ -4.00%
- Median HH income
- $89,242
- Composite
- 58.53/100
- National rank
- #994
- State rank
- #21 of 540 in MI
Livability — Rochester Hills
- Score
- 77/100
- State rank
- #127
- US rank
- #3163
Category grades
Schools grade is shown separately in the Schools card above.
Census & demographics
- Census place
- Rochester Hills, MI
- City population
- 44,714
- Population (ZIP)
- 30,254
Population outlook (Oakland County) Hauer SSP2
- Today (2025)
- 1,335,747 people
- By 2030
- 1,375,100 · +2.9%
- By 2040
- 1,435,385 · +7.5%
- By 2050
- 1,469,250 · +10.0%
- By 2075
- 1,531,946 · +14.7%
- By 2100
- 1,450,485 · +8.6%
Race, ethnicity, and origin ACS 2023
- Neighborhood character
- Predominantly White (75%)
- Race & ethnicity
- White 75% Asian 12% Two or more races 6% Hispanic / Latino 4% Black 4%
- Common ancestry
- Romanian 10% Lithuanian 3% Slovak 3%
- Foreign-born
- 19% · Canada, China, South Korea
- Languages at home
- 80% English-only · Other Indo-European 6% Chinese 3% Russian/Polish/Slavic 2%
Political lean MEDSL · Oakland
- 2024 margin
- D (+10.6) · D 54.4% · R 43.8% · Other 1.9%
- 2008→2024 swing
- -3.9pp toward R · 2008: 14.5pp · 2024: 10.6pp
- All cycles
- 2024: D+10.6 2020: D+14.1 2016: D+8.1 2012: D+8.1 2008: D+14.5
Not yet ingested
- Civics
- —
Market trends
- HPI YoY
- ▼ -136.99%
- Current HPI
- 201.9197
- Rent YoY
- —
- Metro
- —
- State GDP YoY
- ▲ 1.37%
- F500 in state
- 28
Industry mix (Fortune 500 HQ in MI)
| Industry | F500 HQs | Revenue |
|---|---|---|
| Automotive Parts | 3 | $48B |
|
||
| Automotive | 2 | $372B |
|
||
| Chemicals | 1 | $45B |
|
||
| Automotive Retail | 1 | $29B |
|
||
| Healthcare / Medical Devices | 1 | $23B |
|
||
| Automotive Technology | 1 | $20B |
|
||
Price history
+73.0% since first listed18 events — show timeline
- 2026-06-20 Listed $449,900 MiRealSource-MiMLS
- 2026-06-20 Listed $449,900 REALCOMP
- 2026-06-19 Coming Soon $449,900 MiRealSource-MiMLS
- 2026-04-16 Sold (Public Records) $329,000 Public Records
- 2026-04-14 Sold (MLS) $329,000 MiRealSource-MiMLS
- 2026-04-14 Sold (MLS) $329,000 REALCOMP
- 2026-03-27 Pending — MiRealSource-MiMLS
- 2026-03-27 Pending — REALCOMP
- 2026-03-22 Listed $349,900 MiRealSource-MiMLS
- 2026-03-22 Listed $349,900 REALCOMP
- 2026-03-20 Coming Soon $349,900 MiRealSource-MiMLS
- 2017-05-08 Sold (Public Records) $250,000 Public Records
- 2017-04-28 Sold (MLS) $250,000 MiRealSource-MiMLS
- 2017-04-28 Sold (MLS) $250,000 REALCOMP
- 2017-03-29 Pending — MiRealSource-MiMLS
- 2017-03-29 Pending — REALCOMP
- 2017-03-18 Listed $260,000 MiRealSource-MiMLS
- 2017-03-18 Listed $260,000 REALCOMP
Property tax history
+3.7%/yrLatest (2025): $4,197 · +4.3% YoY. Source: county tax records.
Cash-flow waterfall
monthlySold comps — $/sqft
last 12 mo · ≤1 miLoading sold comps…