504 Idlewood Park Dr · Oak Grove, SC
Flood risk 1/10 · Minimal
- FEMA flood zone
- X (unshaded)
- Chance of flooding over 30 yrs
- 0.0%
- Est. flood insurance / yr
- $507 – $1,088
Fire risk 3/10 · Minor
- Est. fire insurance / yr
- $783 – $1,453
Heat risk 7/10 · Major
- Hot days now (above 108°F)
- 7 days/yr
- Hot days in 30 yrs
- 16 days/yr
Wind risk 6/10 · Moderate
- Chance of severe wind over 30 yrs
- 64.0%
Air-quality risk 3/10 · Minor
- Unhealthy air days now
- 2 days/yr
- Unhealthy air days in 30 yrs
- 2 days/yr
Risk factors via First Street. Map © Google.
Why this score? — see what drove the D grade
The composite is a weighted blend of 9 inputs, each scored 0–100. Each bar is that input's sub-score; the figure is the points it added to the 100-point composite (weight × sub-score).
- Cash flow +13.5/30.0
- ARV discount +7.5/15.0
- Schools +4.2/10.0
- DSCR +4.1/10.0
- Rent growth +3.6/5.0
- Livability +3.3/5.0
- 1% rule +3.0/10.0
- Condition / age +2.5/5.0
- Appreciation +0.0/10.0
$177,000
🖨 Deal sheet (PDF) 📄 Offer letter ✓ Due diligence
Listing remarks
Don’t miss your chance to own this beautifully maintained townhome in Maple Tree Towns, ideally located just off Highway 1 between I-20 and I-26. With quick access to CAE Airport, downtown Columbia, Lake Murray, and downtown Lexington, this spot is perfect for commuters, frequent travelers, or anyone wanting low-maintenance living in the heart of it all. The main level features durable LVP flooring, high ceilings, and an open-concept living and dining area that feels bright and spacious. The kitchen offers abundant cabinet storage and generous counter space, making everyday living and entertaining easy. A convenient half bath and additional storage downstairs add to the functionality.
Key facts
- $50 HOA
- Built 2011
- Listed 106 days
Tags
Property features AI
Finance
- Other: Cable available
- HOA & community: Property is part of a homeowners association
Exterior
- Utilities: Public water; Public sewer
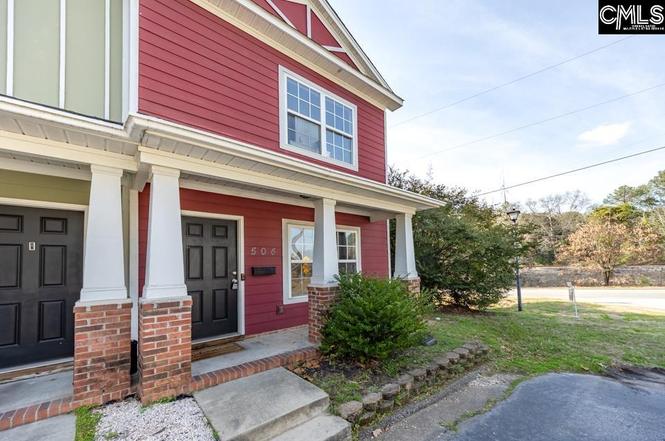
- Home design: Two-story townhouse-style home; Fiber cement (Hardie Plank) exterior
- Construction: Slab foundation
- Exterior features: Covered front porch; Patio; Rear vinyl fencing
Interior
- Kitchen: Formica countertops; Painted cabinets; Tile floor; Prep sink; Microwave above the stove; Free-standing range; Dishwasher; Garbage disposal; Refrigerator included
- Bedrooms: Master bedroom (second floor) with garden tub, separate shower, his-and-hers closet, high ceilings, ceiling fan, and tile floors; Second bedroom (second floor) with walk-in closet, shared tub/shower, high ceilings, ceiling fan, and carpeted floors
- Flooring: Luxury vinyl plank in the great room; Tile flooring in kitchen and master bedroom; Carpet in secondary bedroom
- Bathrooms: Two full bathrooms; One half bathroom; Second bathrooms (full) — two
- Heating & cooling: Central heating; Central cooling
- Interior features: Attic storage with attic access; Smoke detector; Molding and high ceilings in the great room; Ceiling fans in great room and bedrooms
- Laundry & utility: Main-level laundry in a closet (heated space); Electric water heater
Neighborhood map
What this means for you Summary
Snapshot
- This is a 2-bed/2.5-bath townhouse listed at $177k.
Deal economics
- At list price, monthly cash flow is $6 ($73/yr) — positive.
- The deal already cash-flows at list — no discount required.
- To meet the 1% rule (rent ≥ 1% of price), the offer needs to be $141k (20.4% below list).
- Recommended offer: $141k (20.4% below list) — sets the bar for 1% rule.
Location & tenants
- Location reads 66/100 on livability (#114 in SC) — a middle-class / working-renter tenant base. Strengths: cost of living A+, housing A+, health & safety B; Watch: crime D, amenities F, commute F.
- Lexington 01 (suburban): math 42% / reading 53% proficiency, ranked #11 of 80 in SC (top 14%) — families likely to look elsewhere, expect single-tenant / working-renter base with shorter leases.
- Zoned schools: Oak Grove Elementary (math 37% / reading 39%, grade F, #308 of 597 statewide, top 52%, 738 students, 35% FRL); White Knoll Middle (math 19% / reading 31%, grade F, #165 of 229 statewide, top 72%, 816 students, 52% FRL); White Knoll High (math 47% / reading 85%, grade B, #81 of 196 statewide, top 42%, 2,204 students, 45% FRL).
- Market conditions: Rents rising fast (+4.6%/yr); 193 active listings in the ZIP; 3 comparable units currently listed for rent nearby; rentals leasing fast (median 5d on market — plan ~1-2 weeks tenant-placement turnaround); 1,712 units permitted in Lexington County in 2024 (0 in 5+ unit buildings).
Forward outlook
- Local home prices are declining (-3.0%/yr); year-one equity from $1k of loan paydown is wiped out by about $5k of value loss. Plan a longer hold.
- Lexington County population projected at +26% by 2050 — long-run rental-demand tailwind backs the buy-and-hold thesis.
Negotiation context
- It's been on market 106 days — a 9% lower offer ($161k) is reasonable based on typical stale-listing flexibility.
- 2 sale attempts with the ask held roughly flat each time — persistent listings suggest the price (not the market) is what's stuck; bring a comps-based counter.
Risks & watch-outs
- Climate carrying-cost: major wind risk, 64% chance of damaging wind over 30y; extreme-heat days projected 7→16/yr by 2055 (HVAC capex compounding) — expect insurance premiums to compound above CPI over the hold.
Questions for the listing agent
- It's been on market 106 days. Have you received any prior offers? Is the seller open to a 20% concession, seller financing, or rate buy-down credit?
- What does the HOA fee cover, when was the last increase, and are there any pending special assessments or reserve-fund shortfalls?
- Why hasn't it sold? Are there any deal-killer items the seller is aware of (foundation, flood, title, zoning, code violations)?
- Is there a deadline driving the sale (1031 exchange, divorce, estate, relocation)? That informs how much negotiation room exists.
- Schools are D-rated, which usually means shorter tenancies and higher turnover. Who's the typical renter profile here, and what's been the actual vacancy rate?
- Crime grade is D in this area — have there been break-ins, vandalism, or insurance claims at this property in the last 3 years? What carrier currently insures it and at what premium?
- The area grade is low — what's the realistic commute time and amenity access for the typical tenant pool here? Any planned neighborhood developments (good or bad) we should know about?
- What's the average days-on-market for RENTAL listings here right now (not sales)? A rising rental-DOM trend means longer vacancies and softer asking-rent achievability than the comps imply.
- What's the recent tenant-quality profile in this submarket — average credit score on applications, eviction rate, late-payment / NSF rate, and stable-employment percentage? A property-management company in the area should have these aggregated.
- How much new for-sale + rental construction is in the pipeline within 1–3 miles? Heavy new supply typically softens prices + rents 12–24 months out; constrained supply supports both.
Investment metrics
- 1% rule
- 0.80% ✗
- Cap rate
- 6.33%
- Cash-on-cash
- 0.15%
- DSCR
- 1.01
- GRM
- 10.5
CMA / ARV
No comps found within radius.
Projected returns pro-forma
-3.0% appreciation · 4.57% rent growth · sell at horizon
- IRR
- -14.5%
- Equity multiple
- 0.47×
- Total profit
- $-26,086
- Equity at exit
- $26,391
- IRR
- -3.7%
- Equity multiple
- 0.74×
- Total profit
- $-12,849
- Equity at exit
- $15,304
Cash invested: $49,560 (down + closing). Projections, not guarantees.
Landlord ↔ Tenant lean methodology
- Overall (STATE)
- 90 Strongly Landlord-Friendly
- State South Carolina
- 90 Strongly Landlord-Friendly · R+6
- County
- — inherits STATE
- City
- — inherits STATE
ZIP-level market 29170
- Home prices YoY
- -16.9%
- Rents YoY
- 4.6%
- Active inventory
- 193
- Price-to-rent
- 10.5×
Monthly cashflow live
- Estimated rent
- $1,408 medium interval (Pro) →
- Mortgage (P&I)
- −$928
- Tax from tax record
- −$55 /mo · $654/yr
- Insurance
- −$74
- HOA
- −$50
- Vacancy / Maint / Mgmt
- −$296
- Net cashflow
- $6
Break-even live
Sensitivity live
| Price | -10% $106 | -5% $56 | +0% $6 | +5% $-44 | +10% $-94 |
|---|---|---|---|---|---|
| Rent | -10% $-105 | -5% $-50 | +0% $6 | +5% $62 | +10% $117 |
| Rate | -1.0pp $95 | -0.5pp $51 | base $6 | +0.5pp $-40 | +1.0pp $-86 |
UW: 25.0% down · 7.5% · 30yr · 1.5% tax · 5.0% vac · 8.0% maint · 8.0% mgmt
Financing live
Cash to close
- Down payment
- $44,250
- Closing costs
- $5,310
- Reserves months
- —
- Total cash needed
- —
Loan-product check · same deal, 3 products live
Conventional
25% down · 7.5% · 30yr
- Down + closing
- —
- Monthly P&I
- —
- Monthly cashflow
- —
- DSCR
- —
- Eligible?
- —
Personal DTI + credit; lowest rate.
DSCR
20% down · 8.5% · 30yr
- Down + closing
- —
- Monthly P&I
- —
- Monthly cashflow
- —
- DSCR
- —
- Eligible?
- —
No personal income docs; deal must DSCR.
Hard money
10% down · 12.0% · 12mo
- Down + closing
- —
- Monthly P&I
- —
- Monthly cashflow
- —
- DSCR
- —
- Eligible?
- —
Short-term bridge; refi at stabilization.
Rent comps 3 comps
| Address | Beds | Baths | Sqft | Rent | $/sqft | DOM | Units | Dist |
|---|---|---|---|---|---|---|---|---|
| 536 Idlewood Park Dr West Columbia, SC | 2.0 | 2.5 | 1100 | $1,395 | $1.27 | 25d | 1 | 0.03mi |
| 105 Landford Ct Lexington, SC | 3.0 | 2.0 | 1260 | $1,450 | $1.15 | 5d | 1 | 0.78mi |
| 200 # W Unit Woodberry Rd unit West Columbia, SC | 2.0 | 2.0 | 1000 | $1,300 | $1.30 | 4d | 1 | 0.80mi |
HOA detail
- Monthly dues
- $50 · $600/yr
Listing history 19 events
-
2026-06-22days on market $177,000 Active 106 DOM
-
2026-06-18days on market $177,000 Active 103 DOM
-
2026-06-17days on market $177,000 Active 102 DOM
-
2026-06-16days on market $177,000 Active 101 DOM
-
2026-06-15days on market $177,000 Active 100 DOM
-
2026-06-14days on market $177,000 Active 98 DOM
-
2026-06-10days on market $177,000 Active 95 DOM
-
2026-06-09days on market $177,000 Active 94 DOM
-
2026-06-08days on market $177,000 Active 93 DOM
-
2026-06-07days on market $177,000 Active 92 DOM
-
2026-06-03days on market $177,000 Active 88 DOM
-
2026-06-03days on market $177,000 Active 87 DOM
-
2026-06-02days on market $177,000 Active 86 DOM
-
2026-05-31days on market $177,000 Active 85 DOM
-
2026-03-07$177,000 Active
-
2025-10-22price $177,000
-
2025-10-10price $185,000
-
2025-09-26$199,000 Active
-
2015-10-30soldstatus $245,000
ⓘ Source: listings_history table (triggers on properties + properties_extension) + one-shot
backfill from property_details.listing_events for pre-trigger history.
Tax reassessment forecast SC · Resets to sale price
- Current annual tax
- $654 · $55/mo
- Projected year-2 tax
- $1,009 · $84/mo
- Expected delta
- +$355/yr (+$30/mo · 54.3%)
ⓘ Screening estimate from a state-policy table — verify with the county assessor before closing.
Climate risk First Street
- Flood 1/10 Low FEMA zone X (unshaded) · 0% chance over 30 yrs
- Wildfire 3/10 Moderate
- Heat 7/10 Severe 7 d/yr ≥108°F today · 16 d/yr by 30 yrs out
- Wind 6/10 Major 64% chance of damaging wind over 30 yrs
- Air quality 3/10 Moderate 2 unhealthy d/yr today · 2 by 30 yrs out
Nearby sold comps map
Loading sold comps map…
Walkable amenities ~0.75 mi
Loading nearby amenities…
Taxation est. · year 1
- Rental income
- $16,899
- − Mortgage interest
- −$9,915
- − Property taxes
- −$654
- − Insurance
- −$885
- − Repairs & maintenance
- −$1,352
- − Management
- −$1,352
- − HOA
- −$600
- − Depreciation
- −$5,149
- Taxable loss
- −$3,007
- Est. tax savings @ 24.0%
- +$722
- After-tax cash flow
- $795/yr
For passive investors: Depreciation is non-cash, so a rental often shows a tax loss while cash-flowing — sheltering income. Rental losses are passive: they offset passive income freely, and up to $25,000/yr can offset ordinary (W-2) income if you actively participate and your MAGI is under $100k (phasing out to $0 by $150k); unused losses carry forward. On sale, claimed depreciation is recaptured at up to 25%, and gains may owe capital-gains tax (a 1031 exchange can defer both). Figures are a year-1 estimate at your 24.0% rate — not tax advice; consult a CPA.
Schools (NCES district)
- District
- Lexington 01
- NCES district ID
- 4502700
- Math proficiency
- 42% ▼ -12.00%
- Reading proficiency
- 53% ▼ -2.00%
- Median HH income
- $61,298
- Composite
- 41.75/100
- National rank
- #3399
- State rank
- #11 of 80 in SC
Livability — Oak Grove
- Score
- 66/100
- State rank
- #114
- US rank
- #11681
Category grades
Schools grade is shown separately in the Schools card above.
Census & demographics
- Census place
- Oak Grove, SC
- County
- Lexington County · 232,571 people
- Metro
- Columbia, SC
- Population (ZIP)
- 21,247
- Household income
- $74,902
- Rent vs Own
- Severe rent burden
- 147.0
Population outlook (Lexington County) Hauer SSP2
- Today (2025)
- 322,999 people
- By 2030
- 342,356 · +6.0%
- By 2040
- 377,715 · +16.9%
- By 2050
- 406,984 · +26.0%
- By 2075
- 465,447 · +44.1%
- By 2100
- 485,674 · +50.4%
Race, ethnicity, and origin ACS 2023
- Neighborhood character
- Predominantly White (66%)
- Race & ethnicity
- White 66% Black 17% Hispanic / Latino 10% Two or more races 8% Asian 3%
- Hispanic origin (detail)
- Mexican 6% Puerto Rican 1%
- Common ancestry
- Serbian 2% Italian 2% Romanian 2%
- Foreign-born
- 9% · Canada, Jamaica, Guatemala
- Languages at home
- 90% English-only · Spanish 7% Other Indo-European 2%
Political lean MEDSL · Lexington
- 2024 margin
- Solid R (+33.5) · D 32.5% · R 66.0% · Other 1.4%
- 2008→2024 swing
- +4.6pp toward D · 2008: -38.0pp · 2024: -33.5pp
- All cycles
- 2024: R+33.5 2020: R+30.1 2016: R+36.7 2012: R+37.8 2008: R+38.0
Not yet ingested
- Civics
- —
Market trends
- HPI YoY
- ▼ -52.72%
- Current HPI
- 259.713
- Rent YoY
- ▲ 4.57%
- Metro
- Columbia, SC
- State GDP YoY
- ▲ 4.51%
- F500 in state
- 2
Industry mix (Fortune 500 HQ in SC)
| Industry | F500 HQs | Revenue |
|---|---|---|
| Packaging | 1 | $7B |
|
||
Price history
-27.8% since first listed5 events — show timeline
- 2026-03-07 Listed $177,000 Consolidated MLS
- 2025-10-22 Price Changed $177,000 Consolidated MLS
- 2025-10-10 Price Changed $185,000 Consolidated MLS
- 2025-09-26 Listed $199,000 Consolidated MLS
- 2015-10-30 Sold (Public Records) $245,000 Public Records
Property tax history
-9.0%/yrLatest (2024): $654 · +4.4% YoY. Source: county tax records.
Cash-flow waterfall
monthlySold comps — $/sqft
last 12 mo · ≤1 miLoading sold comps…